Abstract—The future of Higher Education Institutions (HEI) depend on their ability to attract and retain students, increase recognition and prestige. In order to respond to the 'customers' increasingly demanding, HEI need to identify the key factors that influence the satisfaction of a 'customers', thereby creating competitive advantages. These determinants of satisfaction are important elements that guide the strategy of an institution and allow the successful achievement of strategic plans, both teaching and administrative, to offer their ‘costumers’ services and products with higher quality. Following this way of thinking, the purpose of this study was to evaluate the satisfaction with the service quality of the School of Technology and Management of Bragança (ESTiG), of the Polytechnic Institute of Bragança, identifying, thus, the dimensions related to the quality of services that might influence students' satisfaction. The results showed that, in general, the students are satisfied with the performance of ESTiG.
Keywords—Customer Satisfaction; Higher Education Institutions; Importance-Satisfaction Model.
I. INTRODUCTION
UALITY has become an important subject of discussion among Higher Education Institutions (HEI), and has been extensively studied in recent years. Just like any other organizations, to be successful, HEI have to perform their role effectively. In this context one of the main ways to attract students -‘costumers’- is to find out if they are satisfied with the performance of the institution when compared to their expectations at their arrival and also during their academic years.
According to this, it is crucial that HEI make an authentic effort to measure their performance on a regular basis. There are many measures of performance and one of them, the Importance-Satisfaction Analysis can be used to evaluate the performance of a Higher Education Institution. This methodology is supported by the intersection of two dimensions, such as the level of satisfaction derived from students who use the services and the degree of importance
Silva, Fátima is with the Polytechnic Institute of Bragança, Apartado 1134, CO 5300-857 Bragança, Portugal (phone: +351273303000; fax: +351273313051; e-mail: [email protected]).
Fernandes, Paula Odete is with the Economics and Management Department, Polytechnic Institute of Bragança and NECE-Research Unit in Business Sciences (UBI) CO 5300-857 Bragança, Portugal (corresponding author to provide phone: +351273303103; fax: +351273313051; e-mail: [email protected]).
they attach to the services, it is possible to determine whether a HEI has provided the services that fulfilled the needs of its students.
So, the main reason for this study is to increase the literature available in management service quality in higher education. This will be completed through assessing and comparing the perception of undergraduate students at School of Technology and Management of Polytechnic Institute of Bragança (Portugal).
The data for this study was collected in classroom via a questionnaire answered by students who attend the undergraduate and graduate programs at the School of Technology and Management of Polytechnic Institute of Bragança, located in the town of Bragança, Portugal. The instrument used was divided into two sections; Section I – students’ personal information, and Section II - students' perceptions of the importance and performance and their satisfaction towards with several attributes. The attributes under consideration are: Quality of General Aspects, Quality of the Library, Quality of Computer Laboratory Facilities, Quality of Academic Services, Quality of Teaching Aspects, Quality of Undergraduate Programs, and Quality of External Relations. The survey was conducted during April and May, 2010, during the 2nd semester of the 2009/2010 academic year. A total of 695 valid questionnaires were received, which represents 34% of the total student population (2.031 students). The sample size showed a sampling error of 3,7%, assuming a 95% accuracy level.
According to the objective of the study, this article is organized as follows: Section 2 - Overview of Importance-Satisfaction Model; Section 3 - presentation and discussion of research results; and finally, the conclusions are described in Section 4.
II.IMPORTANCE-SATISFACTION MODEL
Importance-Performance Analysis was introduced by Martilla and James, in 1977 as a method for developing and analysing business strategies [1]. Since its origins, the importance-performance analysis has been applied to different areas. Importance-Performance Analysis is a helpful tool in evaluating Institutions of Higher Education, because through this process we can identify strengths and weaknesses. After identifying these factors we can formulate strategies to enhance those strengths and eliminate weaknesses.
Empirical Study on the Student Satisfaction in
Higher Education: Importance-Satisfaction
Analysis
Q
Silva, Fátima and Fernandes, Paula Odete
The development of the Importance-Satisfaction Model was based on the Importance-Performance Analysis of Martilla and James [1]. The performance was replaced by satisfaction, since it considers that satisfaction has become the primary measure of service quality [2]-[5]. For that also Baker and Cromptom (2000) quoted by Tonge and Moore define performance as a measure of production that results in satisfaction [2]. According to these authors, the satisfaction provides information to analyze the performance of an institution based on results. By comparing the importance of satisfaction with certain attributes, it will allow us to identify areas in which to intervene and focus on service performance.
Analysis of satisfaction allows managers to check whether the institutions’ providing services and facilities meet the expectations of students and to validate if they are satisfied [6].
Fig. 1 identifies the attributes that, in the first place, are more important to the customer and have the greatest impact on satisfaction and, on the other hand, attributes that offer a low satisfaction and therefore need to be enhanced by the Institution managers for making decision. In the same figure we can identify all four quadrants that allow us to sketch four different strategies.
Fig. 1 Importance-Performance Matrix [Adapted from 4, pg. 115].
Quadrant A represents the attributes that are very important, but the level of satisfaction is evaluated below average. To increase the global satisfaction, the institution should focus on these attributes. The attributes in quadrant B are rated with high importance and satisfaction, and represent opportunities to gain or maintain competitive advantage. Attributes located in Quadrant C are considered less important and the level of satisfaction below average. It is usually not necessary to focus on these attributes. Finally, the attributes that belong to quadrant D measure high satisfaction of those attributes, though low importance. This implies that resources committed to these attributes would be better used in other; high performance attributes considered irrelevant indicate a possible exaggeration [4] and [6].
It must be noted that the definition of the abscissa of the Cartesian graph has been maintained over the years, some authors and by others modified, analyse the performance or satisfaction depending on the phenomenon under study.
Martilla and James [1], Tonge and Moore [2], recommend the use of the average range of the scale used for the axes cross. Martilla and James [1], and Lynch, Carver and Virgo [7] report that it should still be considered the median value of the data submitted to cross the axis, based on the trend of responses. Other authors (e.g. [3]-[4], [8]-[10]), recommend the use of average results to define the intersection of the axes of Cartesian graph, founded for each axis. In this study we used this methodology.
III. PRESENTATION AND DISCUSSION OF RESEARCH RESULTS
A.Sample Characterization
The survey took place in April and May, 2010, in the 2nd semester of the 2009/2010 academic year. A total of 695 valid questionnaires were received, which represents 34% of the total students’ population (2.031 students). The sample size shows a sampling error of 3,7%, assuming a 95% accuracy level.
Table 1 lists some of the characteristics of the students who answered the questionnaire. The sample consisted of 695 students, in which 46% are female and 54% male. The majority is between 20 and 25 years old and belonging to undergraduate and graduate programs, 57,8% from Engineering Sciences and 42,2% from Management Sciences.
TABLEI
GENERAL CHARACTERISTICS OF SAMPLE STUDENTS (N=695).
Characteristics No. %
Gender
Female 320 46
Male 375 54
Age
< 20 years old 152 21,9
20-25 years old 466 67,0
26-30 years old 49 7,1
> 30 years old 28 4,0
Study Areas
Engineering Sciences 402 57,8
Management Sciences 293 42,2
B.Methodology
So, to answer the purpose of this study in which we tried to identify the key factors that determine the quality of services provided by the School of Technology and Management (ESTiG) Polytechnic Institute of Bragança (IPB) from the point of view of students, it was held a Factor Analysis. One can say that Factor Analysis was used to study how these variables were related and also to try to reduce the number of variables in order to determine the dimensions students mostly
used when evaluating the quality of services provided by ESTiG. The undertaken analysis was an exploratory analysis, because no one knew in advance the number of factors or the variables that would appear in each of the factors.
In order to apply the Factor Analysis it was necessary to check whether there was correlation between the variables. If the correlations were small there would be a probability of not sharing common factors. The Kaiser-Meyer-Olkin (KMO) Measure and Bartlett’s Test were the statistical procedures used to verify the quality of the correlations between the variables, allowing continuing with the analysis.
According to Pestana and Gageiro [11], the KMO is the homogeneity measure of variances, which compares simple correlations to partial ones observed in the variables, thus allows assessing whether there is a strong correlation between the variables. On the other side, the Bartlett’s test of sphericity assays the hypothesis of the matrix correlation being the identity matrix with determinant equal to 1, showing also if there is, or not, a correlation between the variables.
Applying the analysis explained above, it was found that the group of variables analyzed has obtained a Cronbach's alpha coefficient of 0,954 showing that the reliability of the questionnaire is too good to evaluate the latent variable, the quality of services, once it was obtained a Cronbach's alpha value quite high.
The indicators of validity of Factor Analysis in related to this group of variables. According to figure found by Kaiser-Meyes-Olkin (KMO) Measure (0,946) it can be applied to Factorial Analysis [11]. In turn, Bartlett’s test of sphericity is significant, assuming 0,05 of significance level, showing that there is correlation between variables, assuming the application of Factorial Analysis proper to these data.
For further Factorial Analysis, assumptions of Anti-Image Matrix as well as commonalities analysis were undertaken, showing that they weren’t breached, thus presenting sample adequacy of each variable to be used Factorial Analysis. The anti-image matrix measures the sample adequacy of each variable for the usage of Factorial Analysis, where values lower than 0,5 presented on the diagonal indicate that this variable doesn’t fit the structure established by other variables, so it should be eliminated from Factorial Analysis [11]. The analysis of the commonalities corresponds to variance proportion of each observed item explained by the common factor that influences it, usually, more than 0,5 for each variable, according to Marôco [12]. Some variables in study showed a Measure of Sampling Adequacy (MSA) inferior to 0,5, accordingly this they could be removed. However, it was found that these variables have high commonality, so their removal couldn’t be taken into consideration.
C.Identification of Quality Factors
Based on the methodology presented in the previous point and after the verification of non infringement conditions to the application of Factorial Analysis, next task was to determine the number of factors needed in order to explain the correlation between variables, it was intended to present the factors identified by students as quality factors.
The criteria used to determine the number of factors necessary to describe data, was based on the assumption of choosing factors whose value was equal or superior to one [11]. According to this, were considered nine Factors, which explain approximately 70% of the total of variance (Table 2). This value is considered satisfactory when it comes to studies applied to scientific area in research.
To ease interpretation we carried out a rotation of factors according to the Varimax method with the purpose of elevate weights’ values so that each variable is associated with only one factor [13]. The results obtained are summarized in Table 2.
The following table presents the results of Factorial Analysis. Thus, factor 1 explains 35,79% of the structure of data, it is the most important factor in explaining data in this research work. Other factors have relatively less importance in summarizing the original variables. The second factor explains 7,09% of data variability, factor 3 corresponds to 5,88% of the explanation, the fourth factor explains 4,89%, factor 5 is responsible for about 4,30% of the explanation, the sixth factor explains 3,15%; factor 7 corresponds to 3,01%, the eighth factor explains 2,88%, and finally the factor 9 explains 2,70% of the total of the variance. As a reliability measure of the variables grouping, for each factor it was produced a Cronbach's alpha coefficient. It can be verified that the factors present reasonable levels of internal consistency (Factors 5, 6, 7 3 and 9), very good levels of consistency (Factors 1, 2 and 3) and the factor 4 and 8 are considered good, [14].
TABLEII
RELIABILITY OF THE NINE QUALITY FACTORS IDENTIFY BY STUDENTS, FOR
ESTIG
Quality Factors Cronbach’s
alpha
% of Total
Variance Eigenvalues
Factor 1: Academic Services 0,946 35,79 15,03
Factor 2: Qualified Education 0,916 7,09 2,98
Factor 3: Social Services 0,923 5,88 2,47
Factor 4: External Relations 0,801 4,89 2,05
Factor 5: Quality and Accessibility of
Facilities 0,715 4,30 1,80
Factor 6: Infrastructure to Support
Learning 0,797 3,15 1,32
Factor 7: Helpfulness and Functionality
of the Library Service 0,792 3,01 1,26
Factor 8: Availability of Social Support
to Students 0,814 2,88 1,21
Factor 9: Extra-Curricular Activities 0,744 2,70 1,13
D. Factors Importance-Satisfaction Model for Quality Improvement
Once identified the students, the quality factors of the services provided by the School of Technology and Management, it was aim to analyze the satisfaction of students as to what is offered by ESTiG and how it provides its service, applying to the Importance-Satisfaction Model.
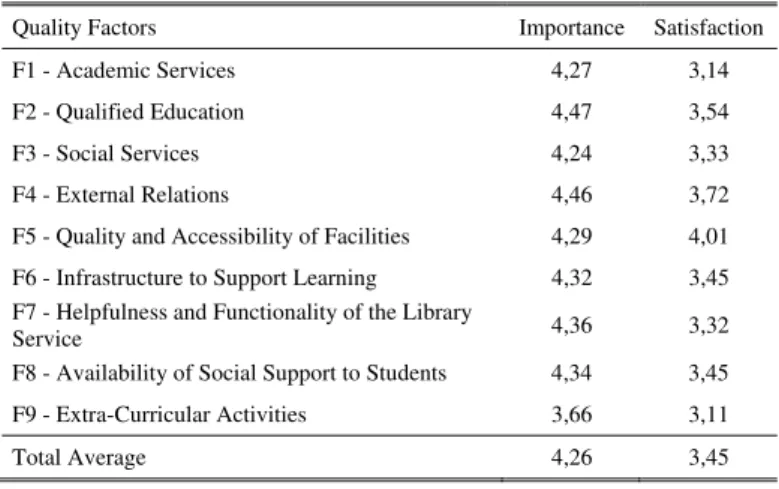
Table 3 presents the average values for each of the factors that measure the quality in terms of importance and satisfaction. Thus, students are very satisfied with Quality and
Accessibility of Facilities, Qualified Education (Teaching) and External Relations. Factors that are identified with lower satisfaction were F1 - Academic Services and F9 – Extra-Curricular Activities.
TABLEIII
AVERAGES OF THE FACTORS IDENTIFIED FOR THE ATTRIBUTES THAT MEASURE QUALITY
Quality Factors Importance Satisfaction
F1 - Academic Services 4,27 3,14
F2 - Qualified Education 4,47 3,54
F3 - Social Services 4,24 3,33
F4 - External Relations 4,46 3,72
F5 - Quality and Accessibility of Facilities 4,29 4,01
F6 - Infrastructure to Support Learning 4,32 3,45 F7 - Helpfulness and Functionality of the Library
Service 4,36 3,32
F8 - Availability of Social Support to Students 4,34 3,45
F9 - Extra-Curricular Activities 3,66 3,11
Total Average 4,26 3,45
The presented values obtained in the Importance-Satisfaction Matrix (Fig. 2) showed that the factors were divided into three quadrants, showing the perception of student satisfaction with the service provided by the School of Technology and Management of Bragança. To the intersection of the axes we use the aggregate averages for each dimension, importance and satisfaction.
The Quadrant integrates the factors of high importance and ranks low satisfaction average, which are Factors 1 and 7, Academic Services and Helpfulness and Functionality of the Library Service, respectively. Factors located in this quadrant are of the highest importance to students. Given the importance of these factors, ESTiG’s efforts should focus on these services in order to fulfill students’ expectations.
Factors, such as, Qualified Education, External Relations and Quality and Accessibility of Facilities Factors, Infrastructure to Support Learning and Availability of Social Support to Students showed high importance and satisfaction among students, they appear well located in quadrant B, however the importance is above average. These factors are extremely important to students, so ESTiG should keep up with the good work reflected on the variables encompassed by these factors.
Quadrant C represents low importance and satisfaction factors, namely Factor 9 - Extra-Curricular Activities and Factor 3 - Social Services. However, Factor 3 is located on the border of the quadrant, so it requires some attention, while Factor 9 is not that problematic because it is considered of low importance by students.
Fig. 2 The importance-Satisfaction Model relative value of the case study.
According to the previous figure and with the opinion of the authors of this research work, ESTiG’s board of directors and the Administration of IPB must set priorities and act on the attributes that comprise Factor 1 - Academic Services, since this factor had a variance of 35,79%, the most important factor in explaining the data in this investigation. Still, according to the same, this factor is really important to the institution's image, as being one of the first services that students prefer, when they first contact with the institution, it is essential that this service fulfills students’ expectations in order to maintain students, and attract newcomers to the institution. Factor 3 - Social Services and Factor 7 - Helpfulness and Functionality of the Library Service, also require intervention by the Administration of IPB and ESTiG.
E.Inferential Analysis
Finished the analysis, it can be said that the main objectives of this research work were met. However and in to complement the study an inferential analysis was carried out, in order to measure the level of correlation between the factors found to measure student satisfaction for the services provided by some control variables like sex, study areas, age, academic year, and their factors identified. To conclude this analysis it was also intended to check if there were differences between female and male students, or differences according to age, study areas or curricular academic years. To do so, and when possible, parametric tests were used. When there were no appliance conditions of these testes, non-parametric tests were applied, according to Pestana and Gageiro [11].
Thus, for the null hypotheses of students’ satisfaction average by gender to be equal, we tested the assumptions of normality and homogeneity. As the sample size is more than 30, it was assumed that the sample follows a normal distribution. To test the homogeneity of variances it was applied the Levene Test. As the assumption of homogeneity was not proven we used the nonparametric Mann-Whitney Test to show that for the Factors F3, F7, F8 and F9 the p-value is superior to 0,05, so it’s not possible to reject the null hypothesis, which allows us to state that there is sufficient
statistical evidence to claim that at significance level of 0,05, the satisfaction average of female and male students it’s not different. For factors F1, F2, F4, F5 and F6, the p-value of evidence is less than 0,05, so it rejects the null hypothesis, allowing stating that there is no sufficient statistical evidence at significance level of 0,05 to assume that the averages of these factors are equal (Table 4). Thus, it was found that students’ satisfaction average according to sex is identical in four factors and different in five factors, outlined previously.
TABLEIV
VALUES OF THE MEANS TEST FOR SATISFACTION ACCORDING SEX.
Factors F1 F2 F3 F4 F5 F6 F7 F8 F9
Mann-Whitney Test
0,019 0,000 0,177 0,000 0,001 0,000 0,899 0,406 0,297
Note: Significance level assumed 5%.
To compare students’ satisfaction by areas, courses were grouped according to the area of Engineering and Management Sciences. We defined the null hypothesis, in which the satisfaction average of engineering students is equal to the satisfaction average of Business Studies students. Since n>30 it was assumed that the sample follows a normal distribution and, analysing the Levene Test, it was found that the assumption of homogeneity was not violated. Verified these assumptions, we used the parametric t-Student test for two independent samples. The results presented in Table 5 show that all factors, except Factor 8, show a p-value superior to 0,05, there aren’t enough statistical evidences to reject the hypothesis zero, i. e. students’ satisfaction average in these two areas, Engineering and Management Sciences, are identical, except for Factor 8 - Availability of student Social Support, as this test shows a value inferior to 0,05.
TABLEV
VALUES OF THE MEANS TEST FOR SATISFACTION, BY AREA OF STUDY.
Factors F1 F2 F3 F4 F5 F6 F7 F8 F9
t-Student
Test 0,769 0,455 0,690 0,836 0,325 0,971 0,400 0,035 0,608
Note: Significance level assumed 5%.
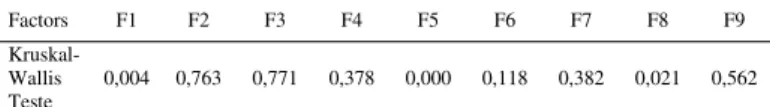
When we comparing students’ satisfaction average according to age, it was assumed the null hypothesis in which students’ satisfaction average is equal to all three age groups. Although it is implicit that the samples follow a normal distribution, n>30 but there was no such homogeneity. Thus, we applied the nonparametric Kruskal-Wallis Test (Table 6). It conferred that the average of satisfaction according to age in Factors F2, F3, F4, F6, F7 and F9 are substantially identical to a significance level of 0,05. However, there are no sufficient statistical evidences to say that, for a significance level of 0,05, the average satisfaction of all ages are identical in Factors F1, F5 and F8, there are differences of satisfaction in at least one age group according to those factors.
TABLEVI
VALUES OF PROOF TO THE SATISFACTION AVERAGES BY AGE GROUP.
Factors F1 F2 F3 F4 F5 F6 F7 F8 F9 Kruskal-
Wallis Teste
0,004 0,763 0,771 0,378 0,000 0,118 0,382 0,021 0,562
Note: Significance level assumed 5%.
Finally, analysing the Factors of satisfaction according to academic year it was found that there weren’t enough conditions to apply parametric tests because homogeneity results breached the uniformity of its application. Set the null hypothesis that students’ satisfaction average is the same in different academic years, we applied the nonparametric Kruskal-Wallis Test (Table 7), it was assumed that the satisfaction average according to academic year in Factors F2, F4, F5, F6, F7 and F8 are substantially identical to a significance level of 0,05. However, there are no sufficient statistical evidences to say that the satisfaction average in all academic years is identical in Factors F1, F3 and F9, there is at least one academic year that presents differences in satisfaction according those factors.
TABLEVII
VALUES OF THE MEANS TEST FOR SATISFACTION, FOR THE ACADEMIC YEAR.
Factors F1 F2 F3 F4 F5 F6 F7 F8 F9 Kruskal-
Wallis Test
0,000 0,527 0,009 0,232 0,292 0,112 0,221 0,052 0,003
Note: Significance level assumed 5%.
So, it was found that students’ satisfaction average according to sex, age and academic year is not identical in all Factors identified to measure quality. In analysing students’ satisfaction according to the areas it was shown that only in one of the factors the satisfaction average is significantly different. It is also concluded that there are groups of students to whom the satisfaction, resulting from perceived quality, is understood by different attributes.
IV. CONCLUSION
The identification of Quality Factors Influencing Students’ Satisfaction can help managers understand their relative importance and put forward improvement plans where resources are not focused enough. Based on literature review and empirical studies, this study identifies nine Quality Factors in Higher School of Technology and Management of Bragança: Academic Services; Qualified Education; Social Services; External Relations; Quality and Accessibility of Facilities; Infrastructure to Support Learning; Helpfulness and Functionality of the Library Service; Availability of Social Support to Students and Extra-Curricular Activities.
According to the results obtained by Importance-Satisfaction Model, we conclude that, in general, students are satisfied with the service that ESTiG offers them, as most factors are located in Quadrant B (high importance and high satisfaction), except factors related to Academic Services, Social Services and Helpfulness and Functionality of the Library Service, in terms of attendance.
It was found that students’ satisfaction average according to sex, age and academic year is not identical in all factors identified to measure quality. In the analysis of student satisfaction by area it was found that in only one of the factors the satisfaction average is significantly different. It is also concluded that there are groups of students to whom the satisfaction, resulting from the perceived quality, is understood through different attributes.
The model developed could be accurately considered as a useful tool for selecting the most efficient improvement items to reach students’ satisfaction. The resources of organizations can then be boosted to maximize efficiency. Higher Education Institutions that apply quality factors can achieve a competitive advantage due to the fact that the managers would be in a better position to provide the greatest satisfaction by improving service quality and marketing strategies for students.
This study intends to present a complete assessment model that helps Directors of ESTiG-IPB to identify items needing improvement, and promotes efficiency and timelines of service processes, considering cost and time.
ACKNOWLEDGMENT
This work has been supported by the School of Technology and Management of the Polytechnic Institute of Bragança (Portugal). The authors would like to thank the students who answered the questionnaires and the teachers at ESTiG for allowing time in their classes for carrying out the investigation. We would also like to thank ESTiG’s Principal for authorizing the use of the questionnaires in the Institution.
REFERENCES
[1] J. Martilla, and J. James, “Importance-Performance Analysis”, Journal of Marketing, vol. 41, no 1, pp. 77-79, 1977.
[2] J. Tonge, and S. Moore, “Importance-satisfaction analysis for marine-park hinterlands: A Western Australian case study”, Tourism Management, vol. 28, no 3, pp.768-776, 2007.
[3] A. Aktas, A. Aksu, and B. Çizel, “Destination choice: An Important-Satisfaction Analysis”, Quality & Quality, vol 41, no 2, pp. 265-273, 2007.
[4] K. Matzler, E. Sauerwein, and K. Heischmidt, “Importance-Performance analysis Revisited: the role of the factor structure of customer satisfaction”, The Service Industries Journal, vol. 23, no 2, pp. 112-129, 2010.
[5] F. Silva, and P. O. Fernandes, “Using Importance-Performance Analysis in Evaluating of Higher Education: A Case Study.” ICEMT 2010 International Conference on Education and Management Technology. IEEE. ISBN: 978-1-4244-8617-5, pp.121-123, 2010.
[6] K. Elliott, and M. Healy, “Key factors influencing student satisfaction related to recruitment and retention.” Journal of Marketing for Higher Education, vol. 10, no 4, pp.1-11, 2001.
[7] J. Lynch, R. Carver, and J. Virgo, “Quadrant Analysis as a strategic planning technique in curriculum development and program marketing”,
Journal of Marketing for Higher Education, vol. 7, no 2, pp. 17-32, 1996.
[8] H. Zhang, and I. Chow, “Application of importance-performance model in tour guides' performance: evidence from mainland Chinese outbound visitors in Hong Kong”, Tourism Management, vol. 25, no 1, pp. 81-91, 2004.
[9] A. Rial, J. Rial, J. Varela, and E. Real, “An application of importance-performance analysis (IPA) to the management of sport centres”,
Managing Leisure, vol 13, no (3/4), pp.179-188, 2008.
[10] G. Lee, and C. Lee, “Cross-cultural comparison of the image of Guan perceived by Korean and Japanese leisure travelers:
Importance-Performance analysis”, Tourism Management, vol. 30, no 6, pp.922-931, 2009.
[11] M. Pestana, and J. Gageiro, “Análise de Dados para Ciências Sociais. A Complementaridade do SPSS”, Lisboa: Edições Sílabo, Lda, 2008. [12] J. Marôco, “Análise Estatística: Com utilização do SPSS”, Lisboa:
Edições Sílabo, 2007.
[13] E. Reis, “Estatística Multivariada Aplicada”, Lisboa: Edições Sílabo, 2001.
[14] M. Hill, and A. Hill, “Investigação por Questionário”, Lisboa: Edições Sílabo, 2002.
![Fig. 1 Importance-Performance Matrix [Adapted from 4, pg. 115].](https://thumb-eu.123doks.com/thumbv2/123dok_br/16862646.753748/2.892.486.792.678.944/fig-importance-performance-matrix-adapted-pg.webp)