ISSN 1982-4327 (online version)
Article
1
2
1 Correspondence address:
Maria Isabel de Campos. Universidade São Francisco, Campus Swift. Rua Waldemar César da Silveira, 105. Jd. Cura D’Ars. CEP 13045-510. Campi-nas-SP, Brazil. E-mail: [email protected]
This study addresses a recurrent issue in studies
con-ducted in the ield of Work and Organizational Psychology (WOP), due to its relevance for the management of human resources within organizations, which is Quality of Work
Life (QWL). This subject is addressed from the perspective
of the effects on QWL, which is promoted when workers
are satisied with the company’s organizational values (OV).
This satisfaction depends on the extent to which individuals
and organization are compatible (Person-organizational it - POF) in terms of OV perceived and desired by workers in the workplace. Tamayo and Borges (2006) deine OV as hierar -chically organized principles or beliefs concerning desirable organizational behaviors or goals that guide the organization’s life and meet individual, collective or mixed interests.
Interest in studying QWL on the part of organizations and researchers started in the 1950s (Walton, 1980). The main motivation of the studies performed since that time is an
un-derstanding that improving workers’ QWL is a prerequisite to
Effects of Organizational Values on Quality of Work Life
Abstract: Quality of work life (QWL) is a topic studied globally due to its relevance for workers’ health and organizational results. This
study investigated the effects of person-organization it (POF) with regard to workers’ perceived and desired organizational values (OV) on QWL. The sample consisted of 213 Brazilians working in companies of different sizes and from different sectors. The quadratic poly
-nomial regression model with surface analysis charts was used. The hypothesis that QWL is affected by satisfaction with OV was con
-irmed. The surface analysis charts revealed that some of the relationships between variables are non-linear. The conclusion is that these indings can help organizations to relect on declared values and those actually put into practice in order to develop strategies intended to
promote greater congruence from the perspective of employees, positively affecting QWL.
Keywords: statistical regression, organizational behavior, working conditions
Efeitos dos Valores Organizacionais Sobre a Qualidade de Vida no Trabalho
Resumo: A qualidade de vida no trabalho (QVT) é estudada globalmente por sua importância para a saúde do trabalhador e para os re
-sultados organizacionais. Este estudo investiga os efeitos da compatibilidade pessoa organização (POF) no que diz respeito aos valores organizacionais (VO) percebidos e desejados pelos trabalhadores sobre a QVT. Participaram 213 trabalhadores brasileiros de empresas de diferentes portes e setores. Utilizou-se o modelo de regressão polinomial quadrática com análise de gráicos de superfície. Comprovou-se a hipótese de que a QVT é impactada pela satisfação com os VO. A análise de gráicos de superfície permitiu compreender que alguns dos relacionamentos entre as variáveis são curvilíneos. Conclui-se que os achados podem contribuir para que as organizações relitam sobre seus valores declarados e praticados, desenvolvendo estratégias que possam promover maior congruência na visão de seus funcionários,
impactando positivamente na QVT.
Palavras-chave: regressão estatística, comportamento organizacional, condições de trabalho
Efectos de los valores organizacionales sobre la calidad de vida laboral
Resumen: Se estudia la calidad de la vida laboral (CVL) por su importancia para la salud de los trabajadores y para los resultados
orga-nizacionales. Fueran investigados los efectos de la compatibilidad persona organización con respecto a los valores organizacionales (VO)
percibidos y deseados por los trabajadores en la CVL. La muestra fue de 213 trabajadores brasileños de empresas de diferentes tamaños y
sectores. Se utilizó el modelo de regresión polinómica de segundo grado con el análisis de los gráicos de supericie. Se comprobó la hipó
-tesis que CVL se ve afectada por la satisfacción con los VO. Se entendió que algunas de las relaciones entre las variables son curvilíneas. Los hallazgos pueden ayudar a las organizaciones a relexionar sobre sus valores declarados y practicados, y a desarrollar estrategias para
promover una mayor coherencia en la visión de sus empleados, impactando positivamente en CVL.
Palabras clave: regresión estadística, conducta organizacional, condiciones de trabajo
Fabián Javier Marín Rueda
Universidade São Francisco, Campinas-SP, Brazil Maria Isabel de Campos1
improve organizational productivity (Mejbel, Almsair, Siron,
& Alnaser, 2013).
This view is easily veriied in Walton (1973), for whom QWL can be deined as a set of initiatives, the objective of which is to improve human experience in the workplace while
increasing the organization’s competitiveness by redesigning its nature, obtaining productivity gains. The theoretical model established by this author presents QWL as a multidimensio-nal concept that comprises fair and appropriate
compensa-tion, working conditions, the opportunity to use and develop workers’ capabilities, the opportunity for continuous growth and safety, social integration at work, constitutionalism, work itself and life as a whole, and the relevance of life at work.
According to Pedroso and Pilatti (2010), among the many theoretical models developed for QWL, the model by Walton
(1973) remains one of the most frequently used to support re
-search in the ield. Being considered the most comprehensive,
it is the most used model in Brazil.
Studies involving QWL measures have been conducted in Brazil in an attempt to understand how its nomological
ne-twork is formed and how to use measures, and the insights
these promote, in organizational environments (Mendonça, Hora, Costa, & Monteiro, 2014; Nespeca & Cyrillo, 2011;
Silva & Ferreira, 2013). Studies seeking to develop and im
-prove measuring instruments include Rueda, Ottati, Pinto,
Lima and Bueno (2013). The authors report on the develop-ment of a scale to assess QWL, the Escala-QVT [QWL-Scale]
and the initial indings regarding its validity.
The QWL-Scale has been used in various studies, in-cluding the research by Rueda, Serenini and Meireles (2014), which assessed the relationships between QWL and trust in the organization, showing a strong association between these constructs. This instrument was also used in the study con-ducted by Campos and Rueda (2016) to investigate the
rela-tionship between moral harassment at work and QWL. The
conclusion was that the relationship between both is of low magnitude but presents an effect suggesting that interventions
intended to decrease moral harassment at work can also im -prove the QWL among employees.
QWL has been studied worldwide and research has been conducted in Saudi Arabia, where the relationship between QWL and turnover intention was addressed in health
servi-ces (Almalki, FitzGerald, & Clark, 2012); in Iran, where the
relationship among leadership behavior, QWL and
produc-tivity was veriied (Barzegar, Afzal, Tabibi, Delgoshaei, & Koochakyazdi, 2012); in Turkey, where QWL was analyzed as a predictor of alienation at work among the teachers of a
primary school (Erdem, 2014); and in Nigeria, where organi-zational climate, leadership style and emotional intelligence were investigated as predictors of QWL (Adeyemo, Terry, & Lambert, 2015).
Among the various studies conducted in Europe, there
is the survey conducted by Šverko and Galić (2014). It ad
-dressed QWL as perceived by 36,472 workers from Croatia,
from 17 countries in Western Europe (EU17) and another ten countries from Central and Eastern Europe (EU10), which
were previously socialist countries. The indings indicate that
QWL in the EU17 is considered superior to that observed in
the other two groups with regard to economic security,
mea-ning of work, autonomy and participation in decision-making.
Studies were also conducted in Canada (Nowrouzi et
al., 2015), Mexico (Argüelles Ma, Quijano García, Fajardo, Magaña Medina, & Sahuí Maldonado, 2014), Australia (Ou -ppara & Sy, 2012) and Colombia (Contreras, Espinosa,
Her-nández, & Acosta, 2013). All these papers published globally
reinforce the understanding that QWL remains a topic of great interest both in academia and organizations and space remains to contribute to a better understanding.
No studies were found in Brazil linking QWL and OV (within the POF context) after a search was conducted inclu
-ding papers published up to February 2016, using the equiva
-lent of “organizational values” and “quality of life at work” in Portuguese in the IndexPsi database and Google Scholar. The studies found, however, addressed the effects of POF in the context of OV on other work-related constructs. Sousa and
Porto (2015) investigated the impact of this congruence on
happiness at work, concluding that OV congruence affects ha
-ppiness at work.
Oliveira and Souza (2014), in turn, veriied the predic -tive power of personal values (PV) and organizational values
regarding workers’ trust in the organization. PV explained a smaller percentage of variance when compared to OV, indica
-ting that workers’ trust in the organization seems to be based
on an evaluation of the organizational system. According to
the authors, OV could be perceived as more relevant than PV
when explaining trust in the organization, which according to Rueda et al. (2014) is strongly associated with QWL.
In order to build on previous studies, this study’s
ob-jective was to verify the effects of OV on QWL. More spe
-ciically, effects will be investigated through the satisfaction of workers with OV. This satisfaction is usually assessed through real OV and desired OV (Tamayo & Borges, 2006;
Tamayo, Mendes, & Paz, 2000). The hypothesis is that the
existence of POF, that is, compatibility between individual and organization with regard to perceived and desired OV,
positively affects QWL.
Method
Participants
A total of 213 people who belonged to the authors’
con-tact network, residing in various Brazilian states, were recrui
-ted through email, Facebook and LinkedIn; 174 (81.7%) of
which were from the state of São Paulo. People were aged 33.40 years old (SD = 10.99) on average and 115 (54%) were men. In terms of education, 203 (95.3%) reported holding an
undergraduate, college or graduate degree.
With regard to the organizations where the participants
worked, 57 people (26.8%) reported companies with up to 30 employees, 88 (41.3%) worked in companies from 31 to 100 employees, 44 (20.7%) reported companies from 101 to 300 employees, 3 (1.4%) reported from 301 to 500 employe
31 (14.6%) were managers, 38 (17.8%) were supervisors or coordinators, and 126 (59.2%) reported other functions within the company; time working in the company ranged from 0 to
31 years; 3.49 years (SD = 5.08) on average.
Instruments
Inventário de Valores Organizacionais – IVO [Organi
-zational Values Inventory – OVI] (Tamayo et al., 2000). This
instrument is composed of six bipolar factors. Polarities are distributed along three axes arranged as follows: autonomy
(4 items, α = 0.83) versus conservatism (5 items, α = 0.77); hierarchy (10 items, α = 0.87) versus egalitarianism (7 items,
α = 0.85); and mastery (8 items, α = 0.84) versus harmony (2
items, α = 0.85).
The OVI measures real values, those employees perceive
that are practiced by the organization, and desired values, that is, those values that employees believe should be practiced
by the organization. Score is achieved through a Likert-style
scale ranging from 0=not important at all to 6=very important, while 36 items are answered twice according to “how import-ant each item is in the current context of your organization” (real value – RV) and “how important each item should be in your organization” (desired value – DV).
Therefore, for both real and desired values, the au-tonomy factor measures the organization’s willingness to perceive employees as autonomous individuals, capable to follow their own interests and establish personal goals that are compatible with the organization’s goals and standards. At the opposite end, the conservatism factor represents the preservation of customs and traditions and power structures,
keeping the status quo and restricting behaviors that disturb the company’s norms and traditions.
The hierarchy factor assesses the extent to which the
company values authority, social power, inluence, surveillan -ce and supervision, as opposed to egalitarianism, which as-sesses the extent to which the company values the well being of people and of the organization in general, the existence of few hierarchical levels, participatory management,
justi-ce and equality. Finally, in the third axis, the mastery factor
assesses the company’s assertiveness through the mastery of
material resources, of the market, technology and knowledge in its ield while, at the opposite end, the harmony factor as -sesses how harmoniously the company positions itself in its environment, respecting nature and competitors.
Escala de Qualidade de Vida no Trabalho - Escala-QVT [Quality of Work Life – QWL–Scale] – (Rueda, 2013). It is
composed of 35 items, divided into four factors measured on
a Likert scale ranging from 1=strongly disagree to 5=strongly
agree.
Factor 1, QWL related to integration, respect and
auto-nomy (IRA, α = 0.90), is composed of 15 items. It refers to
the promotion of respect for individual differences and for the
employees’ rights, collaboration and respect among coworke -rs, and the promotion of autonomy through clear rules and standards; Factor 2, QWL related to fair and appropriate
com-pensation (FAC, α = 0.89), is composed of six items. It refers to QWL linked to one’s satisfaction with salary and the com
-pany’s wage policies, perceiving it to be fair; factor 3, QWL
related to incentive and support (IS, α = 0.82) is composed
of eight items. It refers to incentives and support provided in terms of training programs, improving courses, and incentive to perform cultural activities; factor 4, QWL related to the
possibility of leisure and social interaction (PLSI, α = 0.84) is composed of six items and refers to the quality of social
life outside the organization that is promoted on the basis of
the own organization’s characteristics, such as working hours, working days and workload. Total scores result from adding
up the scores assigned to each of the factor’s items, which can range from 0 to 75 for factor 1, from 0 to 30 for factors 2 and 4, and from 0 to 40 for factor 3.
Procedure
Data collection. Data were collected through a proprie-tary tool available on the Internet. This tool is based on Java language and used PostgreeSQL, a free database management system. A server with secure access and database in an isola-ted system was used.
In its irst screen, the tool presented the free and infor -med consent form. After respondents had consented and
con-irmed they were aware they were free to withdraw from the survey at any time, the questionnaires were presented. OVI was irst presented, followed by the QWL-Scale. Response
time was approximately 25 minutes.
Data analysis. Data were analyzed using SPSS, version
20. The precision indexes of the scales’ factors were veriied
using Cronbach’s alpha.
Finally, quadratic regression was performed as recommen
-ded by Edwards and Parry (1993) and later detailed by Shanock, Baran, Gentry, Pattison and Heggestad (2010). Quality of Work
Life was the dependent variable and real and desired values were the independent variables. A total of 24 regressions were perfor-med using the formula: Z = b0 + b1X + b2Y + b3X2 + b
4XY + b5Y 2
+ e, where Z represents the scores for each of the factors in the
QWL-Scale, X represents the scores of each of the OVI factors
in its component of real values, Y represents the scores of each
of the OVI factors in its component of desired values, b0 to b5
represent the equation’s constants, and “e” represents error. With the results, we also calculated the coeficient values
a1 and a2, which determine the slope and curvature of the line of total congruence (RV = DV); and a3 and a4, which determine the slope and curvature of the line of total incongruence (RV =
-DV). These are the coeficients that permit the analysis of the
surface test and its interpretation (Edwards & Parry, 1993;
Sha-nock et al., 2010). This method was chosen because, since the 1990’s, researchers have discovered that the use of quadratic
regression can considerably increase the explained variance in
POF studies (Saraç, Eil, & Eryilmaz, 2014).
Ethical Considerations
As shown in Table 1, all the regressions present
statisti-cal signiicance, four of which refer to the factor possibility of
leisure and social interaction of the QWL-Scale at p < 0.005 and the remaining at p < 0.001. The OVI’s egalitarianism fac -tor explained most variance with regard to all QWL fac-tors, presenting ∆R2 = 0.43 of the effect on the IS factor. Factor
PLSI, in turn, indicated the smallest impact regarding OV.
Yet, the OVI’s egalitarianism factor presented ∆R2 = 0.19 for
this aspect of QWL.
In the quadratic regression, the coeficients b1 to b5 and
their respective standard deviations made it possible to obtain the slope and curvature of surfaces along the lines of con-gruence and discrepancy (perfect incongruity). These results, as well as those related to the intercept (b0), are presented in Table 1
Effects of Organizational Values on Quality of Work Life
Quadratic regression (real and desired values*)
QWL-Scale OVI R R2 R2 adjusted SD F P
Integration, respect and autonomy (IRA)
Autonomy 0.57 0.33 0.31 8.22 20.19 0.000
Conservatism 0.55 0.30 0.29 8.37 18.06 0.000
Hierarchy 0.45 0.20 0.18 8.96 10.48 0.000
Egalitarianism 0.58 0.34 0.32 8.17 20.99 0.000
Mastery 0.47 0.22 0.20 8.86 11.60 0.000
Harmony 0.41 0.17 0.15 9.16 8.21 0.000
Fair and appropriate compensation (FAC)
Autonomy 0.48 0.23 0.21 6.02 12.15 0.000
Conservatism 0.36 0.13 0.11 6.39 6.15 0.000
Hierarchy 0.32 0.10 0.08 6.48 4.76 0.000
Egalitarianism 0.49 0.24 0.22 5.98 12.82 0.000
Mastery 0.37 0.14 0.12 6.35 6.64 0.000
Harmony 0.35 0.12 0.10 6.42 5.59 0.000
Incentive and support (IS)
Autonomy 0.58 0.34 0.32 5.79 21.17 0.000
Conservatism 0.51 0.26 0.24 6.14 14.18 0.000
Hierarchy 0.49 0.24 0.23 6.19 13.28 0.000
Egalitarianism 0.67 0.44 0.43 5.31 32.97 0.000
Mastery 0.50 0.25 0.23 6.17 13.68 0.000
Harmony 0.48 0.23 0.21 6.25 12.24 0.000
Possibilities of leisure and social interaction
(PLSI)
Autonomy 0.41 0.17 0.15 5.15 8.42 0.000
Conservatism 0.32 0.10 0.08 5.37 4.55 0.001
Hierarchy 0.31 0.09 0.07 5.38 4.27 0.001
Egalitarianism 0.46 0.21 0.19 5.02 11.21 0.000
Mastery 0.30 0.09 0.07 5.39 4.16 0.001
Harmony 0.30 0.09 0.07 5.40 4.00 0.002
*Note: According to the regression equation Z = b0 + b1X + b2Y + b3X2 + b
4XY + b5Y
2 + e, where Z represents the scores of each of the fac-tors in the QLW-Scale, X represents the scores of each of the OVI facfac-tors in its component of real values, Y represents the scores of the OVI
factors in its component of desired factors, b0 till b5 represent the constants of the equation and “e” represents error.
Results
The following precision indexes were obtained for the
OVI (in the parentheses appear real values irst and then desi -red values): autonomy (0.85; 0.67), conservatism (0.76; 0.66), hierarchy (0.88; 0.91), egalitarianism (0.88; 0.80), mastery (0.82; 0.75), and harmony (0.51; 0.77). The following were found for the QWL-Scale: 0.90 (IRA), 0.94 (FAC), 0.78 (IS)
and 0.88 (PLSI). The α = 0.51 found for the OVI’s harmony factor is considered unacceptable (Maroco & Garcia-Mar
-ques, 2006). Note that this factor is composed of two items
only, which together with the sample size may have led to this result. Even though no satisfactory conclusions can be achie-ved with regard to this factor, its results are also presented in the tables.
The calculation of the means for the OVI factors, in
turn, indicated that all the means concerning desired values were greater than the means concerning real values with
sta-tistical signiicance at p < 0.001, obtained by Student’s t-test. Quadratic regressions were performed to assess the impact of
satisfaction with OV on QWL, considering a combination of
Information provided in Table 2 shows that all the values
found for the intercepts of the equations presented statistical signiicance; the same is true only for some of the coeficients
b1 to b5. The slope and curvature coeficients of the lines of congruency and discrepancy are presented in Table 3,
toge-ther with the covariance among the equation coeficients. Co
-variances are important in this type of analysis because, like coeficients b1 to b5 and their respective standard deviations,
covariances are used to verify the statistical signiicance of coeficients a1 to a4 (Shanock et al., 2010).
Table 2
Coeficients and Standard Deviations in the Quadratic Polynomial Equation (Regression)
Intercept X (Real) Y (Desired) X2 XY Y2
QWL-Scale OVI b0 SD b1 SD b2 SD b3 SD b4 SD b5 SD
IRA
F1 69.56* 5.65 2.28 2.77 -8.59 5.69 -0.71 0.40 1.32 1.17 1.53 1.37
F2 69.90* 6.21 3.52 3.16 -11.09 6.24 -0.71 0.46 1.11 1.33 2.14 1.53
F3 59.85* 1.47 -2.77 2.19 0.31 2.03 0.47a 0.56 2.70 0.95 -0.76 0.72
F4 66.81* 3.06 4.11a 1.91 -6.99a 3.45 -0.19 0.42 0.47 0.80 1.52 0.94
F5 63.97* 2.30 -0.48 2.29 -3.43 3.12 -2.52* 0.69 3.55a 1.18 0.36 0.99
F6 61.52* 1.33 0.10 1.23 0.50 1.35 -0.60 0.33 1.57a 0.58 -0.53 0.45
FAC
F1 13.00a 4.13 3.71 2.03 5.08 4.16 -0.19 0.29 -0.41 0.86 -1.35 1.01
F2 10.29b 4.74 -1.73 2.41 6.86 4.76 -0.73b 0.35 1.88 1.02 -1.64 1.17
F3 17.35* 1.06 -0.21 1.59 0.06 1.47 0.31 0.40 0.81 0.69 -0.24 0.52
F4 18.92* 2.24 3.07a 1.40 -1.40 2.53 0.24 0.30 -0.13 0.59 0.25 0.69
F5 15.19* 1.65 2.25 1.64 2.77 2.24 -0.20 0.49 0.12 0.85 -0.85 0.71
F6 18.71* 0.93 2.50a 0.87 0.29 0.95 -0.04 0.24 -0.40 0.41 -0.29 0.32
IS
F1 24.83* 3.97 5.08b 1.95 -3.06 4.00 -0.17 0.28 -0.61 0.83 0.61 0.97
F2 15.64a 4.56 1.87 2.32 3.90 4.58 -0.63 0.34 0.86 0.98 -0.75 1.13
F3 21.34* 1.01 0.71 1.52 0.80 1.40 -0.08 0.38 1.23 0.66 -0.59 0.50
F4 29.07* 1.99 5.06* 1.24 -7.90a 2.24 -0.40 0.27 -0.36 0.52 2.04a 0.61
F5 19.19* 1.60 1.10 1.59 3.38 2.17 -0.12 0.48 1.21 0.82 -1.25 0.69
F6 23.24* 0.91 2.17b 0.84 0.66 0.92 0.02 0.23 0.21 0.40 -0.57 0.31
PLSI
F1 23.57* 3.54 -0.31 1.74 -1.57 3.57 -0.14 0.25 0.95 0.74 0.30 0.86
F2 20.72* 3.99 1.07 2.03 0.14 4.00 -0.44 0.30 0.40 0.85 0.12 0.98
F3 20.73* 0.88 -1.09 1.32 1.22 1.22 -0.05 0.33 1.01 0.57 -0.27 0.43
F4 22.69* 1.88 1.63 1.18 -0.79 2.12 0.11 0.26 0.23 0.49 0.21 0.58
F5 22.07* 1.40 0.18 1.39 -0.82 1.90 -0.55 0.42 0.81 0.72 0.40 0.60
F6 21.21* 0.78 -0.71 0.73 1.83b 0.80 -0.38 0.20 0.78b 0.34 -0.37 0.27
Note. IRA = Integration, respect and autonomy; FAC = Fair and appropriate compensation; IS = Incentive and support; PLSI = Possibilities of leisure and social interaction; F1 = Autonomy; F2 = Conservatism; F3 = Hierarchy; F4 = Egalitarianism; F5 = Mastery; F6 = Harmony.
It can be noted in Table 3 that, only for PLSI, as a
de-pendent variable, the slope and curvature coeficients did not present any information with statistical signiicance, since the
only exception in this case was the harmony factor, as an
in-dependent variable. Given the Cronbach’s alpha found for the
RV calculation of this factor, the result found cannot be safely
interpreted. Additionally, the statistically signiicant results
fora2 and a4 indicate the existence of non-linear relationships
between: OVI’s hierarchic and egalitarianism factors with QWL’s IRA; OVI’s autonomy and conservatism factors with QWL’s FAC; OVI’s hierarchy and egalitarianism factors with
QWL’s IS.
The results presented so far made it possible to plot sur-face analysis charts. To understand these analyses, two of the six charts that present non-linear relationships are presented here. They were chosen considering the level of statistical Table 3
Covariances Between Regression Coeficients and Coeficients of Slope and Curvature of Surface Analysis Charts
Covariance Slope and curvature
QWL-Scale OVI b1b2 b3b4 b3b5 b4b5 a1 a2 a3 a4
IRA
F1 -9.76 -0.24 0.08 -0.95 -6.30 2.14 10.87 -0.50
F2 -4.85 -0.23 0.03 -0.72 -7.57 2.54 14.61 0.32
F3 -2.80 -0.15 -0.06 -0.40 -2.47 2.41a -3.08 -2.98
F4 -4.11 -0.13 -0.07 -0.38 -2.89 1.80b 11.10b 0.86
F5 -4.81 -0.44 0.05 -0.73 -3.90 1.28 2.95 -5.82
F6 -0.99 -0.09 0.01 -0.14 0.59 0.44 -0.40 -2.69
FAC
F1 -5.23 -0.13 0.04 -0.51 8.80a -1.95b -1.37 -1.12
F2 -2.82 -0.13 0.02 -0.42 5.14 -0.48 -8.59 -4.25b
F3 -1.47 -0.08 -0.03 -0.21 -0.16 0.88 -0.27 -0.74
F4 -2.20 -0.07 -0.04 -0.20 1.68 0.37 4.47 0.63
F5 -2.47 -0.23 0.02 -0.38 5.01a -0.93 -0.52 -1.16
F6 -0.49 -0.04 0.01 -0.07 2.79a -0.72b 2.21 0.07
IS
F1 -4.84 -0.12 0.04 -0.47 2.02 -0.17 8.14 1.06
F2 -2.61 -0.12 0.02 -0.39 5.77 -0.52 -2.03 -2.24
F3 -1.34 -0.07 -0.03 -0.19 1.52 0.55 -0.09 -1.90b
F4 -1.74 -0.05 -0.03 -0.16 -2.84 1.28a 12.96a 2.00
F5 -2.33 -0.22 0.02 -0.36 4.47a -0.16 -2.28 -2.57
F6 -0.46 -0.04 0.01 -0.06 2.83a -0.35 1.51 -0.76
PLSI
F1 -3.84 -0.10 0.03 -0.37 -1.88 1.10 1.26 -0.79
F2 -1.99 -0.10 0.01 -0.29 1.20 0.09 0.93 -0.72
F3 -1.01 -0.06 -0.02 -0.15 0.13 0.68 -2.32 -1.33
F4 -1.55 -0.05 -0.03 -0.14 0.84 0.54 2.41 0.08
F5 -1.78 -0.16 0.02 -0.27 -0.64 0.66 1.00 -0.95
F6 -0.34 -0.03 0.01 -0.05 1.12 0.03 -2.53 -1.52b
Note. IRA = Integration, respect and autonomy; FAC = Fair and appropriate compensation; IS = Incentive and support; PLSI = Possibilities of leisure and social interaction; F1 = Autonomy; F2 = Conservatism; F3 = Hierarchy; F4 = Egalitarianism; F5 = Mastery; F6 = Harmony.
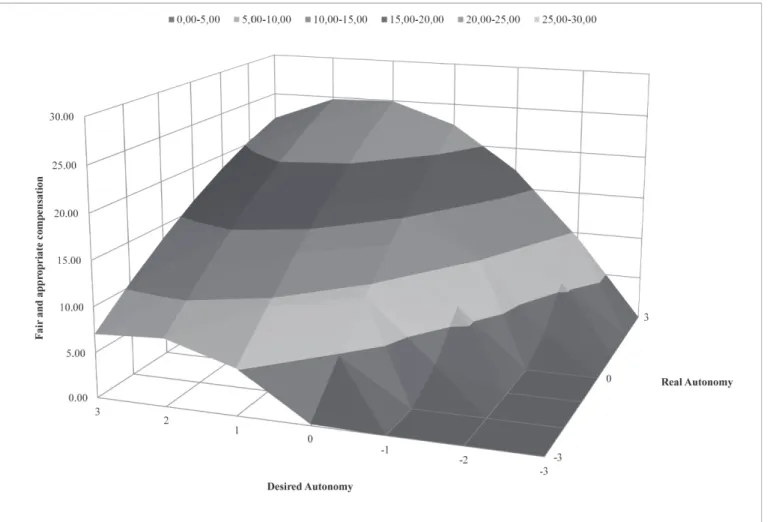
signii cance obtained for the coefi cients and number of co-efi cients with statistical signii cance. Hence, Figure 1
pre-sents the surface analysis chart of the effect of satisfaction with the egalitarianism value in the QWL related to incentive and support. Figure 2 presents the effect of satisfaction with the autonomy value in QWL related to fair and appropriate compensation. All the charts are available to whoever may be interested by contacting the corresponding author.
The two i gures show the term ‘centralized’ beside axes
X and Y. It indicates that the predictor variables real values and desired values had their values centralized, as
recom-mended in the literature, to perform the quadratic regression
analysis intended to aid in the interpretation and to reduce
potential for multicollinearity (Shanock et al., 2010).
Information provided in Table 3 and the chart in Fi-gure 1 suggest that the slope in the surface along the line of congruence (RV = DV) is negative and the surface curvature is concave (a1 = -2.84, not signii cant; a2 = 1.28, p < 0.05). Therefore, QWL related to IS, along the line of congruence, increases more sharply when perceived egalitarianism (RV) and desired egalitarianism (DV) obtain low scores, and less sharply in the contrary direction, in which congruence ob-tains high scores. Some examples of these scores in this line that help to understand the curve are: for RV = DV = -3, IS = 49.10; for RV = DV = 0, IS = 29.07; for RV = DV = 3, IS = 32.08.
Figure 1. Effect of Satisfaction With the Egalitarianism Value on QWL Related to Incentive and Support.
In turn, the slope of the surface along the line of per-fect incongruence (RV = - DV) is positive and the surface is linear (a3 = 12.96, p < 0.001; a4 = 2.00, not signii cant). The-refore, QWL related to IS is lower when scores concerning perceived and desired egalitarianism (RV and DV) are lower, and increases when, along this line, RV and DV scores are higher. Some examples of these scores in this line that help to understand the curve are: for (RV, DV) = (3, -3), IS = 85.94; for (RV, DV) = (0,0), IS = 29.07; for (RV, DV) = (-3,3), IS = 8.16. Finally, the chart also shows that, in other situations of incongruence, the QWL related to IS is greater when real
ega-litarianism is greater than the desired (RV > DV) and is lower when the opposite occurs, that is, when desired egalitarianism is greater than the real (DV > RV).
Concerning the effect of satisfaction with autonomy on QWL related to FAC, the chart in Figure 2 and information provided in Table 3 indicate that the slope of the surface along the line of congruence is positive and the surface is convex (a1 = 8.80, p < 0.05; a2 = -1.95, p < 0.05). For the surface along the
line of perfect incongruence, data were not signii cant (n.s.)
not interpreted safely. These results allow us understand that QWL related to FAC increases along the line of congruence to the extent in which scores of real and desired autonomy
increase. On the opposite, the QWL related to FAC decreases
more sharply than in relation to the increase, when the real and desired autonomy scores decrease.
Figure 2. Effect of Satisfaction With Autonomy Value on QWL Related to Fair and Appropriate Compensation.
With regard to the other four non-linear relationships, they are related to the effect of: hierarchy on IRA, in which we could observe a concave surface on the line of congruen-ce (a1 = -2.47, n.s.; a2 = 2.41, p < 0.05), with interpretation similar to that of Figure 1; egalitarianism on IRA, also with a concave surface on the line of congruence (a1 = -2.89, n.s.; a2 = 1.80, p < 0.05) and similar interpretation; of conservatism on FAC with convex surface on the line of incongruence (a3 = -8.59, n.s.; a4 = -4.25, p < 0.05); and hierarchy on IS with convex surface on the line of incongruence (a3 = -0.09, n.s.; a4 = -1.90, p < 0.05). Convex surfaces on the line of
incon-gruence indicate that QWL related to the factor in question
has its score reduced to the extent to which RV > DV and the difference between them increases. That is, QWL related to FAC decreases sharply when real conservatism is greater than desired conservatism in the direction in which this differen-ce increases. Similarly, QWL related to IS sharply decreases when real hierarchy is greater than desired hierarchy and this difference increases.
Discussion
This study’s objective was to verify the effects of OV
on QWL. The effects analysis was based on the
person-orga-nizational i t – POF –, regarding the workers’ perceived and desired OV. The quadratic polynomial regression model was
used with surface analysis charts, as the literature indicates that this is the most appropriate method to be applied to situa-tions in which the investigation is based on two variables that
compose a criterion (Edwards & Parry, 1993; Shanock et al.,
2010), which allows for a better explanation of the variance
when compared to other methods and the verii cation of the
existence of non-linear relationships between the independent and dependent variables. The variables considered were real
and desired OV, which together compose the coefi cient of
satisfaction related to the construct (Tamayo & Borges, 2006; Tamayo et al., 2000).
quadratic regressions performed with each pair of factors that compose the independent variable OV and the dependent va
-riable QWL explained the variance of the irst on the second, with statistical signiicance. These indings can encourage or
-ganizations to relect upon the values they declare and those
that are in fact put into practice, in order to develop strategies intended to promote greater congruence from the
perspecti-ve of workers, positiperspecti-vely impacting QWL and consequently,
productivity, as reported in the literature (Mejbel et al., 2013; Walton, 1973, 1980).
The use of quadratic regression with surface analysis
charts revealed that some relationships between criterion and
outcome variables are not linear. This inding is relevant for researchers addressing congruence in the ield of organizational behavior, as it supports decision making with regard to what
model to adopt in studies. The results are also consistent with
the literature that defends that polynomial quadratic regression
with surface analysis charts is an approach that permits exami-ning the extent to which the combination of two predictor va-riables affects the result of another variable (Edwards & Parry,
2003; Shanock et al., 2010), particularly when the investigation
is based on the congruence/discrepancy between two predictor variables, as is the case of this study (RV and DV).
Non-linear relationships were found in the composition
of the effect of four OV factors (autonomy; conservatism; hie -rarchy; and egalitarianism) on three of the QWL factors (inte-gration, respect and autonomy; fair and appropriate compensa-tion; and incentive and support). The non-linear relationships indicate there is maximum expectation of improvement for the QWL factors, which remain stable after achieving this le-vel (though it may decrease) in case congruence/discrepancy
of OV continue changing. The chart in Figure 2 provides a
perspective on this type of situation. There is a point of
in-lection on the surface and one can see that, when congruence obtains higher scores of OV, QWL increases. When, however,
congruence obtains lower scores, QWL decreases.
This is important for organizations because it leads to
more precise deinitions of actions and interventions intended
to actually promote QWL. This is so because, in cases similar
to that exempliied in igure 2, the analysis shows that im -proved results are achieved when expectation and reality are congruently higher. Therefore, in the case of incongruence,
attempting to decrease the expectations of workers to achie -ve congruence is not recommended. As the results show, this
type of intervention could lead to satisfaction with OV and to a worse perception of QWL. In the same sense, the indings
indicate that, if real conservatism is greater than desired con-servatism, QWL related to FAC decreases when the differen-ce between them increases. The same is true for the effect of the hierarchy value on QWL related to IS. This information indicates that organizations should carefully assess the type of intervention to be performed if they desire to promote QWL
by implementing interventions to affect OV.
In this study, the congruence of OV that explain most
of the variance in QWL was egalitarianism. The effects of this factor on QWL related to IRA and IS were non-linear in the surface analysis of the line of congruence and linear in the surface analysis of the line of maximum incongruence.
This type of information shows that there are scoring ranges in which QWL can be greater when there is incongruence than when there is congruence, which somewhat contradicts the
initial hypothesis, showing that it was not fully conirmed for
all the relationships. A potential explanation for this fact is
that a larger effect of incongruence occurs when the workers’
perceived egalitarianism (RV) is placed above their expec-tations with regard to DV and that the hypothesis was not originally proposed considering different directions of incon-gruence (DV > RV and DV < RV).
In general, this study’s indings suggest that satisfaction with OV affects QWL, but such an effect may have a limited
impact that, when achieved, indicates that new interventions
intended to change the satisfaction of workers with OV would
not increase QWL. The study also shows that congruence by itself will not always determine a positive impact on QWL because positive situations for QWL can occur when the
com-pany exceeds the expectations of workers with regard to spe
-ciic OV.
As any exploratory research, this study presents limita-tions, including the fact that data were collected via internet,
which does not allow for the clariication of potential doubts
in real time; the small sample size and its general characte-ristics, considering the large number of professionals with a college degree, which may have resulted in unbalanced data with regard to a more representative population of the real or-ganizational environment; and the exclusive use of self-report
scales, one of which (OVI) may lead to a social desirability
bias, as the items of real and desired values are presented si-de-by-side, perhaps conveying the idea that what one desires should be different (if not greater or better) from what one actually has.
Despite these limitations, this study contributes to a
broader understanding of the impact promoted by the POF of organizational values on workers’ QWL. Therefore, the un -derstanding of non-linear relationships among the constructs also contributes to the generation of insights that may lead to organizational strategies, whose values may improve QWL
and, consequently, productivity. The sample was composed of professionals working in companies of different sizes from
various sectors and occupying different positions at different hierarchical levels. Even though this was not the focus of this
analysis, it is an issue that instigates new research questions to conirm these indings in intra-sectorial or intra-company
situations.
Another contribution refers to the statistical method
adopted; the quadratic regression with surface analysis chart
is seldom used in psychological studies in Brazil. In this sen-se, new studies could address relationships and impacts on the scope of organizational behavior measures. These studies could also contribute to the dissemination and greater
appro-priation of the framework of analysis this approach permits.
References
intelli-gence as predictors of quality of work life among bank workers in Ibadan, Nigeria. European Scientiic Journal,
11(4), 110-130. Retrieved from http://eujournal.org/index. php/esj/article/view/5145/5034
Almalki, M. J., FitzGerald, G., & Clark, M. (2012). The rela
-tionship between quality of work life and turnover inten -tion of primary health care nurses in Saudi Arabia. BMC Health Services Research, 12, 314. doi:10.1186/1472-6963-12-314
Argüelles Ma, L. A., Quijano García, R. A., Fajardo, M. J., Magaña Medina, D. E., & Sahuí Maldonado, J. A. (2014).
Propuesta de modelo predictivo de la calidad de vida la-boral en el sector turistico Campechano, Mexico
[Propo-sal predictive model of quality of working life in tourism
Campechano, Mexico]. Revista Internacional Administra-ción & Finanzas, 7(5), 61-76.
Barzegar, M., Afzal, E., Tabibi, S. J., Delgoshaei, B., &
Koo-chakyazdi, S. (2012). Relationship between leadership behavior, quality of work life and human resources pro -ductivity: Data from Iran. International Journal of Hospi -tal Research, 1(1), 1-14.
Campos, M. I., & Rueda, F. J. M. (2016). Assédio moral:
Evi-dências de validade de escala e relações com qualidade de vida no trabalho. [Workplace bullying: Scale validity evi
-dence and relationship to quality of work life]. Avaliação
Psicológica, 15(1), 21-30. doi:10.15689/ap.2016.1501.03
Contreras, F., Espinosa, J. C., Hernández, F., & Acosta, N.
(2013). Calidad de vida laboral y liderazgo en trabajadores asistenciales y administrativos en un centro oncológico de
Bogotá (Colombia) [Work quality of life and leadership in
administrative staff and health care personnel of an
onco-logical center in Bogotá (Colombia)]. Psicología Desde el Caribe, 30(3), 569-590. Recuperado de http://www.scielo. org.co/pdf/psdc/v30n3/v30n3a07.pdf
Edwards, J. R., & Parry, M. E. (1993). On the use of polyno
-mial regression equations as an alternative to difference
scores in organizational research. Academy of
Manage-ment Journal, 36(6), 1577-1613. doi:10.2307/256822
Erdem, M. (2014). The level of quality of work life to predict work alienation. Educational Sciences: Theory & Practi-ce, 14(2), 534-544. doi:10.12738/estp.2014.2.2126
Maroco, J., & Garcia-Marques, T. (2006). Qual a iabilidade do alfa de Cronbach? Questões antigas e soluções modernas? [How reliable is Cronbach’s alpha? Old issues and modern
solutions?] Laboratório de Psicologia, 4(1), 65-90.
Mejbel, A. A., Almsair, M. K., Siron, R., & Alnaser, A. S. M. (2013). The Drivers of Quality of Working Life (QWL):
A critical review. Australian Journal of Basic and Applied Sciences, 7(10), 398-405.
Mendonça, M. A., Hora, H. R. M., Costa, H. G., & Montei
-ro, G. T. R. (2014). Qualidade de vida no trabalho no se
-tor petrolífero: Uma comparação entre os colaboradores onshore e offshore. [Quality of working life in the oil sec
-tor: a comparison between onshore and offshore workers].
Revista Brasileira de Qualidade de Vida, 6(2), 115-129.
doi:10.3895/S2175-08582014000200006
Nespeca, M., & Cyrillo, D. C. (2011). Qualidade de vida no
trabalho de funcionários públicos: Papel da nutrição e da qualidade de vida [Life quality in civil servants’ labor: the roles of nutrition and life quality]. Acta Scientiarum. Health Science, 33(2), 187-195. doi:10.4025/actasciheal-thsci.v33i2.7885
Nowrouzi, B., Lightfoot, N., Carter, L., Larivière, M.,
Rukholm, E., Schinke, R., & Belanger-Gardner, D. (2015). The relationship between quality of work life
and location of cross-training among obstetric nurses in
urban northeastern Ontario, Canada: A population-based
cross sectional study. International Journal of Occupatio -nal Medicine and Environmental Health, 28(3), 571-586. doi:10.13075/ijomeh.1896.00443
Oliveira, A. F., & Souza, M. A. (2014). Coniança do empre
-gado na organização: O impacto dos valores pessoais e or
-ganizacionais. [Employee conidence in the organization:
impact of personal and organizational values]. Revistas Psicologia Organizações e Trabalho, 14(2), 204-217.
Ouppara, N. S., & Sy, M. V. U. (2012). Quality of work life
practices in a multinational company in Sydney, Australia. Procedia - Social and Behavioral Sciences, 40, 116-121. doi:10.1016/j.sbspro.2012.03.169
Pedroso, B., & Pilatti, L. A. (2010). Revisão literária dos mode
-los clássicos de avaliação da qualidade de vida no trabalho: Um debate necessário [Literary review of the classic models of quality of life at work evaluation: A necessary debate]. In R. Vilarta, G. L. Gutierrez, M. I. Monteiro (Orgs.), Quali-dade de vida: Evolução dos conceitos e práticas no século XXI [Quality of life: Evolution of concepts and practices in the 21st century] (pp. 197-206). Campinas, SP: Ipes.
Rueda, F. J. M. (2013). Escala de Avaliação de Qualidade de Vida no Trabalho(Escala-QWL). [Quality of Life at Work Rating Scale (QWL-Scale)] São Paulo, SP: Casa do Psicólogo.
Rueda, F. J. M., Ottati, F., Pinto, L. P., Lima, T. H., & Bueno, J. M.
P. (2013). Construção e validação de uma escala de avaliação
da qualidade de vida no trabalho [Development and validation of a quality of life at work scale]. Avaliação Psicológica, 12(1), 43-50. Recuperado de http://pepsic.bvsalud.org/scielo.php?s-cript=sci_arttext&pid=S1677-04712013000100007 &lng=p-t&nrm=iso
Rueda, F. J. M., Serenini, A. L. P., & Meireles, E. (2014).
Re-lação entre qualidade de vida no trabalho e coniança do empregado na organização. [Relationship between quality of work life and trust employee in the organization]. Revista Psicologia Organizações e Trabalho. 14(3), 303-314. Recu-perado de http://pepsic.bvsalud.org/scielo.php?script=sci_ar-ttext&pid=S1984-66572014000300006 &lng=pt&nrm=iso
Saraç, M., Eil, I., & Eryilmaz, M. (2014). A study of the re
-lationship between person-organization it and employee
Shanock, L. R., Baran, B. E., Gentry, W. A., Pattison, S. C.,
& Heggestad, E. D. (2010). Polynomial regression with response surface analysis: A powerful approach for exa-mining moderation and overcoming limitations of diffe-rence scores. Journal of Business and Psychology, 25(4), 543-554. doi:10.1007/s10869-010-9183-4
Silva, C. A., & Ferreira, M. C. (2013). Dimensões e indicado
-res da qualidade de vida e do bem-estar no trabalho [Di
-mensions and indicators of quality of life and well-being at work]. Psicologia: Teoria e Pesquisa, 29(3), 331-339. doi:10.1590/s0102-37722013000300011
Sousa, J. M., & Porto, J. B. (2015). Happiness at work: Orga
-nizational values and person-organization it impact. Pai-déia(Ribeirão Preto), 25(61), 211-220. doi:10.1590/1982-43272561201509
Šverko, B., & Galić, Z. (2014). The perceived quality of working life in Croatia and the European Union.
Društ-vena Istraživanja, 23(4), 557-575. doi:10.5559/di.23.4.01
Tamayo, A., & Borges, L. O. (2006). Valores do trabalho e das organizações [Work and organizational values]. In M. Ros & V. V. Gouveia (Orgs.), Psicologia social dos valores hu-manos: Desenvolvimentos teóricos, metodológicos e apli-cados [Social psychology of human values: Theoretical, methodological and applied developments]. (O. Cafalc -chio, Trad., pp. 397-431). São Paulo, SP: Editora Senac.
Tamayo, A., Mendes, A. M., & Paz, M. G. T. (2000). Inven
-tário de valores organizacionais. [Organizational values
inventory]. Estudos de Psicologia (Natal), 5(2), 289-315. doi:10.1590/S1413-294X2000000200002
Walton. R. E. (1973). Quality of working life: What is this?
Sloan Management Review, 15(1), 11-21.
Walton, R. E. (1980). Quality of work life activities: A re -search agenda. Professional Psychology, 11(3), 484-493. doi:10.1037/0735-7028.11.3.484
Maria Isabel de Campos is a Ph.D. candidate and master in
the Stricto Sensu Graduate Program in Psychology at Univer -sidade São Francisco, Campinas, São Paulo, Brazil.
Fabián Javier Marín Rueda is a Professor in the Stricto Sen-su Graduate Program in Psychology at Universidade São Francisco, Campinas, São Paulo, Brazil.
Received: Mar. 18, 2016 1st Revision: Aug. 3, 2016 Approved: Oct. 11, 2016
How to cite this article:
Campos, M. I., & Rueda, F. J. M. (2017). Effects of