University of Minho
School of Engineering
Susana Raquel da Silva Barbosa
Development of a data integration
pipeline for human metabolic models and
databases
University of Minho
School of Engineering
Susana Raquel da Silva Barbosa
Development of a data integration
pipeline for human metabolic models and
databases
Master’s Thesis
Bioinformatics Msc
Supervisor
Professor Doutor Miguel Rocha
i
Declaração
Nome: Susana Raquel da Silva Barbosa
Endereço eletrónico: [email protected] Número do cartão de cidadão:14104824
Título da Dissertação: Development of a data integration pipeline for human metabolic models and databases
Orientador: Professor Doutor Miguel Rocha Ano de conclusão: 2016
Designação do Mestrado: Mestrado em Bioinformática
É AUTORIZADA A REPRODUÇÃO INTEGRAL DESTA TESE/TRABALHO APENAS PARA EFEITOS DE INVESTIGAÇÃO, MEDIANTE DECLARAÇÃO ESCRITA DO INTERESSADO, QUE A TAL SE COMPROMETE;
Universidade do Minho, 31 / 01 / 2016
ii
Acknowledgements
First of all, I would like to thank my parents, that allowed me to study and always had my back despite the adversities. To my brother for the cakes and desserts, that were always a breath of fresh air.
To all my friends that walked with me in this journey, specially my ladies with their motivational talk.
I thank Prof. Miguel Rocha, that allowed me to do this work, for his available time guiding me through it.
I thank Sara that supported me in the decision of being autodidact and learn Java to integrate in this project, teaching me the first steps. To Liu who introduced me to the Neo4j world and was also giving me hints about Java. Both were fundamental in this work and am deeply thankful by all the transmitted knowledge.
Lastly, I would like to let a very special thanking note to my all-time companion that was always by my side. Thankful for all the lost hours with me, the patience, the caring and comprehension. You were there through all the moments, so I would not fall and always gave me strength to proceed with the challenges I proposed myself to.
iii
Abstract
Systems Biology aims to integrate experimental and computational approaches with the purpose of explaining and predicting the organisms' behavior. The development of mathematical models in silico gives us a better in-depth knowledge of their biological mechanism. Bioinformatics tools enabled the integration of a large amount of complex biological data into computer models, but also capable to perform computational simulations with these models, that can predict the organisms' phenotypic behavior in different conditions.
Up to date, genome-scale metabolic models (GSMMs) include several metabolic components of an organism. These are related to the metabolic capabilities encoded in the genome. In recent years, multiple GSMMs have been built by several research groups. With the increase in number, of these models, important issues regarding the standardization have arisen, a common problem is the different nomenclatures used by each of the research groups.
In this work, the major focus is to address these problems, specifically for the human GSSMs. Therefore, the two most recent human GSMMs were selected to go through a data integration process.
Integration strategies of these models most important entities (metabolites and reactions), were defined based on an exhaustive analysis of the models. The broad knowledge of their attributes enabled the creation of effective and efficient integration methods, supported by a core database developed in the local research group.
The final result of this work, is a unified repository of the human metabolism. It contains all the metabolites and reactions that were automatically integrated along with some manual curation.
iv
Resumo
A Biologia de Sistemas pretende integrar abordagens experimentais e computacionais com o objetivo de explicar e prever o comportamento dos organismos. O desenvolvimento in silico de modelos matemáticos permite atingir um conhecimento mais aprofundado dos seus mecanismos biológicos. Através de ferramentas Bioinformáticas é possível integrar uma grande quantidade de dados complexos nestes modelos computadorizados, assim como, realizar simulações computacionais que permitem prever o comportamento fenotípico dos organismos em diferentes condições ambientais.
Até à data, os Modelos Metabólicos à Escala Genómica (MMEGs) incluem muitos componentes metabólicos de um organismo, relacionando a codificação do seu genoma com as suas capacidades metabólicas. Nos últimos anos, têm sido construídos vários MMEGs, por diferentes grupos de investigação. Com o crescente surgimento destes, tem-se denotado grandes falhas ao nível da padronização, uma vez que são utilizadas diferentes nomenclaturas por cada grupo de investigação.
Neste trabalho, pretende-se colmatar essas falhas especificamente para os MMEGs humanos. Deste modo, foram selecionados os dois MMEGs humanos mais recentes, para passarem por um processo de integração de dados.
As estratégias de integração das entidades mais importantes destes modelos (os metabolitos e as reações) foram definidas com base numa análise exaustiva dos modelos. O conhecimento dos atributos destes permitiu construir métodos eficientes e eficazes, tendo como núcleo uma base de dados desenvolvida no grupo de acolhimento. O resultado final deste trabalho é um repositório unificado do metabolismo humano. Neste, estão contidos todos os metabolitos e reações que foram integrados automaticamente, com alguma verificação manual.
v
List of Figures vii
List of Tables ix List of Acronyms xi 1 Introduction 1 1.1 Context ...1 1.2 Motivation...3 1.3 Objectives ...4
1.4 Structure of the Thesis ...5
2 Computational representations of human metabolism 6 2.1 Metabolic Models ...7
2.1.1 Human Genome-Scale Metabolic Models ...9
2.2 Metabolic Databases ...12
2.3 Metabolic Data Integration: studies and applications ...15
3 Graph Databases for Metabolic Data Integration 19 3.1 Graph Databases ...19
3.2 Neo4j ...20
3.3 A graph database for metabolic data integration ...23
3.3.1 Database Structure ...24
3.3.2 Populating the Database: ETL ...27
3.3.3 Integration Algorithms ...28
4 Building a Human Metabolic Integrated Repository 33
4.1 Implementation language ...33
4.2 Issues in the Integration of Human Metabolic Models ...34
4.3 Local database ...35
4.3.1 Structure ...36
4.3.2 Data Loading from SBML ...39
4.4 Integrating Human Models in the Graph Database ...41
4.4.1 Integrating Metabolites ...41
4.4.2 Integrating Reactions ...46
5 Results 52 5.1 Characterizing the human models ...52
5.1.1 Global characterization of the models ...52
5.1.2 Examples of inconsistencies found ...57
5.2 Integration results ...59
5.2.1 Metabolites ...59
5.2.2 Reactions ...64
5.3 Analysis of a specific subsystem: the Glycolysis Pathway...67
6 Conclusions 74
A Results 76
vii
List of Figures
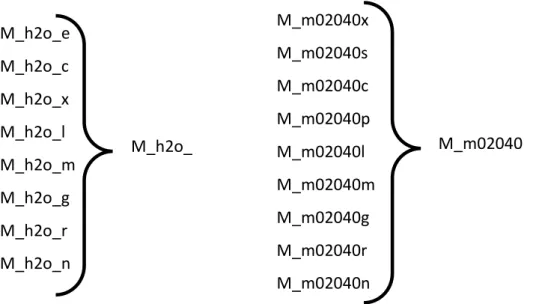
Figure 2.1 - Overview of the process of a genome-scale metabolic model reconstruction and iterative refinement cycle. [36] ... 8 Figure 3.1 - Example of a query to unified database using the Neo4j Web application.22 Figure 3.2 - Representative scheme of a part of the graph visualization, in the Neo4j platform. ... 25 Figure 3.3 - Organization of unified graph database. a) Reaction schema. Each reaction is connected to its reactants and products (left or right). It has Name and E.C. Number. b) Each metabolite is composed of Name, Charge, Molecular Formula, InChI, SMILES (Simplified Molecular Input Line Entry System). ... 26 Figure 4.1 - A group of species entries is transformed into a metabolite entry. Recon 2 on the left side and HMR2.0 on the right side. ... 36 Figure 4.2 - Metabolite’s Entity-Relationship Model. ... 38 Figure 4.3 - Reaction’s Entity-Relationship Model. ... 39 Figure 4.4 - Example of an integrated cluster. In the square label, are represented two species of water, through the entry used in the HMR2.0 and Recon 2 models, respectively. The references in the circle (cluster) are from the BiGG, ChEBI, KEGG and MetaCyc databases... 42 Figure 4.5 - Representative schema of an element in SpeciesMapping. LIPID-LIPIDMAPS; LC-LigandCompound; LG-LigandGlycan; LD-LigandDrug. ... 43 Figure 4.6 – Example of an element of the SpeciesInReactions map. In the left side is double key (clusterID and stoichiometric value) and in right side are the values (reactionsEntry). ... 47 Figure 4.7 - Four examples of the reactions’ composition in reactionComposition map. The first two (of different models) are the same reaction, the same happens with the rest. ... 49
Figure 4.8 - Explanation of the compatibility of reactions. The A, B, C and D letters represent the species. The reactants and the products are, respectively, the left side and right side of each reaction. ... 50 Figure 4.9 - Representative scheme of how the inversion of the composition of a reaction occurs and how it becomes equivalent to another from some other model. The reactionEntry R_PGI and the R_HMR_4381 belong, respectively, to the
ReactionComposition map of Recon 2 and the HMR2.0. ... 50
Figure 5.1 - Evaluation of the amount of metabolites that have references per model. ... 53 Figure 5.2 - In the Recon 2 model, 55% of the metabolites have references, and these are splitted in three types. ... 53 Figure 5.3 - In Recon 2, each species can have more than one type of reference. In this Venn diagram it can be seen the amount of metabolites that are dependent of just one type of reference and also the ones that possess multiple references. ... 54 Figure 5.4 - In the HMR2.0 model, 59% of the metabolites have references, and these are splitted in four types. ... 54 Figure 5.5 - Type of reactions in Recon 2 and HMR2.0 models. ... 57 Figure 5.6 - Examples of different metabolites that are compatible with just a metabolite of the other model. The first example refers to this occurrence of the HMR2.0 to the Recon 2, and the second is the reverse. ... 60 Figure 5.7 - Gains with the population of the species in unified database. The columns represent the number of species that were populated with references through a certain property. The lines are the clusterID numbers (metabolites) that were obtained (through the unified database), as the species were being populated. ... 63 Figure 5.8 - Representation of numeric values of metabolites found through the Clusters of the unified graph database versus the metabolites of the local database (originated from the models). In the middle are the shared metabolites. ... 64 Figure 5.9 - Representation of glycolysis subsystem. The colours dark yellow, blue and green, represent, respectively, the unique reactions of Recon 2, HMR2.0, and the reactions shared by both. ... 71
ix
List of Tables
Table 2.1 - Comparison of features of Recon1, Edinburgh (with compartmentalization), Recon 2 and HMR 2.0. ... 11 Table 3.1 - Number of metabolites (first part) and reactions (second part) in the unified database. ... 23 Table 3.2 - Primary properties of the metabolites. KEGG instances with Mol structures have computed (*) InChI and SMILES. ... 25 Table 3.3 – Description of the functions most commonly used to query the unified database. ... 32 Table 5.1 - Global analysis of the model’s metabolites. The bottom part of the table bases itself only in the metabolites that do not have references (45% and 41%, in Recon 2 and HMR2.0, respectively). ... 55 Table 5.2 - Representative table of an inconsistency situation. Specifically in the Name, ChEBI and Ligand Compound (LC) entities. Met_id-Metabolite_id. ... 58 Table 5.3 - Representative table of an inconsistency situation. Specifically in the Name, ChEBI and Ligand Compound (LC) entities. Met_id-Metabolite_id. ... 58 Table 5.4 - Representative table of an inconsistency situation. Specifically in the Formula entity. LC-LigandCompound ... 59 Table 5.5 - Number of species, which through a certain property, have obtained references, by search method for references in Neo4j platform of the unified database. ... 61 Table 5.6 - Number of unique reactions, by method, for which there is correspondence in the other model. The grey columns represent the results using the reversibility. .... 65 Table 5.7 - Number of unique reactions, by type and method, for which there is correspondence in the other model. The Recon2 is the grey column and the HMR2.0 is the white. * line with results using the reversibility. ... 66
Table 5.8 - Numeric results of subsystem Glycolysis... 69 Table 5.9 - Reactions’ data (identified by a number) represented in the schema above. The colours dark yellow, blue and green, represent, respectively, the unique reactions of Recon 2, HMR2.0, and the reactions shared by both. The cofactors that are represented by the same order of its reactions, being “-“ the discerning element of the left and right sides. The entry of the reactions are abbreviated, missing the prefix (“R_” and “R_HMR_”). Subtitle of the compartments: C-Cytosol, R-Endoplasmic reticulum, M-Mitochondria, X(Recon 2) -Peroxisome, P(HMR2.0)-Peroxisome. ... 72 Table A.1 - Integration's result of the model's reactions from Recon 2 and HMR2.0, employing the direct comparison method through of the KEGG (Reaction) references (common element). ... 76
xi
List of Acronyms
Ac-FAO Acylcarnitine and Fatty-Acid Oxidation
ACID Atomicity, Consistency, Isolation, Durability
API Application Programming Interface
BiGG Biochemical Genetic and Genomic
BKM-react BRENDA-KEGG-MetaCyc-reactions
BRENDA BRaunschweig ENzyme DAtabase
ChEBI Chemical Entities of Biological Interest
CTS Chemical Translation Service
DB Database
EC Enzyme Commission
EHMN Edinburgh Human Metabolic Network
ETL Extract, Transform and Load
FBA Flux Balance Analysis
GSMM Genome-Scale Metabolic Model
HepatoNet1 Hepatocyte Network 1
HMR 2.0 Human Metabolic Reaction 2.0
HTTP HyperText Transfer Protocol
InChI International Chemical Identifier
JVM Java Virtual Machine
IUBMB International Union of Biochemistry and Molecular Biology
KEGG Kyoto Encyclopedia of Genes and Genomes
PGDB Pathway/Genome Database
SB Systems Biology
SBML Systems Biology Markup Language
SMILES Simplified Molecular Input Line Entry System
SQL Structured Query Language
1 1 Chapter 1
Chapter 1
Introduction
1.1 Context
In the last decades, different research areas, mainly Biology and Computer Sciences, were combined to obtain a better understanding of cellular behaviour. The combination of these fields with the advances in high-throughput techniques allowed the study and a better understanding of how cells work and react to environmental perturbations, the regulation of cellular processes, and even anticipate the behaviour of cells. The metabolism represents all chemical transformations (reactions) that occur within the cell, making this network one of the best characterized in Biology [1].
Systems Biology (SB) resorts to computational tools to study cellular organisms in a system scope by developing models that allow in silico phenotype predictions [2]. The computational simulation of mathematical models allows a deeper comprehension of the internal nature and dynamics of cells’ processes. Thus, SB is intertwined with Bioinformatics, an information management discipline dedicated to biological data storage, processing, analysis, forecasting and modelling, relying on the use of computer sciences [3].
In the last years, several metabolic models have been proposed to explain and study cell behaviour. These models, under constraint-based modelling approaches, allow the representation of biological knowledge in a mathematical format and the computation of physiological states [4-6], addressing a variety of scientific questions [7, 8]. There are small-scale models, which are composed by a few pathways, and genome-scale models that include all known components of an organism.
Genome-scale metabolic models (GSMMs) [9] integrate physiological information and biochemical metabolic pathways with genome sequences. These models allow the interaction between subsystems, which increases the capability of phenotype prediction in different scenarios. Computational analysis of genome-scale metabolic models, has been used for biochemical [10, 11], biomedical [12-14], bioengineering [15, 16] and Metabolic Engineering [7] purposes. In Metabolic Engineering, the manipulation of metabolic models has the purpose of optimizing the genetic processes to increase the production of an interesting compound. One of the widely used organisms for industrial requirements is Escherichia coli. Several E. coli strains have been systematically designed to overproduce target metabolites, such as lactate, ethanol, succinate and aminoacids [17] through in silico analysis.
Another application of GSMMs is in the biomedical research area, where one of the major tasks is to understand the relationship between metabolism and human diseases. Multifactorial diseases involve alterations in hundreds of genes, developmental factors and environmental conditions [18]. In this context, the knowledge of metabolism is fundamental to understand the phenotypic behaviour of cells. Thus, it is crucial to identify perturbed molecular mechanisms that cause such diseases to discover possible drug targets. The knowledge of metabolism together with individual’s genetic background, environmental factors and their predisposition to genetic diseases, may lead to personalised medicine in the near future. For all these reasons, nowadays, one of the biggest challenges is to be able to completely represent in silico the human metabolism. To this end, human metabolic networks [19-22] have been constructed during the last years.
1.2 Motivation
One of the steps in the reconstruction of a GSMM is the annotation of its components [23]. This step aims to unambiguously identify those components and provide an efficient mapping between the identifiers and information essential for the reconstruction and analysis processes. However, errors may occur in this step. The incomplete or incorrect annotations present in databases and available models can be propagated to all new reconstructions.
In the development of human GSMMs, other problems have been detected, such as the non-uniqueness of metabolite identifiers across models, unbalanced atomic species arising from an incorrect stoichiometry or formula for one or more reactions, incorrect or missing cofactors, among others [24].
The lack of usage of standards for the annotation of metabolites and reactions makes the comparison of different models extremely difficult. Moreover, it is natural that distinct databases share common records, but the lack of cross-references between them makes the task of achieving a consensus quite hard. In addition, each database focus different types of content which makes the overlap low [18].
In the existing protocols for genome-scale metabolic reconstruction [23], it is recommended to annotate metabolites with a primary identifier from at least one of the metabolic databases (e.g., KEGG [25]), but not all of the existing models follow this recommendation.
One way to minimize models annotation problems, and reach a more complete set of information is to integrate several data sources, including databases and models. Usually, models integrate several databases through the mapping of identifiers. The majority of data integration applications are exclusive to chemical compounds, lacking the capability to integrate chemical reactions. Furthermore, the integration of GSMMs exposes additional complexity, since these systems incorporate additional mechanisms, for instance the need of gathering the information of multiple instances that represent the same metabolite (e.g. in multiple compartments). Integration systems are prone to a variety of errors such as, for example, a metabolite being associated to identifiers of
another metabolite. According to previous comparative evaluation of computational integration tools [26], it is important to establish data quality control and confidence scores for incoming information. In the end, a manual analysis of the data is always necessary.
This work focuses in human genome-scale metabolic models. Hence, a pipeline will be developed that will integrate human models with the existing databases seeking to overcome the limitations of the available platforms. To attain an integrated GSMM of the human species, the laborious task of manual curation is essential, which in turn may provide valuable insights to improve the integration pipeline.
The final result of this work will be a human genome-scale repository. It may be used for the creation of a new human GSMM, composed by curated data, which might be safely used for the most diverse studies and applications, especially within the biomedical field. In addition, this will be an important step towards the standardization and evolution of the human GSMMs, since the scientific community will be able to use this human repository as a standard to improve the models continually.
1.3 Objectives
The main goal of this work is to efficiently integrate existing human genome-scale metabolic models with a set of bioinformatics databases that include information on reactions and metabolites, enriching an existing data integration platform developed in the host group, to build an integrated, unified and global repository of human metabolism.
This will encompass the following scientific/ technological objectives:
Review the main tools and standards within the fields of human metabolic modelling and data integration in this context;
Implement a pipeline to integrate data from human genome-scale metabolic models with data from metabolic-oriented databases (e.g. KEGG, MetaCyc [27]);
Improve the pipeline according to the insights provided by manual curation;
Build a final integrated human genome-scale repository.
1.4 Structure of the Thesis
The thesis is organized into six chapters. This chapter includes a short description of the state of the art, as well as the motivation and objectives for this work.
The remaining chapters are organized as follows:
Chapter 2 - Computational representations of the human metabolism
Description of the constitution and main concepts of the metabolic models, with focus on the main Human Genome-Scale Metabolic Models. Likewise, existing metabolic database are characterized. Finally, an analysis is made to existing applications of the metabolic data integration.
Chapter 3 - Graph Databases for Metabolic Data Integration
Explanation of the structure of a graph database, in particular Neo4j and the advantages of its use. Then, the details of a particular database are exposed, which are used in the process of integrating metabolic data.
Chapter 4 - Building a Human Metabolic Integrated Repository
In this chapter are defined which strategies to use in the integration process and, consequently, the construction of a repository.
Chapter 5 - Results
Here, the results of the study, of the selected models for the integration process, are presented, as well as the obtained results with that integration.
Chapter 6 – Conclusions
6 2 Chapter 2
Chapter 2
Computational representations of
the human metabolism
The aim of Systems Biology is to understand biological systems, studying their structure, dynamics, control and design methods [28], by integrating computational and theoretical approaches with experimental data. New knowledge in this field is being gathered through tools, such as automated genome annotation, genome-scale metabolic reconstructions and regulatory network reconstruction using microarray data [29].
Bioinformatics is an interdisciplinary field that combines computer science, statistics, mathematics and engineering, to develop methods and software tools for understanding biological data [3]. Bioinformatics and Systems Biology are rapidly growing fields that focus on the complex interactions in biological systems and how these interactions give rise to the function and behaviour of these systems.
The huge technological advances resulted in high performance experimental techniques, which caused a high rate of biological data generated recently. The management of these data and their integration is being realized through Bioinformatics tools. As a result, this provides new insights to understand biological processes that generate new hypotheses to be tested, making it an iterative cycle.
2.1 Metabolic Models
Metabolic models are reconstructed with the aim of understanding the relationship between the genome and the physiology of an organism/cell [9]. These comprise the chemical reactions of metabolism and their metabolic pathways. The main components of a model are the metabolic reactions, the compartments where these reactions occur, the metabolites that participate in those reactions, the enzymes that catalyse these reactions, and the genes that encode those enzymes.
Metabolic models are complex and are based on a highly interconnected network of reactions and metabolites. Computational approaches are required to elucidate and understand metabolic genotype–phenotype relationships. Therefore, their reconstruction has become an indispensable tool for studying the systems biology of metabolism [17, 30-34]. The number of metabolic reconstructions for organisms increased due to the available whole genome sequences.
The genome-scale metabolic model reconstruction process should be careful, since models are used to simulate the behaviour of organisms. The reconstruction process involves several steps such as: genome annotation; identification of the reactions from the annotated genome sequence and available literature; determination of the reaction stoichiometry; definition of subcellular compartments; assignment of localization; determination of the biomass composition; estimation of energy requirements, and definition of model constraints [9, 17, 23, 35].
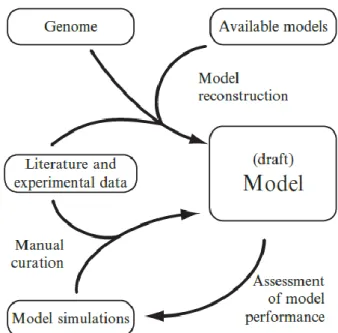
After assembling the genome scale metabolic network, there is a conversion of the reconstruction to a genome-scale metabolic model. The conversion is a process wherein the reconstruction is converted into a mathematical format, where the systems boundaries are defined, becoming a condition-specific model [23]. Finally, the model is validated and the cycle is repeated until a consensus is reached [36], as shown in Figure 2.1. The final model could be used to perform phenotype simulations through a constraint based modelling approach such as Flux Balance Analysis (FBA).
GSMMs are commonly represented using the Systems Biology Markup Language (SBML) [37]. This is a software-independent language, XML-based, available in an open and free format. Usually, GSMMs described using SBML have the following elements:
Compartments: each compartment is a container where reactions take place.
Species: each species is a chemical substance or entity that takes part in a reaction. This entity mainly represents the association of a metabolite with a compartment, where the reaction occurs, of which the metabolite is part. Thus, the same metabolite can be found in different compartments, therefore existing multiple species for the same metabolite. The genes and other substances involved in reactions can also be stored as a species component.
Reactions: An entity describing some transformation, transport or binding process that can change one or more species.
GSMMs have been applied in several studies, such as: contextualization of high-throughput data; guidance of metabolic engineering; directing hypothesis-driven discovery; interrogation of multi-species relationships; and network property discovery [7].
Figure 2.1 - Overview of the process of a genome-scale metabolic model reconstruction and iterative refinement cycle. [36]
Despite the growing amount of GSMMs, the quality of annotation of those does not follow the same trend. One of the main reasons is the lack of an operational standard procedure that is followed by all research groups. This leads to many problems concerning the comparison of models of the same organism. A model needs to be reconstructed multiple times until a final version is reached being that, the more complex the organism, the longer the process will be. Accordingly, every reconstructed model (by different research groups) for the same organism is different and uses different biological data.
The comparison between models is important to obtain a more complete model with all the available information. At the moment, this has been a laborious task, especially for the human organism. Since the amounts of data are huge and there is no unique standard for the annotation of metabolites and reactions in different models, making the identifiers of these entities completely different, the direct comparison is impossible. Thus, it is only possible to do this task in a semi-automatic procedure, using the unique properties of the entities, which are the markers belonging to metabolic databases (i.e. KEGG). Although the databases share common records, most of the times they do not have cross-references between them, making the task of reaching a consensus even harder.
The molecular formula of the metabolites can also help in this comparison, although they cannot be used as single identifiers since several metabolites can have the same formula, but be chemically different due to the structural organization of the atoms.
2.1.1
Human Genome-Scale Metabolic Models
In the past years, several groups have dedicated their efforts to the reconstruction of human metabolic networks. From these studies, several genome-scale metabolic models were developed, viz. Recon 1 [19], Edinburgh [20], Recon 2 [21] and HMR 2.0 [22] (see comparison between these models in Table 2.1) which are used as reference models.
These models have been used to explain metabolic behaviours, such as Warburg effect on cancer [38], to discover new targets for drugs and new biomarkers [39].
The Homo sapiens Recon 1 [19] was the first human genome-scale metabolic model fully compartmentalized. This reconstruction was based on genomic and bibliomic data. The manual literature-based reconstruction ensured that the network components and their interactions were based on direct physical evidence and reflected the knowledge of human metabolism. The validation of the basic functionality of this model was made through the in silico simulation of 288 known metabolic functions. The final model accounts for the functions of 1496 unique genes, 2004 proteins, 2766 metabolites, and 3311 metabolic and transport reactions.
The Edinburgh human metabolic network (EHMN) [20] was manually reconstructed by integrating genome annotation data from several databases and metabolic reaction information from literature. This model contains 2322 genes, 2671 metabolites, 2823 metabolic reactions and more than 800 Enzyme Commission (EC) numbers. However, since 1189 transport reactions and 457 exchange reactions were not considered, due to the fact that subcellular location information was still not included, researchers felt that there was a need to perform a compartmentalization of this model [40].
A compartmentalization enables a better understanding of the complexity of the human metabolism, because the micro-environments in different organelles may lead to distinct functions of the same protein and the use of different enzymes for the same metabolic reaction. Therefore, the previous model was extended by integrating the sub-cellular location information for the reactions, adding transport reactions and refining the protein-reaction relationships based on the location information. The validation of this “new” model was made by analysing pathways to examine the capability of the network to synthesize and/or degrade some key metabolites.
The Recon 2 [21] is a consensus “metabolic re-construction”, being the most comprehensive representation of human metabolism that is applicable to computational modelling. This model combines information from EHMN, HepatoNet1 (comprehensive reconstruction of human hepatocytes) [41], Ac-FAO [13] module (with acylcarnitine (AC) and fatty acid oxidation (FAO) metabolism) and the human small
intestinal enterocyte reconstruction with the content of Recon1. More than 370 transport and exchange reactions were added based on a review of literature. After this, unambiguous third-party identifiers for cellular compartments, metabolites, enzymes and reactions were applied.
The Human Metabolic Reaction 2.0 (HMR 2.0) [22] database is the largest biochemical reaction database for human metabolism in terms of number of reactions/genes/metabolites (including all of the genes, metabolites and reactions in the recently published models), as well as in terms of covering most parts of metabolism. The HMR 2.0 database was constructed using previously published genome-scale models and pathway databases, including KEGG, HumanCyc [42], Reactome [43] and LIPIDMAPS [44] Lipidomics Gateway. This was the result of the expansion of the previous HMR database [45] by including the lipid metabolism. Thus, it contains 59 fatty acids, which enable mapping and integration of lipidomics data. The resulting HMR2.0 database contains 3765 genes, 6007 metabolites (3160 unique metabolites) and 8181 reactions, and 74 percent of the reactions associated to one or more genes. Integration of extensive lipid metabolism may allow not only for the understanding of the contribution of lipids to the development of diseases, but also for the study of the relationship between lipid metabolism and cellular molecular mechanisms [46].
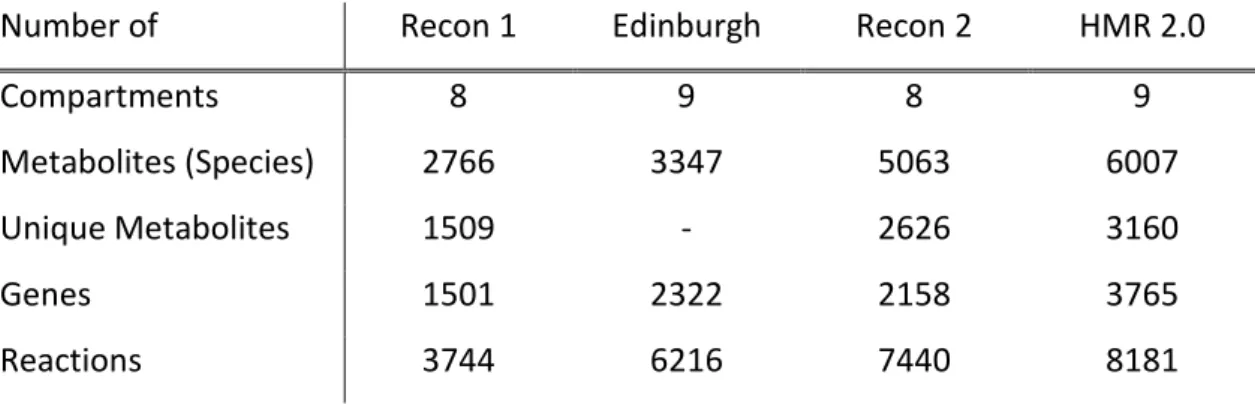
Table 2.1 - Comparison of features of Recon1, Edinburgh (with compartmentalization), Recon 2 and HMR 2.0.
Number of Recon 1 Edinburgh Recon 2 HMR 2.0
Compartments 8 9 8 9
Metabolites (Species) 2766 3347 5063 6007
Unique Metabolites 1509 - 2626 3160
Genes 1501 2322 2158 3765
2.2 Metabolic Databases
Metabolic databases are a valuable tool for the reconstruction and interpretation of metabolic models. These databases have detailed information about chemical entities and reactions, which are the primary components of these models. In the reconstruction of GSMMs, chemical entities can be annotated by several databases, being the most popular KEGG [25] and the ChEBI [47].
KEGG (Kyoto Encyclopedia of Genes and Genomes) is a knowledge base for systematic analysis of gene functions, linking genomic information with higher order functional information [25]. It can be seen as a computer representation of the biological system, where biological objects and their relationships at the molecular, cellular and organism levels are represented as separate database entries [48]. This integrates genomic, chemical and systemic functional information. Currently, it consists of 4 categories (Systems, Genomic, Chemical and Health information) and 17 main databases. The Chemical category is the most important for the comprehension of the metabolic models. Here, there is information related with the metabolites through the Compound database (which is a gathering of metabolites and other small molecules) and the Glycan database (that contains carbohydrates). Biochemical reactions are represented in the Reaction database, where the metabolites are involved as products and/or reagents. The reactions are connected to the enzyme databases, allowing the integration of genomic analysis. Thereby, through a simple search of a compound, the basic biochemical information, reactions and metabolic pathways in which it participates and even biomedical information, can be accessed.
ChEBI (Chemical Entities of Biological Interest) is a freely available dictionary of molecular entities focused on “small” chemical compounds. It systematically combines information from various databases, which is manually annotated and curated. So, it focuses on high quality manual annotation, non-redundancy, and provision of a chemical ontology rather than full coverage of the vast chemical space. In addition to molecular entities, ChEBI contains groups (parts of molecular entities) and classes of entities. The ChEBI database also includes a chemical ontology, which allows the
relationships between molecular entities or classes of entities and their parents and/or children to be specified in a structured way [47]. Thus, ChEBI provides detailed chemical data about compounds, which is important for the study of chemical interactions that occur within a cell.
Both databases attempt to supply cross-references between themselves and also for other databases. Despite the importance of these databases, for the study and integration of the existing GSMMs, there are also another databases that could be used to extend and improve the annotation of models entities.
BRENDA (BRaunschweig ENzyme DAtabase) is a collection of enzyme functional and molecular data [49]. It represents a comprehensive database containing all enzymes classified according to the EC classification system of the IUBMB [50] (International Union of Biochemistry and Molecular Biology). BRENDA contains information on all classified enzymes of organisms of all taxonomic groups.
The information is extracted from primary literature and manually curated. Each entry is linked to a literature reference and to the source organism. Additionally, BRENDA can provide large amounts of information as the existence of enzymes in organisms, their cellular localization, their involvement in human diseases, their active centers and interfaces and additional kinetic data. In summary, BRENDA stands out for not being limited to a specific aspect of the enzyme or to a specific organism.
BioCyc collection of Pathway/Genome Databases (PGDBs) provides electronic reference sources on the pathways and genomes of many organisms [51]. PGDBs provide genomic information with an extensive dimension that allows researchers to analyse the relationship between organism's genome and metabolic network. BioCyc is primarily microbial, but contains databases for humans and for important model organisms. Consequently, it allows comparative analysis, since multiple PGDBs are available within one place. BioCyc organizes its databases in tiers, according to the amount of manual curation and update they received.
Within BioCyc, the most relevant databases for the reconstruction and integration of GSMMs are HumanCyc and MetaCyc that are in tier one, which means that these have been created through intensive manual efforts and get continuously updated.
MetaCyc is a non-redundant reference database, of small-molecule metabolism that contains experimentally verified metabolic pathways and enzyme information [52]. MetaCyc contains pathways involved in the primary and secondary metabolisms, as well as associated metabolites, reactions, enzymes and genes. The MetaCyc goal is to catalog the metabolism universe, storing a representative sample of each of the pathways experimentally elucidated. Once that MetaCyc is based in experimentally elucidated and verified data only, it becomes a valuable asset for the study of the models metabolic pathways.
HumanCyc is a database of enzymatic reactions and human metabolic pathways [42]. The aforementioned is a PGDB for Homo sapiens, from the annotated human genome. It provides an expandable human metabolic map diagram, and it has been used to generate a steady-state quantitative model of human metabolism. HumanCyc positions human genes in a pathway context thereby facilitating analysis of gene expression, proteomics, and metabolomics datasets. Although HumanCyc is considered a curated database, it is not yet completely verified. Thus, despite having a helpful use, specifically in the human models, it must be cautiously used.
As reported, there are several databases with different purposes. The diversity and amount of information in databases allows to structure the knowledge to become more usable. However, since there are many available data in different databases, some problems regarding redundancy and inconsistency between them, can occur. The majority of the databases comprise cross-references between their data, but nonetheless it is possible to find incoherent information in considerable amounts.
2.3 Metabolic Data Integration: studies and
applications
In Stobbe et al. [18], the comparison of five databases (EHMN, Recon 1, HumanCyc, Reactome and the metabolic subsets of KEGG) and their analysis showed that only a small core of metabolic network coexists in all five databases. In particular, in the case of reactions, the overlap is quite low, since only 199 reactions can be found in all five databases. This occurrence is partially due to conceptual differences in the databases, like, for instance, in EHMN, where 23 percent of unique reactions are transport reactions and reactions in lipid metabolism. Knowing that one of the main reasons for the lack of overlap is the difference of content, not only the syntax, each one of the five pathway databases provides a valuable piece of the puzzle. This inability to directly make use of metabolite/reaction information from biological databases or other models, due to incompatibilities of representation, duplications and errors, is an obstacle for the reconstruction of new high quality metabolic models.
One of the purposes of information integration is the reconciliation of heterogeneous data sources to obtain a non-redundant, non-ambiguous and complete information system. The integration of heterogeneous data sources significantly enhances the quality of a reconstruction that eventually improves the quality standards. Thus, the reconciliation of metabolites and reactions is an essential step in the development of comprehensive metabolic models.
In order to fill the existing gaps in the databases and specially the lack of standards for the identifiers, applications that integrate multiple available resources have been created. This can ease, for instance, the process of automatically updating the annotations of GSMMs. Here, three open-source applications will be described that do the mapping between available metabolite identifiers.
MetMask [53] (the metabolite masking tool) is an application that integrates reference chemical libraries and external public databases, building from these a local database that contains groups of identifiers. The primary identifiers and their connections with other public databases are extracted from the external databases. The collected data is
used to merge groups that are considered compatible by the heuristics implemented in the application. These heuristics include the use of rules that restrict the inclusion of identifiers in the group, depending for instance, if this is coming from the same source. This application allows to import other data, which can increase the accuracy of the merge. The result of the search by identifier can be seen in a graph format.
The Chemical Translation Service [54] (CTS) is a web-based tool to map identical chemical identifiers. It aggregates multiple external sources in a single database where the main identifier is the International Chemical Identifier (InChI) code Hash Key. The InChI is a textual identifier to define a chemical substances and it can encode molecular information, including structural data. Depending on the chemical molecule, the InChI can reach thousands of characters; this eventually is a problem for database searching. Additionally, an InChI contains non-alphanumeric characters, which may also be another problem for certain searching engines. To overcome this problem, the InChIKey is a twenty-seven-character code generated from the InChI hash algorithm that contains only regular characters; this identifier eases the search of information within databases. This tool finds all standard InChIKeys that are linked to an input identifier and returns all identifiers of the requested output type(s) that are linked to the same standard InChIKeys. The CTS consists in three major services: the Discovery Service (detects chemicals); the Convert Service (interconverts any chemical identifier into other chemical identifiers); the Batch Convert Service (converts multiple identifiers of the same type into multiple identifiers). This application is very useful, for instance, to detect doublets.
UniChem [55] is a web application available for free, for compound identifier mapping. It was designed to optimize the efficiency with which structure-based hyperlinks may be built and maintained between chemistry-based resources. It has some characteristics in common with the previous application (CTS) since it is also based on standard InChIs and InChIKeys to make the match of the identifiers. Furthermore, multiple external databases are also aggregated in a single database, where the queries are sent. In this case, before being integrated, the external databases go through quality tests, where, for instance, it is verified if an InChI pattern of an entry can be converted into an InChIKey
pattern. Moreover, UniChem preserves which database identifiers are associated with a certain InChI identifier [26].
The main purpose of these applications is to provide a tool to support the mapping of metabolite identifiers between distinct sources, which is a valuable utility in metabolic network reconstruction projects. Most of these tools cover a large set of the identifiers, although there is a poor match among databases.
The InChI based applications were considered the best approach for the mapping [26]. In particular, CTS showed a better capability to map identifiers. Despite this, the task to annotate these identifiers still remains laborious, since the automatic updating of the metabolite identifiers in metabolic network reconstructions is not yet possible. Although these applications help supplement information relating to metabolites, it is not sufficient for a complete and correct unification of all of the information present in a GSMM. A more sophisticated pipeline for the integration of metabolites and biochemical reactions still remains a challenge.
Parallel to these tools there are also a few databases that integrate several metabolic sources. The BKM-react (BRENDA-KEGG-MetaCyc-reactions) [56] is a comprehensive non-redundant biochemical reaction database containing both enzyme-catalysed and spontaneous reactions. Biochemical reactions collected from BRENDA, KEGG and MetaCyc were matched and integrated by aligning substrates and products. The reaction comparisons follow two steps: the comparison of reactant structures using InChIs and the compound name comparison (including synonyms). The result of a query is the display of all aligned reactions for all databases in comparison. BKM-react can significantly facilitate and accelerate the construction of accurate biochemical models. MetaNetX is a user-friendly and self-explanatory website for accessing, analysing and manipulating GSMMs as well as biochemical pathways [57]. It consistently integrates data from various public resources (models, metabolic pathways, etc.) in a single repository. All repository or user uploaded models are automatically reconciled in a common namespace defined by MNXref [58]. MNXref uses information on cellular compartments, reactions, and metabolites that is sourced from a number of external
resources. Consequently, for each entity mentioned, it indicates which external resource provided the information used in MNXref.
MetaNetX, which allows an exhaustive analysis of any model, is a user-friendly tool that can be useful when establishing a comparison between models. In addition, two or more GSMMs or pathways can be compared to determine shared parts. It is also possible to create new models based on the analysis and modification of existing models. For instance, MetaNetX can be used to increase/update a model. Information concerning the models, as well as results of analyses performed on them, is provided in the form of tables.
MetRxn [59] is a knowledge base that includes standardized metabolite and reaction descriptions by integrating information from databases and genome-scale metabolic models into a single unified data set. This approach is identical to the aforementioned MetaNetX, however the methods used are different, which leads to different results. For instance, while MNXref provides a single reconciliation based on heuristic merging of stereoisomers, MetRxn provides two reconciliations in which stereoisomers are considered separately or as a single entity [58]. This affects, for instance, the final number of unique reactions. Furthermore, the MetRxn is much more limited in terms of analysis and comparison of the models.
Among these, the MetaNetX reveals itself, at the moment, as the best tool for the study and comparison of models.
19 3 Chapter 3
Chapter 3
Graph Databases for Metabolic Data
Integration
This work emerged from the urgent need to create tools with the capability to compare metabolic models, with the focus on human GSMMs. The integration of these models implies a detailed examination of the components found in these models (i.e., species, reactions, etc.). Therefore, it is necessary to integrate existing databases of biochemical information with the human GSMMs. This will provide a more detailed information for the entities, to clarify cases of ambiguity and to standardize the annotation. In order to assist this integration, an approach based in graph databases is used. This chapter briefly describes graph databases and their use for metabolic data integration, in a tool previously developed in the host research group.
3.1 Graph Databases
Graph databases are based on graph structures. A graph is defined as a set of vertices (or nodes) and a set of edges (or relationships) connecting the vertices. The edges can be directed or undirected depending of the type of graphs. To summarise, a graph system allows to show how certain entities are related.
Connected entities (or nodes) are contained within a graph database, each of which is constituted by a set of outgoing edges and / or incoming edges and a set of properties (key-value-pairs), where one of them is a unique identifier. These nodes can be labelled with one or more labels that identify its role in context. In turn, a relationship (or edge) has two nodes (a start node and an end node), a direction, a type, and can also have a set of properties.
The use of a graph database may be advantageous versus a relational database, since it is not necessary to make an extensive entity-relationship study of the domain to define a database schema. Because, in graph databases, anything can connect to anything, future changes can be easily applied. This flexibility also means fewer migrations. Furthermore, in certain types of operations (e.g., extensive and recursive join operations) they are much faster [60], allowing to scale with large data sets more naturally, given that only part of the graph is traversed to obtain the result of a query. Thus, when querying highly related data, a graph database can be many folds faster than a relational database.
Graph databases engines also operate with Create, Read, Update, and Delete operations (CRUD). Some databases are able to operate under non-native engine (i.e., third party storage engines). However, with the use of the non-native graph storage, the graph database becomes a query mediator that translates graph query languages to the non-native storage engine. In these cases, the query engines have to make more computational effort. This happens because non-native graph storage typically depends on a mature non-graph backend (such as MySQL), while native graph storage is optimized and designed for storing and managing graphs.
3.2 Neo4j
Neo4j [61] is an open-source NoSQL graph database implemented in Java and Scala. It is a high performance graph store with all the features expected from a mature and robust database, such as, with a proper query language and ACID (Atomicity, Consistency, Isolation, and Durability) transactions. Through atomicity, it is guaranteed that, if a
transaction fails, the database remains unchanged. Changes made in the database have to respect its integrity, thus maintaining consistency. The isolation of the parallel transactions prevents transactions from interfering with each other. The results of a committed transaction stay available permanently, thus making graph databases durable and is quite reliable.
Neo4j provides native graph storage that enables its engine to perform native graph processing. Therefore, defining the relationships at runtime time have minimal impact in the performance of the queries.
Cypher is a declarative graph query language, specific to Neo4j. It is focused in the clarity of their queries, being its language based on iconography and English prose. Although it is a simple language, it is nonetheless powerful, allowing both simple and complex queries to be easily expressed. Knowing that "( )" represent the nodes and "[ ]" the relationships, it is easy, at a first sight, to write and interpret a relatively easy query. This proximity with graphical representation makes it extremely intuitive.
Neo4j is implemented on top of the JVM (Java Virtual Machine), and can be easily accessed by either a RESTful1 HTTP2 API3 or Java API. It has support for several other programming languages (e.g., python, ruby, etc.) and platforms (e.g., node.js), not being required for the user to have an extensive knowledge of the server and the resources it hosts in advance.
1 REpresentational State Transfer 2 Hypertext Transfer Protocol 3 Application Programming Interface
Furthermore, it is also possible to query and visualize the data (example in Figure 3.1), through a Web application (the Neo4j Browser). Here, the graph can be visually explored, providing the possibility to see properties of the entities by a simple click on a node or a relationship. It is also possible to expand connected nodes with the interface. This graph visualization tool provided by the database allows a more intuitive perception and analysis of the data. All these features enable the development and analysis of big network structures.
In the Neo4j graph database, as expected, each graph is constituted by many nodes that can be related unidirectionally. It is mandatory that each node has a label that says what it represents. Moreover, Neo4j allows the addition of more than one label to a node, since this can fulfil several different roles. Using labels it is possible to bundle nodes, which facilitates the queries. The relationships can also have labels that tell which way a certain node can relate with another. Both nodes and relationships may be established by properties that are, just as it sounds, the properties of the node, meaning that they keep the relevant information about every node.
3.3 A graph database for metabolic data
integration
As a basis for this work, an existing metabolic data integration system was used to aid the integration tasks (http://darwin.di.uminho.pt/biodb/). This system loaded information from several databases of compounds and reactions in a single unified Neo4j graph database (Table 3.1). This database is the central storage to catalogue biochemical entities for analysis and integration purposes. Parallel to this database, it also provides an integrated database that integrates the instances from the central storage based on several rules and axioms.
Table 3.1 - Number of metabolites (first part) and reactions (second part) in the unified database.
Database Records Version
KEGG (Compound) 17909 Release 68.0 (October 1, 2013) KEGG (Glycan) 10988 Release 68.0 (October 1, 2013)
KEGG (Drug) 10126 Release 68.0 (October 1, 2013)
MetaCyc 15983 Release 17.5
BiGG 2835 Schellenberger et al. (2010)
SEED 16996 Aziz et al. (2013)
ChEBI 81231 Release 110 (December 2, 2013)
KEGG 9886 Release 68.0 (October 1, 2013)
MetaCyc 12264 Release 17.5
BiGG 7135 Schellenberger et al. (2010)
SEED 13246 Aziz et al. (2013)
The system has two levels: a first level loads information from each data source in a unified resource. The second level, the integrated database fuses instances from the unified database by creating clusters of metabolic instances. These instances are potential compounds or reactions that are considered as equivalent (i.e., the same molecule or the same reaction).
Since it is a Neo4j database, it is possible to query and visualize the data from the Web platform. This feature is very useful because it allows an intuitive analysis of the references of the properties connected among species. When a species is missing a reference, it is necessary to find at least one reference to identify it. In this graph database, each instance of a compound of a biochemical database (e.g., KEGG, MetaCyc, etc.) is a distinct node. These nodes are connected by their related properties, as well as other identifiers from other databases. Therefore, it is possible to traverse the graph through the properties (of a specie) to identify the references that are related to each other.
3.3.1
Database Structure
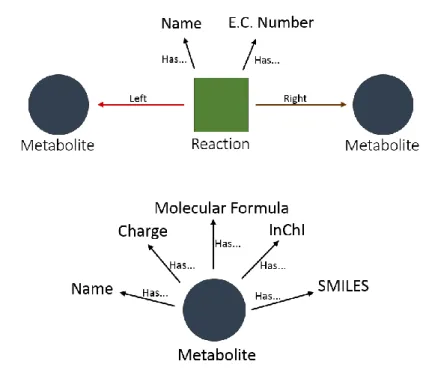
The unified schema is similar to an ontology, with entities, classes and relationships. Ontologies allow for organizing and giving structure to information, enabling computers to reason about the data. The objects in an ontology are characterized by a class hierarchy and are related to each other by relationships. This relationship usually follows the subject-predicate-object triple (e.g., CoA has_formula C21H36N7O16P3S). The Metabolite and the Reaction are the top classes of the database, since they are the core entities of this domain (Figure 3.3). Then, they are extended by several sub-classes, that are specific to other biochemical database instances (e.g., <Metabolite, ChEBI>, <Metabolite, LigandCompoud>, etc.). Both Reaction and Compound are considered an entity class.
The primary attributes (Table 3.2) are represented as property classes (e.g., Molecular Formula, Name, InChI, etc.). However, due to the diversity of properties between instances, lesser popular attributes are considered secondary properties, and these are stored as attributes of the entities.
Table 3.2 - Primary properties of the metabolites. KEGG instances with Mol structures have computed (*) InChI and SMILES.
Finally, a set of relationships is declared to specify how classes interact between each other (Figure 3.2). Among the variety of possible relationships, the most relevant is the property attribution with the relationship has_<property name> that connects an entity object with a property object. Related entities may also be connected with each other with the has_crossreference relationship. This relationship usually indicates that they are strong candidates for entity fusion. Apart from the identity relationship, the hierarchy between compounds is established with instance_of/super
relationship (e.g., META:ETOH instanse_of META:Primary-Alcohols). Finally, reaction entities are related to metabolites with the left/right relationship to describe stoichiometry.
Synonyms Formula Charge Mol InChI SMILES
KEGG (Compound) Yes Yes No Yes No * No *
KEGG (Glycan) Yes Yes No No No No
KEGG (Drug) Yes Yes No Yes No * No *
MetaCyc Yes Yes Yes No Yes Yes
BiGG No Yes Yes No No No
SEED Yes Yes Yes No No No
ChEBI Yes Yes Yes Yes Yes Yes
ChEBI
Formula
Name InChI
KEGG has_crossreference_to has_name
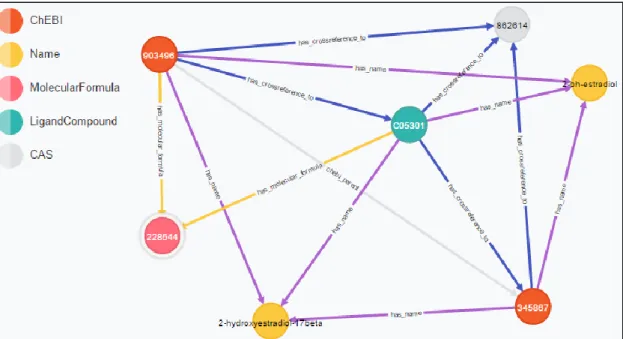
Figure 3.2 - Representative scheme of a part of the graph visualization, in the Neo4j platform.
In the Neo4j graph environment, the classes are nodes, while relationships are edges between nodes, this implies that nodes are both properties (i.e., names, formulas, etc.) and entities (i.e., a specific KEGG compound, a reaction).
Figure 3.3 - Organization of unified graph database. a) Reaction schema. Each reaction is connected to its reactants and products (left or right). It has Name and E.C. Number. b) Each metabolite is composed of Name, Charge, Molecular Formula, InChI, SMILES (Simplified Molecular Input Line Entry System).
27
3.3.2
Populating the Database: ETL
The unified graph database is populated by a pipeline similar to other Extract, Transform and Load (ETL) systems. An ETL tool is based on three core tasks:
Extract, where in a set of heterogeneous data sources (i.e. KEGG, ChEBI, BiGG [62], etc.) are loaded. The main role of this task is to read the data from the source and convert into a standard format. This is highly dependent on the type of data source.
Transform, where the transformation of those data, for the structure that unifies them (unification schema), occurs. The transformation task converts to the graph data format. This involves identification of the classes and relationships required by the instance to be loaded into the unified database.
Load, where the data is loaded into the unified database.
Besides these three stages, to secure a robust ETL pipeline, it is necessary to complement it with several additional subsystems. These subsystems are related to a variety of tasks that are relevant to an integration system, such as logging, backup, quality check and many more. Within these roles, a few were chosen to be implemented based on their relevance to solve the inherent problem. A quality screening handler is based on systematically applied tests to checking of issues regarding to the quality of data. These can be invalid descriptors of attributes such as invalid chemical formulas, unidentified references. Within this data context, molecular formulas must be subject to a normalization process (since equal molecular formulas can be written in different ways, e.g. CHO, C1H1O1, and OCH).
The addition of a new data source involves an analysis of the data type, made by the data profiling system. This analysis assists the data conformer in the purpose of “translating” data to a unified version.
In addition to these subsystems, an ETL system requires a data storage system in which it serves as an intermediate store to support the process. Depending of the heterogeneity of the sources, the design process of this component is usually time
consuming and prone to future changes. Graph database entities are represented by generic vertices annotated by properties to provide some identity to these. Then, relationships are created by connecting these vertices with edges. Therefore, it is possible to represent a flexible schema since everything can relate to anything.
3.3.3
Integration Algorithms
The metabolites of the global database were integrated based on their properties and attributes. The selection of these was based on the necessity and the scope. Take, for instance, the InChI property which is commonly referred in the literature as the best descriptor for biochemical molecules, due to its unique and unambiguous representation. However, integration with InChI will only apply to a few molecules that have an InChI descriptor. Thus, other properties less viable are needed to increase the scope.
The InChI Key is used to discard the protonation state of the molecules. The InChI Key is a 25 letter hash key (XXXXXXXXXXXXXX-YYYYYYYYFV-P), having the first block of 14 letters to encode the structure of the molecule, the second block to encode the stereo structure and last three characters to encode meta information, the standard InChI flag, the version, and lastly the protonation. By discarding the last character that encodes protonation, it is possible to capture molecules independent of their protonation state. A limitation to this strategy is that unlike InChI the InChI Key is not unique, however this happens only in rare occasions were hash collisions occur.
Important properties are the ChEBI parent relationships. Some ChEBI entities are related to each other by a chebi_parent relationship. This, allows to fuse internal replicas among ChEBI instances. The KEGG remark attribute is also used. In many cases the remark attribute of KEGG instances has a “Same as:” notification (e.g., Same as: C06217). The integration exploits this attribute to recover a few entities that are replicas between the KEGG Compound, Glycan and Drug databases.
The cross-references were also used since many compounds lack proper descriptors to determine the identity of the metabolites. Also, the cross-referencing is in fact the largest contributor to resolve metabolites.
Each of the methods generates an independent set of metabolite clusters, and later after evaluation, they are merged together to create the master integration set. To summarize, five methods were combined together: the InChI, the InChIKey, ChEBI parent references, KEGG remark attribute, and cross-references. A total of 22.001 metabolite clusters were created using those strategies.
While the reconciliation of metabolites relies essentially on the attributes (e.g., chemical structures, names, molecular formula), the reaction instances offers a very limited set attributes.
Some databases have a name for certain reactions, usually a popular name, but perhaps the most relevant attribute related to reactions is the Enzyme Commission Number (EC). A problem of this classification method is the ambiguity of a few numbers, as example the EC 1.1.1.1 which represents the role of an alcohol dehydrogenase is valid for every reaction that acts on a primary alcohol to produce an aldehyde, a simple query with this EC number in KEGG would result in several reactions. Therefore, a single EC number may span to multiple stoichiometry.
The integration of reactions relies on a different method. The comparison of the stoichiometry between reactions allows precisely to identify replicas among reaction instances.
As an example, the following reactions from KEGG and MetaCyc:
𝑟1∶ 𝐶00631 ↔ 𝐶00074 + 𝐶00001 ( 3.1 )
𝑟2 : 2 − 𝑃𝐺 ↔ 𝑃𝐻𝑂𝑆𝑃𝐻𝑂 − 𝐸𝑁𝑂𝐿 − 𝑃𝑌𝑅𝑈𝑉𝐴𝑇𝐸 + 𝑊𝐴𝑇𝐸𝑅 ( 3.2 )
The identity of the species plays an important role in the identity of the reactions. If species in the first reaction are equal to the ones in the second, then the two reactions can be safely assumed as identical.