BioMedCentral
Page 1 of 12
(page number not for citation purposes)
Proteome Science
Open Access
Research
Trypanosoma cruzi
alkaline 2-DE: Optimization and application to
comparative proteome analysis of flagellate life stages
Adriana D Magalhães
1, Sébastien Charneau
1, Jaime Paba
1,4,
Rafael AP Guércio
1, Antonio RL Teixeira
2, Jaime M Santana
3,
Marcelo V Sousa
1and Carlos AO Ricart*
1Address: 1Laboratory of Biochemistry and Protein Chemistry, Department of Cell Biology, University of Brasília, 70910-900, Brazil, 2Chagas
Disease Multidisciplinary Research Laboratory, Faculty of Medicine, University of Brasília, 70910-900, Brazil, 3Laboratory of Parasite-host
Interaction, Department of Cell Biology and Faculty of Medicine, University of Brasília, 70910-900, Brazil and 4Department of Biochemistry,
Federal University of Paraná, Curitiba, Brazil
Email: Adriana D Magalhães - [email protected]; Sébastien Charneau - [email protected]; Jaime Paba - [email protected]; Rafael AP Guércio - [email protected]; Antonio RL Teixeira - [email protected]; Jaime M Santana - [email protected];
Marcelo V Sousa - [email protected]; Carlos AO Ricart* - [email protected] * Corresponding author
Abstract
Background: Trypanosoma cruzi, a flagellate protozoan, is the etiological agent of Chagas disease, a chronic illness that causes irreversible damage to heart and digestive tract in humans. Previous 2-DE analyses of T. cruzi proteome have not focused on basic proteins, possibly because of inherent difficulties for optimizing 2-DE in the alkaline pH range. However, T. cruzi wide pH range 2-DE gels have shown few visible spots in the alkaline region, indicating that the parasite either did not have an appreciable amount of alkaline proteins or that these proteins were underrepresented in the 2-DE gels.
Results: Different IEF conditions using 6–11 pH gradient strips were tested for separation of T. cruzi
alkaline proteins. The optimized methodology described here was performed using anodic "paper bridge" sample loading supplemented by increased concentration of DTT and Triton X-100 on Multiphor II (GE Healthcare) equipment and an electrode pad embedded in DTT- containing solution near the cathode in order to avoid depletion of reducing agent during IEF. Landmark proteins were identified by peptide mass fingerprinting allowing the production of an epimastigote 2-DE map. Most identified proteins corresponded to metabolic enzymes, especially those related to amino acid metabolism. The optimized 2-DE protocol was applied in combination with the "two-in-one gel" method to verify the relative expression of the identified proteins between samples from epimastigote and trypomastigote life stages.
Conclusion: High resolution 2-DE gels of T. cruzi life forms were achieved using the optimized methodology and a partial epimastigote alkaline 2-DE map was built. Among 700 protein spots detected, 422 were alkaline with a pI above 7.0. The "two-in-one gel" method simplified the comparative analysis between T. cruzi life stages since it minimized variations in spot migration and silver-stained spot volumes. The comparative data were in agreement with biological traits of T. cruzi life forms and also corroborated previous T. cruzi proteomic studies. For instance, enzymes related to amino acid metabolism and dehydrogenases were more abundant in epimastigote 2-DE gel whilst trans-sialidase and a paraflagellar protein were found specifically in the trypomastigote 2-DE profile.
Published: 8 September 2008
Proteome Science 2008, 6:24 doi:10.1186/1477-5956-6-24
Received: 9 May 2008 Accepted: 8 September 2008
This article is available from: http://www.proteomesci.com/content/6/1/24
© 2008 Magalhães et al; licensee BioMed Central Ltd.
Proteome Science 2008, 6:24 http://www.proteomesci.com/content/6/1/24
Page 2 of 12
(page number not for citation purposes)
Background
Trypanosoma cruzi, a flagellate kinetoplastid protozoan, is
the etiological agent of Chagas disease, a chronic illness that causes irreversible damage to heart and digestive tract in humans. Chagas disease remains as a serious problem in Latin America where approximately 17 million people are infected [1]. The drugs currently used for its chemo-prophylactic treatment are highly toxic and present varia-ble efficacy [2] whilst vaccines against the parasite are not available yet.
T. cruzi life cycle occurs inside both bloodsucking
triatom-ine insect vectors and mammalian hosts. During its life cycle, the parasite differentiates into four stages: epimas-tigote and metacyclic trypomasepimas-tigote in the insect vector, and bloodstream trypomastigote and amastigote inside the mammalian host. It has been assumed that the biolog-ical features of each trypanosome developmental stage were shaped by changes in protein expression during its life cycle. These features have led to proteomic analysis of the parasite using different strategies such as two-dimen-sional gel electrophoresis coupled to mass spectrometry (2-DE-MS) [3,4] and isotope coded affinity tagging (ICAT) [5] even before the T. cruzi genome sequence was published [6].
It appears that proteomic approaches have advantages over nucleic acid based strategies for the study of differen-tial gene expression in trypanosomatides since their gene regulation is mostly post-transcriptional, through control of mRNA stability and translation efficiency. Conse-quently, there is not a good correlation between mRNA and protein levels [7,8].
More recently, the Multidimensional Protein Identifica-tion Technology (MUDPIT) was used to identify 2784 proteins from the four T. cruzi life forms. Although the T.
cruzi genome sequence was available, several proteins
were identified by cross-species homology and remain putative [9]. It was previously shown that the number of proteins identified by shotgun protein sequencing meth-ods is higher than that usually achieved by 2-DE-MS based proteomics [10]. On the other hand, the use of 2-DE-MS approach appears to bear important advantages over high throughput proteomic strategies (such as MUDPIT) that hydrolyze the proteins into peptides before chromato-graphic separation and identification. Since 2-DE permits the separation and the visualization of intact polypep-tides, it handles better situations dealing with quantitative and qualitative changes of modified proteins during the biological process time course [10] as reported for amasti-gogenesis [3] and metacyclogenesis [11] differentiation processes in T. cruzi.
Obviously, the collection of proteomic techniques pres-ently available should be used in complementary way. Finally, it must be said that the T. cruzi proteome charac-terization is far from complete considering that the pro-teome is a very dynamic entity that will change in response to organism life stage or breed and environmen-tal conditions.
So far, reports on 2-DE analysis of T. cruzi proteome have not focused on basic polypeptides, possibly because of inherent difficulties for optimizing 2-DE conditions in the alkaline pH range. Oddly, previous reports have shown that T. cruzi wide range pH (3–10) gradient gels displayed few spots in the alkaline region [3,4] indicating that the parasite either did not have an appreciable amount of alkaline proteins or that these proteins were underrepre-sented in the 2-DE gels.
In the present article we show an optimized and reproduc-ible protocol for the 2-DE of T. cruzi proteins in the 6–11 pH range. Landmark proteins were identified by peptide mass fingerprinting allowing the production of an epi-mastigote 2-DE map. Additionally, the "two-in-one gel" technique [12] was applied to determine the relative expression of the identified proteins between epimastig-ote and trypomastigepimastig-ote life forms
Results and discussion
Optimization of T. cruzi alkaline 2-DE
T. cruzi proteome maps in the restricted alkaline pH range
have not been reported yet. However, previous attempts to separate T. cruzi proteins using wide pH range (3–10) 2-DE gels produced profiles with few visible spots in the alkaline region besides severe horizontal streaking prob-lems [3,4]. Those wide range 2-DE profiles indicated that the concentration of trypanosome basic proteins was lower than the acidic ones. However, it is very likely that the alkaline polypeptides comprise a group at least as numerous as the acidic set. It has been previously shown for several organisms that the theoretical distribution of protein pI in whole proteomes is usually bimodal with very low fractions of proteins close to pH 7.4 [13,14]. Vir-tual 2-DE gels (plot of the calculated pI values against the calculated molecular masses of the proteins) were built for proteomes of the protozoan parasites Leishmania major
and T. brucei, that belong to the same family
Proteome Science 2008, 6:24 http://www.proteomesci.com/content/6/1/24
Page 3 of 12
(page number not for citation purposes)
In the present work, we aimed at obtaining a T. cruzi high resolution alkaline 2-DE map. Difficulties in getting suit-able alkaline 2-DE maps are due to a combination of fac-tors including depletion of charged reducing agents such as DTT in the high pH range of the IPG strip and reverse electroendosmotic flow that occurs during IEF [17]. In order to minimize these effects, we tested different exper-imental conditions in the 6–11 pH range.
T. cruzi epimastigote life stage was used for optimization
due to the relative facility to culture it in large scale. Using this parasite stage, we have observed that the intensity of spots in the alkaline region was visually lower than in the acid pH range. Therefore, we introduced the first relevant protocol modification by increasing the protein loading in the 6–11 IPG strip to twice the amount previously loaded in 4–7 pH range 2-DE gels [3]. We tested several
IEF methods using epimastigote protein extracts and the most representative of them are detailed in Table 1.
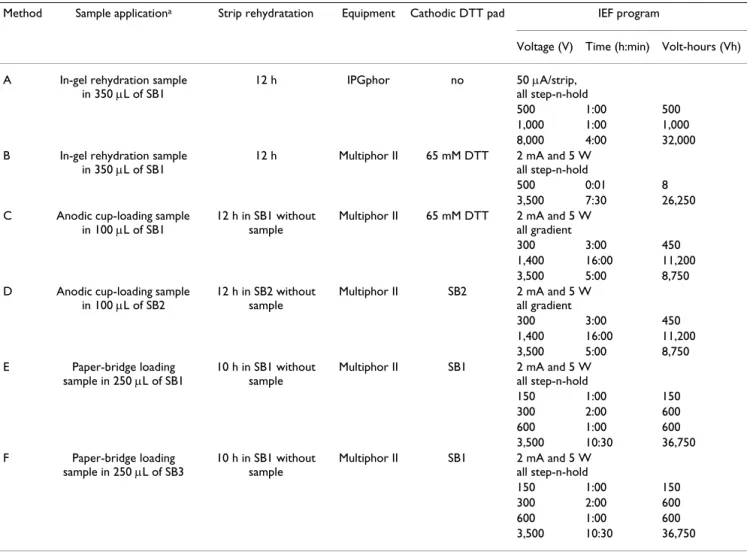
The assessed methods differed according to the type of IEF equipment, sample buffer composition, sample applica-tion method, voltage condiapplica-tions and prevenapplica-tion of DTT depletion. In all protocols isopropanol (10% v/v) was used in the sample buffer to minimize electroendosmotic flow as previously described [18].
Method A made use of the IPGphor equipment (GE Healthcare) and followed the manufacturer's instructions for 6–11 pH range. IPGphor has advantages over Multi-phor II (GE Healthcare), another equipment routinely used in our laboratory, since it permits a single applica-tion step for in-gel rehydraapplica-tion/focusing and allows shorter runs due to higher voltages. Previous studies have
Table 1: Methods tested for alkaline IEF of T. cruzi proteins
Method Sample applicationa Strip rehydratation Equipment Cathodic DTT pad IEF program
Voltage (V) Time (h:min) Volt-hours (Vh)
A In-gel rehydration sample in 350 μL of SB1
12 h IPGphor no 50 μA/strip, all step-n-hold
500 1:00 500
1,000 1:00 1,000 8,000 4:00 32,000 B In-gel rehydration sample
in 350 μL of SB1
12 h Multiphor II 65 mM DTT 2 mA and 5 W all step-n-hold
500 0:01 8
3,500 7:30 26,250 C Anodic cup-loading sample
in 100 μL of SB1
12 h in SB1 without sample
Multiphor II 65 mM DTT 2 mA and 5 W all gradient
300 3:00 450
1,400 16:00 11,200 3,500 5:00 8,750 D Anodic cup-loading sample
in 100 μL of SB2
12 h in SB2 without sample
Multiphor II SB2 2 mA and 5 W all gradient
300 3:00 450
1,400 16:00 11,200 3,500 5:00 8,750 E Paper-bridge loading
sample in 250 μL of SB1
10 h in SB1 without sample
Multiphor II SB1 2 mA and 5 W all step-n-hold
150 1:00 150
300 2:00 600
600 1:00 600
3,500 10:30 36,750 F Paper-bridge loading
sample in 250 μL of SB3
10 h in SB1 without sample
Multiphor II SB1 2 mA and 5 W all step-n-hold
150 1:00 150
300 2:00 600
600 1:00 600
3,500 10:30 36,750
a 500 μg protein was applied in 6–11 linear IPG strips, 18 cm, at 20°C
SB1 = 2-DE sample buffer 1 (7 M urea, 2 M thiourea, 0.5% IPG buffer 6–11, 65 mM DTT, 2% Triton X-100, 10% isopropanol and bromophenol blue)
SB2 = 2-DE sample buffer 2 (7 M urea, 2 M thiourea, 0.5% IPG buffer 6–11, 1.2% DeStreak, 2% Triton X-100 and bromophenol blue)
Proteome Science 2008, 6:24 http://www.proteomesci.com/content/6/1/24
Page 4 of 12
(page number not for citation purposes)
also shown improved sample entry with the IPGphor, although there are conflicting reports about this matter in the literature [19].
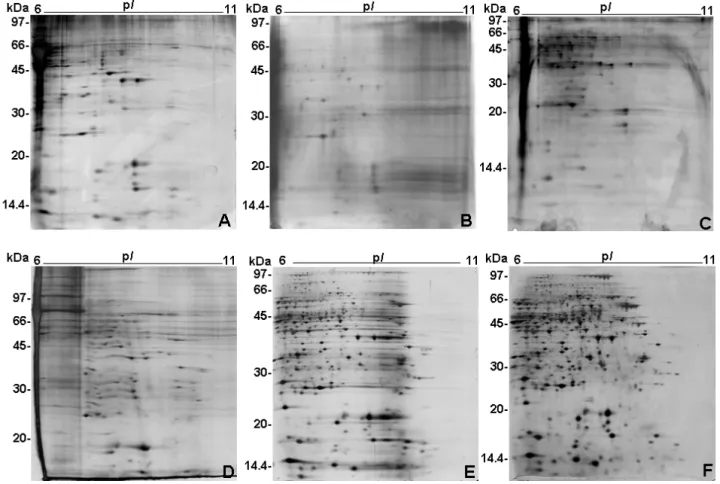
Fig. 1A presents the 2-DE profile resolved by method A, showing few intense silver stained spots and mild hori-zontal streaking, specially in the high apparent molecular mass region.
Despite the above arguments, Multiphor II was also used to check whether the separation could be improved using a different IEF equipment. As mentioned, Multiphor II uses lower maximal voltages (3,500 V) than IPGphor (8,000 V) and consequently produces longer runs. As in method A, the sample loading in method B was done by in gel rehydration. The resulting 2-DE profile using method B presented in Fig. 1B showed a profile with much less intense spots and accentuated streaking in the more basic region.
Methods A and B used "in gel rehydration" for sample application, thus the IPG strip was directly rehydrated with a solution that contained the sample [20]. Although in gel rehydration has become the method of choice for sample application, it has been noticed that in some cases better results could be achieved by applying the sample on the surface of the IPG gel using sample cups ("cup load-ing") [21]. In addition, streaking problems in 2-DE gels were possibly caused by depletion of DTT in the basic region. This depletion can be prevented by the use of an electrode paper pad at the cathode as source of DTT dur-ing focusdur-ing [22]. Therefore, method C made use of sam-ple-cup application near the anode and an electrode pad soaked in 2D sample buffer next to the cathode. In order to concentrate the sample proteins to a volume compati-ble to cup loading (100 μL), the sample was previously precipitated with TCA/acetone prior to IEF. Although the resulting 2-DE profile (Fig. 1C) showed that cup-loading provided higher spot resolution comparing to in gel rehy-dration (Fig. 1B) it was still not suitable for the produc-tion of a satisfactory proteome map.
Optimization of epimastigote alkaline 2-DE profiles
Figure 1
Proteome Science 2008, 6:24 http://www.proteomesci.com/content/6/1/24
Page 5 of 12
(page number not for citation purposes)
In method D, hydroxyethyl disulfide (DeStreak, GE Healthcare) was added to sample buffer (SB2, Table 1) instead of DTT. DeStreak was previously shown to prevent streaking in alkaline regions by means of oxidation of pro-tein thiol groups to mixed disulfides [23]. However, the presence of hydroxyethyl disulfide did not improve spot resolution in epimastigote alkaline 2-DE gels as shown in Fig. 1D.
Method E made use of "paper bridge loading" for sample application in IEF. Therefore, epimastigote proteins diluted in 250 μL of SB1 (Table 1) were applied to an arrow head paper electrode strip and positioned at the anodic end of the IPG strip as previously described [24]. Since "paper bridge loading" permits the application of higher sample volumes than cup loading, protein concen-tration with TCA/acetone was not necessary prior to IEF. The combination of "paper bridge loading" with higher total voltage (see Table 1) resulted in an improved 2-DE profile with approximately 480 well resolved spots, although still displaying streaking particularly in the basic end (Fig. 1E) which made difficult the detection of the most alkaline proteins.
Sample buffer composition was then modified (SB3, Table 1) by increasing DTT and Triton X-100 concentra-tions in order to decrease protein oxidation and precipita-tion respectively (method F, Table 1). The resulting 2-DE gel (Fig. 1F) displayed high spot resolution as well as a reproducible profile. 2-DE gels were run in triplicate using method F and then subjected to computational image analysis which permitted the detection of 700 silver-stained spots from 6–11 pH range with 422 alkaline sil-ver-stained proteins over pH 7.0 and thus the majority of spots (60.2%) are in the basic range.
Epimastigote 2-DE mapping
Landmark spots were chosen (Fig. 2) and subjected to trypsin digestion followed by peptide mass fingerprinting (PMF). The identified spots are listed in Table 2. Most of them corresponded to metabolic enzymes, especially those related to amino acid metabolism. A small GTP binding protein, cyclophilin A and heat shock proteins were also detected.
The statistical correlation between the theoretical and experimental Mr values (Pearson r = 0.984, P < 0.001) was higher than that of pI values (Pearson r = 0.852, P < 0.001) (see Additional file 1). The lower correlation between theoretical and experimental pI values is proba-bly due to post-translational modifications (PTMs) [25,26]. Discrepancies between theoretical and experi-mental pI values were previously observed in the trypano-somatide Leishmania major and were shown to be caused by PTMs, specially acetylation, N-terminal
pyroglutamyla-tion, N-terminal processing of methionine, deamidation and oxidation of tryptophan [27]. Previous T. cruzi pro-teome analyses have reported the detection of protein iso-forms in 2-DE gels, probably corresponding to different post-translational modifications [3,11].
Comparative analysis of epimastigote and trypomastigote 2-DE maps using "two-in-one gel"
Overall, we succeeded to produce a high resolution alka-line 2-DE map for the epimastigote life stage. Moreover, we applied the optimized method to other T. cruzi life stages resulting in well resolved and reproducible 2-DE profiles (data not shown).
The optimized alkaline 2-DE methodology was also applied to compare the relative expression of the identi-fied proteins in samples from the insect non-invasive motile life stage, epimastigote and the mammalian inva-sive motile stage, trypomastigote. For that, we used the "two-in-one gel" technique described elsewhere [12]. This technique minimizes variations in spot migration and intensity when two samples are compared by 2-DE, because both samples run in the same second dimension SDS-PAGE gel and are simultaneously stained. These fea-tures are especially advantageous for the comparison of silver stained 2-DE gels. Although very sensitive, silver staining is not an endpoint procedure, i.e. spot intensity depends on developing time. The use of "two-in-one gel" technique minimized this drawback since both epimastig-ote and trypomastigepimastig-ote prepimastig-oteins were present in the same gel and were consequently subjected to the same staining conditions, including developing time.
Proteome Science 2008, 6:24 http://www.proteomesci.com/content/6/1/24
Page 6 of 12
(page number not for citation purposes)
The results presented in Table 2 show the relative expres-sion (differential expresexpres-sion or stage specificity) of the identified spots in both T. cruzi stages. Among 29 land-mark spots identified from epimastigote 2-DE map (Fig. 2), 7 spots (1, 3, 4, 20, 25, 27 and 28) were not detected in trypomastigote gels (Fig. 3). In addition, other 4 spots displayed statistically significant differential expression between both 2-DE profiles. Thus, spots 5 and 12 were more intense in epimastigote and spots 2 and 6 in trypo-mastigote. Moreover, 3 trypomastigote-specific proteins (spots 30, 31 and 32) were identified as mentioned above.
The Krebs cycle enzyme citrate synthase (spot 2) showed higher expression in trypomastigote than in epimastigote gels. On the other hand, enzymes from amino acid metab-olism such as alanine aminotransferase (spot 1) and
L-threonine 3-dehydrogenase (spot 12) showed higher expression in epimastigote than in trypomastigote. These results are in agreement to what is known currently about
T. cruzi energetic metabolism. Epimastigote form which
lives in the insect gut obtain their energy from aminoacids such as L-proline and/or L-glutamine, the prominent con-stituent of insect hemolymph and tissue fluids [29]. Con-sequently, epimastigote relies on amino acid catabolism. On the other hand, the trypomastigote is present in the mammal host and uses glucose, which is abundant in host fluids, as carbon source [29].
Spots 3 and 4 were identified as T. cruzi dehydrogenases. These proteins are NAD(P)H flavin oxidoreductases that catalyze prostaglandin PGF2α synthesis in T. cruzi as well as reduction of some trypanocidal drugs. It was recently
Epimastigote alkaline 2-DE map
Figure 2
Prote
o
me Science
20
08,
6
:24
h
ttp
://w
ww.proteomesci.com/content/6/1/2
4
Pa
ge 7 of
1
2
(page nu
mber not
for
cit
a
ti
on pur
poses)
Table 2: T. cruzi identified proteins and differential expression analysis among epimastigote and trypomastigote stages
Spota Protein Accession No.
(NCBI)
MASCOT MW pI Expression E/T (SEM)h t-valuei Pj
Seq. covb (%) Scorec Exp (Theo)d Exp (Theo)d
1 Alanine aminotransferase
gi|71660439 16 76 55.7 (55.1) 6.2 (6.1) Ee - -
-2 Citrate synthase gi|71660323 13 76 53.6 (53.1) 8.0 (8.6) E<Tg 0.35 ± 0.09 -7.144 0.019
3 Dehydrogenase gi|61741948 35 116 43.5 (42.4) 6.0 (6.1) Ee - -
-4 Dehydrogenase gi|61741944 29 81 43.9 (42.6) 6.2 (6.0) Ee - -
-5 D-isomer specific 2-hidroxyacid dehydrogenase
gi|71420052 32 82 46.1 (38.8) 6.4 (6.0) E>Tg 3.81 ± 0.10 27.755 0.001
6 Cystathionine beta-synthase
gi|71425069 30 81 43.2 (42.8) 6.6 (6.4) E<Tg 0.24 ± 0.03 -24.786 0.002
7 2-amino-3-ketobutyrate coenzyme A ligase
gi|71650629 29 87 44.3 (44.0) 7.2 (6.7) E = Tf 2.58 ± 0.55 2.897 0.101
8 Aspartate aminotransferase, mitochondrial
g|71412236 22 87 43.3 (46.5) 7.7 (8.6) E = Tf 1.00 ± 0.21 0.015 0.989
9 Arginine kinase gi|71407949 23 76 41.8 (40.5) 6.1 (6.3) E = Tf 0.84 ± 0.10 -1.544 0.262
10 D-isomer specific 2-hidroxyacid dehydrogenase
gi|71420052 47 140 42.0 (38.8) 6.4 (6.4) E = Tf 5.97 ± 2.45 2.027 0.180
11 D-isomer specific 2-hidroxyacid dehydrogenase
gi|71420052 42 99 41.9 (38.8) 6.6 (6.0) E = Tf 1.77 ± 0.39 1.962 0.189
12 L-threonine 3-dehydrogenase
gi|71406160 29 103 40.5 (37.3) 6.9 (6.7) E>Tg 9.64 ± 1.65 5.228 0.035
13 Succinyl-CoA synthetase alpha subunit
gi|71667777 29 81 40.9 (32.3) 7.8 (8.4) E = Tf 0.91 ± 0.05 -1.762 0.220
14 Mitochondrial malate dehydrogenase
gi|71414199 47 114 38.3 (31.9) 8.1 (7.6) E = Tf 1.27 ± 0.13 2.022 0.181
15 Mitochondrial malate dehydrogenase
-Prote
o
me Science
20
08,
6
:24
h
ttp
://w
ww.proteomesci.com/content/6/1/2
4
Pa
ge 8 of
1
2
(page nu
mber not
for
cit
a
ti
on pur
poses)
16 Pyridoxal kinase gi|71413338 19 76 33.1 (33.6) 6.0 (6.0) E = Tf 4.10 ± 1.03 2.996 0.096
17 Tryparedoxin peroxidase
gi|17224953 44 101 27.8 (22.7) 6.3 (6.0) E = Tf 1.60 ± 0.51 1.173 0.361
18 Small GTP-binding protein
gi|71413249 30 76 26.2 (22.0) 7.2 (7.0) E = Tf 1.16 ± 0.34 0.479 0.679
19 Chain B, triosephosphate isomerase
gi|4389145 26 123 30.0 (27.4) 8.3 (8.6) E = Tf 0.64 ± 0.10 -3.543 0.071
20 Hypothetical protein gi|71414910 51 111 25.6 (21.5) 6.3 (6.9) Ee - -
-21 Peptide methionine sulfoxide reductase
gi|71405176 60 110 22.7 (20.2) 6.3 (6.1) E = Tf 4.10 ± 1.02 3.040 0.093
22 Cyclophilin A gi|71659715 34 85 21.1 (19.0) 7.8 (8.4) E = Tf 3.20 ± 1.52 1.448 0.285
23 Cyclophilin A gi|71659715 37 82 20.8 (19.0) 8.4 (8.4) E = Tf 1.28 ± 0.28 0.994 0.425
24 Cyclophilin A gi|71659715 41 80 19.3 (19.0) 8.6 (8.4) E = Tf 1.28 ± 0.26 1.071 0.396
25 Calpain-like cystein peptidase
gi|71407848 51 97 17.1 (15.1) 6.6 (6.4) Ee - -
-26 Nucleoside diphosphate kinase
gi|71667532 54 94 17.3 (17.0) 8.5 (8.5) E = Td 3.75 ± 2.04 1.346 0.311
27 20 kDa heat shock protein
gi|71418782 42 78 16.6 (16.0) 7.8 (7.8) Ee - -
-28 Hypothetical protein gi|71407758 52 104 16.0 (13.0) 7.7 (7.8) Ee - -
-29 10 kDa heat shock protein
gi|71410853 49 78 14.8 (10.7) 6.4 (8.0) E = Tf 1.67 ± 0.39 1.729 0.334
30 69 kDa Paraflagelar rod protein
gi|71650963 16 80 71.0 (70.1) 6.0 (5.9) Te - -
-31 Trans-sialidase gi|71409133 11 88 75.0 (81.4) 7.0 (8.4) Te - -
-32 Hypothetical protein gi|71651158 47 87 13.1 (16.4) 9.6 (9.0) Te - -
-aSpot numbers correspond to those indicated in Fig. 2 and Fig. 3
bPercentage of predicted protein sequence covered by matched peptides via Mascot cProbability Based Mowse Score of Mascot software
dTheoretical Mr and pI calculated from amino acid sequence eSpots specifically detected in epimastigote (E) or trypomastigote (T)
fProtein expression not statistically different between both life stages by t-test (p < 0.05)
gStatistically significant (t-test, p < 0.05) increased spot volume in epimastigote (E>T) and trypomastigote (E<T) hEpimastigote/trypomastigote (E/T) spot volume ratio with standard error of the mean (SEM)
iDecision value of the t-test
jProbability value that E/T ratio is different from 1 in a random event
Proteome Science 2008, 6:24 http://www.proteomesci.com/content/6/1/24
Page 9 of 12
(page number not for citation purposes)
shown for epimastigote that wild type T. cruzi displayed higher transcription level of this gene than parasite iso-lates with in vitro induced resistance to benznidazole, a drug used in the treatment of Chagas disease [30]. In our 2-DE experiments, NAD(P)H flavin oxidoreductases were present in epimastigote but not in trypomastigote, that confirms previous results using MUDPIT technology [9].
Although both epimastigote and trypomastigote are flag-ellate, the 69 kDa paraflagellar rod protein, a component
of T. cruzi flagellum, was detected only in the latter (spot
30). In fact, this spot was found in the acid end of the try-pomastigote 6–11 2-DE gel. It would be feasible that iso-forms of this protein could be found in epimastigote but in a more acid pH range. However, pH 4–7 pH 2-DE gels of epimastigote showed the absence of matching spots (data not shown) in the corresponding region where para-flagellar proteins were detected in trypomastigote 4–7 pH 2-DE gels [3]. The stage specificity of the 69 kDa paraflag-ellar rod protein verified here may indicate differences in the molecular composition between both T. cruzi life forms.
A calpain-like protein (spot 25) was detected in epimas-tigote but not in trypomasepimas-tigote. Calpains and
calpain-like proteins comprise a large family of genes in kineto-plastids. More than 20 gene sequences were found in T.
cruzi genome [31]. Accordingly, some members of this
family were previously shown to have higher expression in epimastigote than in trypomastigote [9].
Spot 31, detected in trypomastigote but not in epimastig-ote 2-DE gel, is a member of the trans-sialidase family. The
trans-sialidases are cell surface proteins responsible for the
incorporation of sialic acid from host cells into molecules present in the parasite membrane and play a role in immune evasion and host cell entry mechanisms [32]. The previous demonstration by MUDPIT analysis that
trans-sialidases are largely expressed in trypomastigote
and absent in epimastigote [9] validates the comparative approach used here.
Conclusion
Here we described the optimization of T. cruzi 2-DE in the alkaline pH range. The optimized protocol basically con-sisted on the use of anodic "paper bridge" sample loading on Multiphor II (GE Healthcare), the use of a DTT solu-tion embedded electrode pad near the cathode and increased concentrations of DTT and Triton X-100 in the sample buffer. The resulting epimastigote 2-DE gel
per-2-DE comparison between T. cruzi motile life forms using alkaline "two-in-one gel"
Figure 3
Proteome Science 2008, 6:24 http://www.proteomesci.com/content/6/1/24
Page 10 of 12
(page number not for citation purposes)
mitted the visualization of approximately 700 spots in the 6–11 pH range and over 400 spots above pI 7.0.
The "two-in-one gel" method, herein used for the compar-ison of epimastigote and trypomastigote 2-DE gels, mini-mized variations in spot migration that facilitate computational image analysis and also reduced spot vol-ume variance that is mostly due to the 2-DE second dimension and gel staining as recently demonstrated [33].
Preliminary comparative analysis of epimastigote and try-pomastigote 2-DE maps revealed differences in protein expression that are in agreement with their biological traits and also corroborated previous T. cruzi proteomic studies. Additional experiments using immunological approaches may be use to confirm the differential expres-sion of the proteins identified here as well as to determine their subcellular localization.
We expect that the approach used here can be applied in future to investigate the alkaline proteome of other T.
cruzi stages or isolates as well as in time course studies of
differentiation processes such as amastigogenesis and metacyclogenesis. It is also feasible to use the protocol to the study of alkaline proteomes from other trypanosoma-tides such as T. brucei and Leishmania spp.
Methods
In vitro T. cruzi culture
T. cruzi Berenice stock epimastigotes were grown at 28°C
in liver infusion tryptose (LIT) medium supplemented with 7.5% inactivated fetal bovine serum -FBS (Sorali Bio-tecnologia, Campo Grande, Brazil) [3]. Trypomastigotes were maintained in monolayer culture of murine L6 cells grown in DMEM medium supplemented with 7.5% (v/v) inactivated FBS, at 37°C, under 5% CO2 [3].
Protein solubilization
Epimastigote and trypomastigote cells were harvested by centrifugation (3,400 × g, 10 min, 4°C) and washed three times in Tris-Buffered Saline (TBS, pH 7.4). For each pellet of 1 × 10⁹ cells, 100 μL of 0.2% SDS were added. The
sam-ple was boiled for 5 min and then chilled in ice for 1 min in order to break cells and inactivate proteases [3]. A vol-ume of 100 μL of solubilization buffer (7.77 M urea, 2.22 M thiourea, 65 mM DTT, 2% Triton X-100) supplemented with Complete Mini Protease Inhibitor cocktail (Roche, Mannheim, Germany) was added to the lysate and imme-diately stored at -20°C. To minimize sample variability, for each parasitic form, protein extracts from five separate growths were mixed together resulting in a pooled protein sample that was used in further 2-DE analysis. The sample volume was completed with solubilization buffer to obtain a concentration of 1.0 × 10⁸ cells/ 100 μL. Both
epi-mastigote and trypoepi-mastigote pooled samples were
incu-bated under agitation for 1 h and centrifuged (12,000 × g, 15 min, 4°C), and the supernatants were stored at -20°C. Protein concentrations were quantified using the Plus One 2D Quant Kit (GE Healthcare, Uppsala, Sweden) according to manufacturer's instructions.
Two dimensional gel electrophoresis (2-DE)
Several alkaline IEF conditions were tested including equipment, sample buffer, sample application, running parameters and use of electrode paper pad embedded in 2-DE sample buffer as shown in Table 1. In all methods, samples were applied to 18 cm IPG strips with a linear separation range of pH 6–11 (GE Healthcare). Prior to 2-DE, extracts containing 500 μg of protein were diluted in the appropriate final volume of 2-DE sample buffer (SB1, SB2 or SB3, see Table 1), and incubated under agitation for 1 h and centrifuged at 12,000 × g, 10 min at room tem-perature.
Following IEF, the IPG strips were equilibrated for 40 min in a reducing solution (6 M urea, 30% (v/v) glycerol, 2% (w/v) SDS and 125 mM DTT) and for additional 40 min in a alkylating solution (6 M urea, 30% (v/v) glycerol, 2% (w/v) SDS and300 mM acrylamide) [34]. Before second dimension, the IPG strips were briefly rinsed with SDS-PAGE running buffer (25 mM Tris, 192 mM glycine, 0.1% (w/v) SDS). SDS-PAGE was performed on 12% T polyacr-ylamide gels run on a Protean II system (Bio-Rad, Her-cules, CA, USA) at 20°C. Proteins were visualized by silver staining as described elsewhere [35] and the gels were stored in 1% acetic acid before protein digestion.
To compare the epimastigote and trypomastigote alkaline 2-DE maps, "two-in-one gel" analysis was carried out as previously described [12]. Briefly, equal amounts of both samples were focused on separate IPG strips using the optimized method F (Table 1). The IPG strips were cut in the middle resulting in two halves corresponding to pH range 6–8.5 and 8.5–11 respectively. The strips bearing the same pH range were loaded side-by-side on top of a vertical SDS-PAGE gel for molecular mass separation. The "two-in-one" gels were then silver stained and stored in 1% acetic acid.
Image analysis
Silver stained gels were scanned (PowerLook 1120, Amer-sham Biosciences) at 300 dpi resolution and the digital-ized images were analyzed with Image Master Platinum software 5.0 (GE Healthcare) for spot detection, quantifi-cation and matching.
Statistical analysis
Proteome Science 2008, 6:24 http://www.proteomesci.com/content/6/1/24
Page 11 of 12
(page number not for citation purposes)
value for a given spot was equal to 1, it indicated that the protein was equally expressed in both life stages. The E/T ratio varied from 0 to 1 when trypomastigote value was higher, and between 1 to 8 when epimastigote value was higher.
Prior to one-sample t-test, Shapiro-Wilk test [28] was applied to E/T ratio to test the null hypothesis that the samples came from a normally distributed population. One-sample t-test was carried out using SPSS® 13 for
Win-dows® to determine if the mean E/T ratio of each spot was
statistically different from 1 (test value = 1), or in other words, if any spot had a statistically significant differential expression (p < 0.05) between the two trypanosome forms.
Peptide mass fingerprinting
Silver stained spots were excised, destained, in-gel digested with trypsin (Promega, Madison, USA) and extracted as previously described [3]. Briefly, the resulting peptide mixtures were analyzed in a MALDI-TOF mass spectrometer (Reflex IV, Bruker Daltonics, Karlsruhe, Ger-many). Each sample was concentrated and desalted with ZipTip C18 (Millipore, MA, USA), and eluted directly with matrix solution (20 mg/ml α-cyano-4-hydroxycinnamic acid in 0.1% TFA, 50% acetonitrile) onto the target plate prior to MALDI-TOF MS analysis as previously described [3]. Mass spectra were performed using X-TOF and Biotools software (Bruker Daltonics). Protein identifica-tion was performed using Mascot software http:// www.matrixscience.com. The searches were performed against NCBI non redundant database with 0.2 Da mass tolerance and protein mass restriction according to the observed for each spot in the gel. The search parameters were restricted to eukaryotes and allowed one missed cleavage, propionamidation of cysteine and oxidation of methionine (variable modification).
List of abbreviations
2-DE: two-dimensional gel electrophoresis; IEF: isoelec-tric focusing; MS: mass spectrometry; DTT: dithiotreitol; IPG: immobilized pH gradient; TCA: trichloroacetic acid; PMF: peptide mass fingerprinting; TBS: Tris-Buffered Saline; SB: 2-DE sample buffer.
Competing interests
The authors declare that they have no competing interests.
Authors' contributions
ADM optimized alkaline 2-DE, image analysis, "two-in one gel" and protein identification by PMF. SC performed "two-in one gel", protein identification by PMF and par-ticipated in the writing of the manuscript. JP optimized alkaline 2-DE and participated in the writing of the man-uscript. RAPG performed image analysis and protein
iden-tification by PMF. ARLT participated of T. cruzi cell culture and revised the final version of the manuscript. JMS par-ticipated of T. cruzi differentiation experiments and writ-ing of the manuscript. MVS participated of data analysis and preparation of the manuscript. CAOR was responsi-ble for experimental design, data analysis, coordination and preparation of the final version of the manuscript. All authors read and approved the final manuscript.
Additional material
Acknowledgements
We wish to thank Carlos E. Uribe Valencia for statistical analyses and Nuno M. Domingues and Rayner M. L. Queiroz for technical assistance. This investigation received financial support from the UNICEF/UNDP/World Bank/WHO Special Program for Research and Training in Tropical Dis-eases, from FINEP-Financiadora de Estudos e Projetos, Brazil, Fundação de Apoio à Pesquisa do Distrito Federal (FAPDF), Brazil and from Conselho Nacional de Desenvolvimento Científico e Tecnológico (CNPq), Brazil. A. D. Magalhães, Dr. S. Charneau and R. A. P. Guércio received fellowships from CNPq, Brazil.
References
1. Moncayo A: Chagas disease: current epidemiological trends after the interruption of vectorial and transfusional trans-mission in the Southern Cone countries. Mem Inst Oswaldo Cruz
2003, 98:577-591.
2. Urbina JA, Docampo R: Specific chemotherapy of Chagas dis-ease: controversies and advances. Trends Parasitol 2003,
19:495-501.
3. Paba J, Santana JM, Teixeira ARL, Fontes W, Sousa MV, Ricart CAO:
Proteomic analysis of the human pathogen Trypanosoma cruzi. Proteomics 2004, 4:1052-1059.
4. Parodi-Talice A, Duran R, Arrambide N, Prieto V, Pineyro MD, Pritsch O, Cayota A, Cervenansky C, Robello C: Proteome analy-sis of the causative agent of Chagas disease: Trypanosoma cruzi. Int J Parasitol 2004, 34:881-886.
5. Paba J, Ricart CAO, Fontes W, Santana JM, Teixeira ARL, Marchese J, Williamson B, Hunt T, Karger BL, Sousa MV: Proteomic analysis of Trypanosoma cruzi developmental stages using isotope-coded affinity tag reagents. J Proteome Res 2004, 3:517-524.
Additional file 1
Correlation between experimentally determined and theoretical Mr (A) and pI (B) values of identified protein spots from T. cruzi 2-DE gels. The correlation values were: Pearson r = 0.984, P < 0.001 for Mr and pI Pear-son r = 0.852, P < 0.001 for pI values.
Click here for file
[http://www.biomedcentral.com/content/supplementary/1477-5956-6-24-S1.doc]
Additional file 2
In order to test if the E/T values were normally distributed we applied the Shapiro-Wilk test. If p > 0.05 the hypothesis of the non-normality of the sample distribution can be rejected. Spots that are not shown in the table bellow appear only in one parasite life form. The results showed that all samples presented normal distribution and could be analyzed by the Stu-dent's t-data.
Click here for file
Publish with BioMed Central and every scientist can read your work free of charge
"BioMed Central will be the most significant development for disseminating the results of biomedical researc h in our lifetime."
Sir Paul Nurse, Cancer Research UK
Your research papers will be:
available free of charge to the entire biomedical community
peer reviewed and published immediately upon acceptance
cited in PubMed and archived on PubMed Central
yours — you keep the copyright
Submit your manuscript here:
http://www.biomedcentral.com/info/publishing_adv.asp
BioMedcentral
Proteome Science 2008, 6:24 http://www.proteomesci.com/content/6/1/24
Page 12 of 12
(page number not for citation purposes) 6. El-Sayed NM, Myler PJ, Bartholomeu DC, Nilsson D, Aggarwal G,
Tran AN, Ghedin E, Worthey EA, Delcher AL, Blandin G, et al.: The genome sequence of Trypanosoma cruzi, etiologic agent of Chagas disease. Science 2005, 309:409-415.
7. Clayton CE: Life without transcriptional control? From fly to man and back again. EMBO J 2002, 21:1881-1888.
8. Vanhamme L, Pays E: Control of gene expression in trypano-somes. Microbiol Rev 1995, 59:223-240.
9. Atwood JA 3rd, Weatherly DB, Minning TA, Bundy B, Cavola C, Opperdoes FR, Orlando R, Tarleton RL: The Trypanosoma cruzi proteome. Science 2005, 309:473-476.
10. Rabilloud T: Two-dimensional gel electrophoresis in proteom-ics: old, old fashioned, but it still climbs up the mountains.
Proteomics 2002, 2:3-10.
11. Parodi-Talice A, Monteiro-Goes V, Arrambide N, Avila AR, Duran R, Correa A, Dallagiovanna B, Cayota A, Krieger M, Goldenberg S, Robello C: Proteomic analysis of metacyclic trypomastigotes undergoing Trypanosoma cruzi metacyclogenesis. J Mass
Spectrom 2007, 42:1422-1432.
12. Wang YY, Cheung PY, Wong MS, Lo SC: "Two-in-one" gel for spot matching after two-dimensional electrophoresis.
Pro-teomics 2003, 3:580-583.
13. Weiller GF, Caraux G, Sylvester N: The modal distribution of protein isoelectric points reflects amino acid properties rather than sequence evolution. Proteomics 2004, 4:943-949. 14. Medjahed D, Smythers GW, Powell DA, Stephens RM, Lemkin PF,
Munroe DJ: VIRTUAL2D: A web-accessible predictive data-base for proteomics analysis. Proteomics 2003, 3:129-138. 15. El-Sayed NM, Myler PJ, Blandin G, Berriman M, Crabtree J, Aggarwal
G, Caler E, Renauld H, Worthey EA, Hertz-Fowler C, et al.: Com-parative genomics of trypanosomatid parasitic protozoa. Sci-ence 2005, 309:404-409.
16. Kiraga J, Mackiewicz P, Mackiewicz D, Kowalczuk M, Biecek P, Polak N, Smolarczyk K, Dudek MR, Cebrat S: The relationships between the isoelectric point and: length of proteins, taxon-omy and ecology of organisms. BMC Genomics 2007, 8:163. 17. Hoving S, Gerrits B, Voshol H, Muller D, Roberts RC, van Oostrum
J: Preparative two-dimensional gel electrophoresis at alka-line pH using narrow range immobilized pH gradients.
Pro-teomics 2002, 2:127-134.
18. Hoving S, Voshol H, van Oostrum J: Towards high performance two-dimensional gel electrophoresis using ultrazoom gels.
Electrophoresis 2000, 21:2617-2621.
19. Craven RA, Jackson DH, Selby PJ, Banks RE: Increased protein entry together with improved focussing using a combined IPGphor/Multiphor approach. Proteomics 2002, 2:1061-1063. 20. Sanchez JC, Rouge V, Pisteur M, Ravier F, Tonella L, Moosmayer M,
Wilkins MR, Hochstrasser DF: Improved and simplified in-gel sample application using reswelling of dry immobilized pH gradients. Electrophoresis 1997, 18:324-327.
21. Gorg A, Obermaier C, Boguth G, Weiss W: Recent developments in two-dimensional gel electrophoresis with immobilized pH gradients: wide pH gradients up to pH 12, longer separation distances and simplified procedures. Electrophoresis 1999,
20:712-717.
22. Gorg A, Boguth G, Obermaier C, Posch A, Weiss W: Two-dimen-sional polyacrylamide gel electrophoresis with immobilized pH gradients in the first dimension (IPG-Dalt): the state of the art and the controversy of vertical versus horizontal sys-tems. Electrophoresis 1995, 16:1079-1086.
23. Olsson I, Larsson K, Palmgren R, Bjellqvist B: Organic disulfides as a means to generate streak-free two-dimensional maps with narrow range basic immobilized pH gradient strips as first dimension. Proteomics 2002, 2:1630-1632.
24. Sabounchi-Schutt F, Astrom J, Olsson I, Eklund A, Grunewald J, Bjel-lqvist B: An immobiline DryStrip application method enabling high-capacity two-dimensional gel electrophoresis.
Electro-phoresis 2000, 21:3649-3656.
25. Halligan BD, Ruotti V, Jin W, Laffoon S, Twigger SN, Dratz EA: Pro-MoST (Protein Modification Screening Tool): a web-based tool for mapping protein modifications on two-dimensional gels. Nucleic Acids Res 2004, 32:W638-644.
26. Charneau S, Junqueira M, Costa CM, Pires DL, Bussacos AC, Sousa MV, Ricart CAO, Shevchenko A, Teixeira ARL: The saliva pro-teome of the blood-feeding insect Triatoma infestans is rich
in platelet-aggregation inhibitors. Int J Mass Spectrom 2007,
268:265-276.
27. Cuervo P, de Jesus JB, Junqueira M, Mendonca-Lima L, Gonzalez LJ, Betancourt L, Grimaldi G Jr, Domont GB, Fernandes O, Cupolillo E:
Proteome analysis of Leishmania (Viannia) braziliensis by two-dimensional gel electrophoresis and mass
spectrome-try. Mol Biochem Parasitol 2007, 154:6-21.
28. Shapiro SS, Wilk MB: An analysis of variance test for normality (complete samples). Biometrika 1965, 52:591-611.
29. Bringaud F, Riviere L, Coustou V: Energy metabolism of trypano-somatids: adaptation to available carbon sources. Mol Biochem
Parasitol 2006, 149:1-9.
30. Murta SM, Krieger MA, Montenegro LR, Campos FF, Probst CM, Avila AR, Muto NH, de Oliveira RC, Nunes LR, Nirde P, et al.: Deletion of copies of the gene encoding old yellow enzyme (TcOYE), a NAD(P)H flavin oxidoreductase, associates with in vitro-induced benznidazole resistance in Trypanosoma cruzi. Mol
Biochem Parasitol 2006, 146:151-162.
31. Ersfeld K, Barraclough H, Gull K: Evolutionary relationships and protein domain architecture in an expanded calpain super-family in kinetoplastid parasites. J Mol Evol 2005, 61:742-757. 32. Frasch AC: Functional diversity in the trans-sialidase and
mucin families in Trypanosoma cruzi. Parasitol Today 2000,
16:282-286.
33. Valcu CM, Valcu M: Reproducibility of two-dimensional gel electrophoresis at different replication levels. J Proteome Res
2007, 6:4677-4683.
34. Mineki R, Taka H, Fujimura T, Kikkawa M, Shindo N, Murayama K: In situ alkylation with acrylamide for identification of cysteinyl residues in proteins during one- and two-dimensional sodium dodecyl sulphate-polyacrylamide gel
electrophore-sis. Proteomics 2002, 2:1672-1681.
35. Blum H, Beier H, Gross HJ: Improved silver staining of plant-proteins, RNA and DNA in polyacrilamide gels. Electrophoresis