R E S E A R C H A R T I C L E
Open Access
A decade of adverse drug events in
Portuguese hospitals: space-time clustering
and spatial variation in temporal trends
Gianina Scripcaru
1,2, Ceu Mateus
3and Carla Nunes
1,4*Abstract
Background:The aim of this study is to identify the distribution by municipalities of adverse drug events (ADE) in Portugal, including adverse drug reactions (ADR) and accidental poisoning by drugs (AP), on municipality/years ADE rate clustering. Also we identify areas with different trends in time.
Methods:We used a national dataset of public hospital discharges in Continental Portugal from 2004 to 2013. Events were identified based on codes: from E930 to E949.9 (ADR) and from E850 to E858.9 (AP). Space-time clustering and spatial variation in temporal trends methods were applied in three different time-periods: globally, by year and grouped in 2 classes (periods of 5 years).
Results:A total of 9,320,076 patients were discharged within this period, with 133,688 patients (1.46%) having at least one ADE, 4% of them related with AP. Critical space-time identified clusters (p < 0.001) were the municipalities from Lisbon metropolitan area and Centro region area. The global rate increased at a 7.8% mean annual
percentage change, with high space-time heterogeneity and variation in time trends clusters (p < 0.001). For whole period, 2004–2013, all clusters presented increasing trends. However when analyzed by period of 5 years we identified two clusters with decreasing trends in time in 2004–2008.
Conclusion:The impact of ADE is huge, with widely variations within country and in time, and represents an increasing challenge. Future research using individual and contextual risk factors are urgently needed to understand this spatiotemporal variability in order to promote local tailored and updated actions of prevention.
Keywords:Adverse drug events, Hospitals, Space-time, Epidemiology
Background
The use of the drugs, in addition to the benefit brought, may include some risks, is that at some point the patient may suffer an iatrogenic process, which can cause injuries with different levels of severity, potentially requiring patient hospitalization [1].
In the last decade organizational structures of pharma-covigilance have been continuously improved, with a closer supervision of the drugs over a long period of time including after the approval of commercialization. Pharmacovigilance is a key element of effective activity
with the drugs, the medical practice and public health programs [2].
Studies have estimated a varied percentage of incidences of adverse events related with the drugs leading to hospitalization ranges from 2.4% to 6.5% of all hospitaliza-tions in Western European countries [3–6]. Regarding the elderly, this percentage is higher, ranging between 3.4% and 16.6% [3, 4]. The percentage of patients with one or more adverse drug events during hospitalization varies between 1.8% and 19.2%, resulting in increased hospitalization time and thus the costs [7, 8]. In Lagnaoui et al., the incidence rate for in-hospital adverse drug reactions was 10.1 per 1000 patient-days [9]. Geographic epidemiology studies can help to detect regions with rising incidences of adverse drug events and differences in drug utilization [10].
* Correspondence:[email protected]
1Escola Nacional de Saúde Pública, Universidade NOVA de Lisboa, Av Padre
Cruz, 1600-560 Lisbon, Portugal
4Centro de Investigação em Saúde Pública, Universidade NOVA de Lisboa,
Lisbon, Portugal
Full list of author information is available at the end of the article
In literature review of Patel and Peter in 2002 regard-ing the visits to the emergency department, it was estimated that 28% of these were due to adverse drug events, of which 24% required hospitalization, and 70–80% were avoidable adverse events [11, 12].
Geographical information systems and spatial analysis provide important tools for disease control, where the place can be considered as proxy for the interaction be-tween genetic factors, lifestyle and environment [13, 14]. Spatial autocorrelation statistics provide useful informa-tion about the spatial arrangement of data in a map and the correlation or dependency rates for geographically close areas with application in several sciences such as criminology, ecology, public health [15–18]. Spatial scan statistics [15] is one of the most used methods, identify-ing potential clusters by drawidentify-ing circles of different sizes over the area of study and compare the risk of disease inside and outside of each circle [18]. Advances in meth-odology of spatial epidemiology create opportunities for researcher to improve reporting of disease at national or regional scale, even in small areas, although this studies are susceptible to confusing results related with small numbers [19]. Two methodological methods were ap-plied in this study, space–time clustering and spatial variation in temporal trends, enabling the identification of areas where major problems and areas with temporal trends different from the rest of the country. The use of these two methods is a very powerful tool to improve knowledge in public health.
The study objectives are to identify spatiotemporal municipality-years incidence rate high clusters of adverse drug events (ADE) based on the hospital discharges data-set in Portugal from 2004 to 2013 and find spatial clusters of incidence with different trends in the same period. This study aims to contribute to public health management fo-cused on adverse drug events and as we know, is the first nationwide study using this methodology.
Methods
Using the Portuguese hospital inpatient discharges data-set from 2004 to 2013 a retrospective observational na-tionwide study was using the International Classification of Diseases (ICD-9). In the analysis were included patients with ADE by geographical area being the geographical unit “municipality” - in mainland Portugal (n= 278).
The dataset has patients’anonymized information and the variables used were: year, sex, age, length of stay, discharge status (home, transferred, dead, and so on), hospital’s region (of five Regional Health Administrations – RHA) and external causes (E codes). All day episodes were excluded from the analyses. ADE were defined as injuries resulting from the use of prescription and over-the-counter medications for medical intervention, which
includes adverse drug reactions and medication error and excludes administration of the wrong medication, intentional overdoses or use of illicit substances, in agree-ment with the literature [20–24].
Based on literature, the following E codes were used from ICD-9: E930 to E949.9 of ADR and E codes from E850 to E858.9 (specifically for AP) [24–26].
The unit of analysis is annual rate of adverse drug events per 10 000 hospitalizations between 2004 and 2013. Patient admitted multiple times in hospital are accounted for each time separately. For the rate’s numerator were considered annual discharges with adverse drug events by patients’ municipalities. The denominator were taken all annual discharges by year in ten-year’time period.
As a first approach a descriptive analysis was performed, followed by two clustering methods. First we use the clas-sical space-time clustering to identify high incidence areas, followed by the analysis of the spatial variation in tem-poral trends. For this, a retrospective space-time analysis using a Poisson distribution for identification of the ele-vated disease risk within a cluster, using SaTScan Software [27], was done. Cluster analysis can detect and identify geographic areas that have significant differences in risk, regardless of their size. SaTScan software, based in Kulldorff’s statistical methodology, uses the spatial scan and is routinely used in public health [17, 27–29].
A first clustering analysis was conducted for the whole period from 2004 up to 2013. After, based on the obtained results, this period was split in two smaller periods, 2004–2008 and 2009–2013, to evaluate the consistency of clusters found and respective trends. Data were analyzed using a statistical significance level of 5%.
The results were mapped using the Epi Info software [30].
Results
Table 1 illustrates the distribution of patient discharges (all, ADE and subgroups), globally and by year. The ana-lysis shows a slight increase in the number of all ADE in general, with an increase in ADR since 2005, although the AP are more stable in evolution in the period studied. An increase of 70% for ADE was observed during the period, with 11,007 events in 2004 and reach-ing 18,750 in 2013.
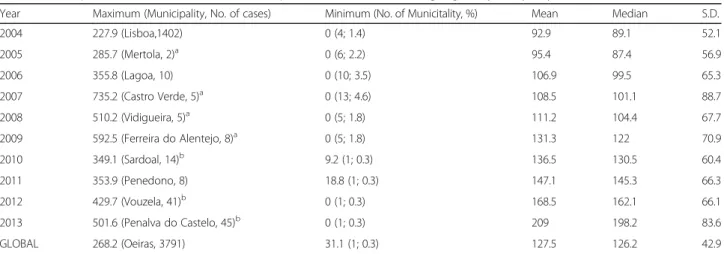
Descriptive statistics are presented in Table 2, by year and globally, and also identifying the municipalities with highest ADE rates.
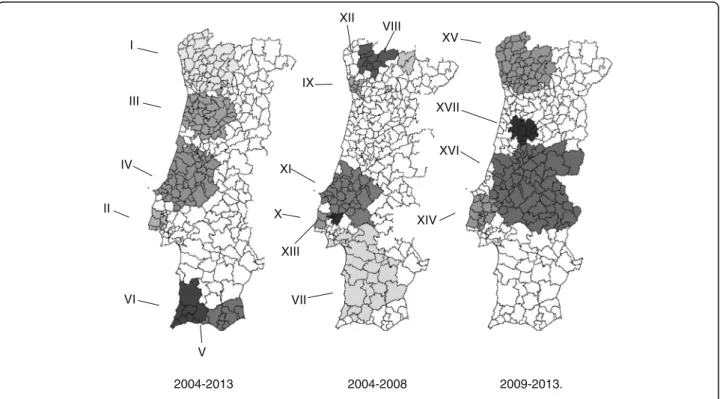
Figure 1 presents the space-time clusters of higher rates of ADE in Portugal, in three periods: 2004–2013, 2004–2008 and 2009–2013.
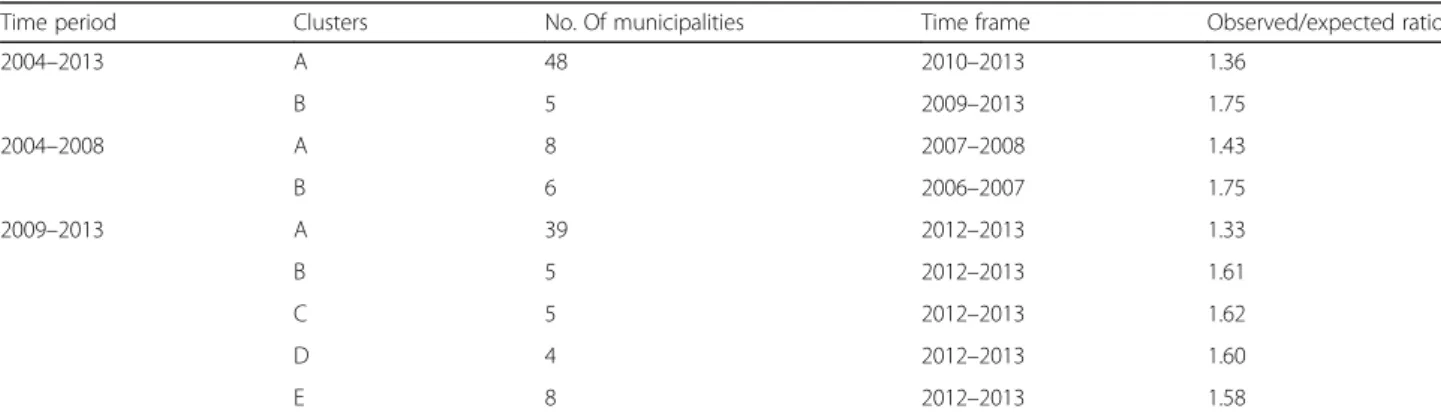
Table 3 presents the characteristics of critical areas (identified clusters), considering the overall period (2004–2013) and the two half periods (2004–2008; 2009–2013). This split was based on 2004–2013 results.
Table 4 shows the result for the spatial variation in temporal trends of ADE rates for the three time periods being studied (2004–2013; 2004–2008; 2009–2013). Additionally Figs. 2 present the incidence rate trends and spatial distribution of the identified clusters for the same three studied time-periods.
Discussion
To our knowledge this is the first space-time study aiming to understand the phenomena of adverse drug events at national level in Portugal. This analysis contributes with two important results: 1) the variability in space and time within the country and 2) increasing rate of ADE for the whole time period with all significant clusters increasing above the national mean.
In 2004–2013 period, we have identified an increase proportion of ADE in all discharges (1,1% in 2004 and 2,1% in 2013). Also in this period a slight increase in the number of overall hospitalizations was observed. Many of
the side effects are associated with specific factors related with the patient and/or with the drug. The evolution of the treatments alternatives being used (with more and stronger drugs available on the market) and increase in average life expectancy can be considered as principal rea-sons for ADE. Other factors that contribute to adverse re-actions are related with the accuracy of the prescribing, dispensing and administration of the drugs [31]. Risk fac-tors related with patients include older age, female sex, drugs in therapy and the number of associated comorbidi-ties [32–34]. Determining the incidence of adverse drug reactions may be difficult, because frequently drugs are not recognized as the cause of symptoms or diseases [35]. Not all studies accurately disentangle ADE leading to hospitalization and hospital-acquired ADE what becomes a confounder in the results obtained.
When space-time clustering was applied to the whole period 2004–2013, the municipalities from Lisbon metro-politan area (clusters 1) were identified as critical in the 2009–2013 period and Centro region area (cluster 2) was identified as critical in time frame 2010–2013. Using the same analysis for the two sub-periods, with a cut-off point in 2008/2009, similar critical areas were identified in the 2004–2008 period for the years 2006–2007 in the Lisbon metropolitan area (cluster 3) and in years 2007–2008 for the Centro Region (cluster 4). For the second period
Table 1Distribution of ADR & AP by year and globally
Year 2004 2005 2006 2007 2008 2009 2010 2011 2012 2013 Total
ADR N(%) 10 442 (94.9%) 9 444 (94.5%) 10 911 (95.2%) 11 217 (95.7%) 11 271 (95.7%) 12 404 (96.3%) 13 773 (96.1%) 14 320 (96%) 16 560 (98.2%) 18 262 (97.4%) 128 604 (96.2%) AP N(%)
565 (5.1%) 552 (5.5%)
553 (4.8%) 502 (4.3%) 501 (4.3%) 477 (3.7%) 552 (3.8%) 590 (3.9%)
304 (1.8%) 488 (2.6%) 5 084 (3.8%) Total ADE N(%) 11 007 (100%) 9 996 (100%) 11 464 (100%) 11 719 (100%) 11 772 (100%) 12 881 (100%) 14 325 (100%) 14 910 (100%) 16 864 (100%) 18 750 (100%) 133 688 (100%)
% ADE in all discharges
1.1% 1.1% 1.3% 1.3% 1.3% 1.4% 1.5% 1.7% 1.9% 2.1% 1.5%
Table 2Description of ADE rates in the 278 municipalities of continental Portugal, globally and yearly
Year Maximum (Municipality, No. of cases) Minimum (No. of Municitality, %) Mean Median S.D.
2004 227.9 (Lisboa,1402) 0 (4; 1.4) 92.9 89.1 52.1
2005 285.7 (Mertola, 2)a 0 (6; 2.2) 95.4 87.4 56.9
2006 355.8 (Lagoa, 10) 0 (10; 3.5) 106.9 99.5 65.3
2007 735.2 (Castro Verde, 5)a 0 (13; 4.6) 108.5 101.1 88.7
2008 510.2 (Vidigueira, 5)a 0 (5; 1.8) 111.2 104.4 67.7
2009 592.5 (Ferreira do Alentejo, 8)a 0 (5; 1.8) 131.3 122 70.9
2010 349.1 (Sardoal, 14)b 9.2 (1; 0.3) 136.5 130.5 60.4
2011 353.9 (Penedono, 8) 18.8 (1; 0.3) 147.1 145.3 66.3
2012 429.7 (Vouzela, 41)b 0 (1; 0.3) 168.5 162.1 66.1
2013 501.6 (Penalva do Castelo, 45)b 0 (1; 0.3) 209 198.2 83.6
GLOBAL 268.2 (Oeiras, 3791) 31.1 (1; 0.3) 127.5 126.2 42.9
(2009–2013), we further identified three clusters besides the ones already known. These three clusters are located in the Oporto metropolitan area, Algarve Region and Centro Region. All the clusters in this period are consid-ered as critical for the years 2012 and 2013.
Previous studies have shown the rate of ADR in hospital inpatients ranging from 0.8% to 26.1% [7–9, 36, 37]. Studies using administrative datasets have shown rates of ADR between 0.8% and 1.8% in Europe [26, 37, 38]. The differences in the results observed can be due to differ-ences in the accuracy of data reporting in the datasets used or to the definition of the ADR.
A large number of studies points towards an in-creasing trend of ADR over time [38–40]. In our study the spatial variation in temporal trends of ADE
the mean annual percentage change in the rate was 7.8% for the period 2004–2013, 3.7% for 2004–2008 and 11.2% for 2009–2013. During 2004–2013 six sig-nificant clusters were identified and all of them present increasing trends for the ADE’ rate. Clusters II, IV and VI showed a slower increase in the mean annual trend (3.8%, 4.8% and 1.4%) when compared against the country global mean annual trend (7.8%). The mean annual trend for the remaining clusters increased faster than the country mean.
In the period 2004–2008 seven clusters with signifi-cant variations were identified. Only two clusters with decreasing trends were found, clusters IX and XI with rates of −2.9% and −2.2%, respectively. In this period
cluster VIII showed an accelerated increase with a rate
2004-2013 2004-2008 2009-2013
Fig. 1Space-time clusters of higher rate of ADE cases in three periods
Table 3Space-time clusters with higher rate of ADE in three time periods (2004–2013, 2004–2008 and 2099–2013) (p < 0.001)
Time period Clusters No. Of municipalities Time frame Observed/expected ratio
2004–2013 A 48 2010–2013 1.36
B 5 2009–2013 1.75
2004–2008 A 8 2007–2008 1.43
B 6 2006–2007 1.75
2009–2013 A 39 2012–2013 1.33
B 5 2012–2013 1.61
C 5 2012–2013 1.62
D 4 2012–2013 1.60
Table 4Space clusters of temporal trends of ADE incidence rate found in 2004–2013, 2004–2008 and 2009–2013. Positive and negative percentages correspond to increasing or decreasing trends, respectively
Time-period a-b global trend (%)
Clusters (p< 0,05)
No. of cases in a-b (no. of municipalities)
Trends (%)
ADE rate x 10¯4in period a
ADE rate x 10¯4in period b
2004–2013 I 16403 (44) 14,8 65.8 204.6
(7,83%) II 36146 (8) 3,8 184.6 253.7
III 12883 (38) 11.4 91.3 202.5
IV 13528 (40) 4.8 117.3 177.9
V 3841 (9) 12.4 103.4 287.5
VI 1126 (8) 1.4 79.8 142.1
2004–2008 VII 2997 (26) 17.1 95.8 165.1
(3,70%) VIII 335 (2) 40.1 46.1 164.1
IX 5135 (8) −2.9 122.1 115.5
X 2699 (3) 12.9 108.2 158
XI 4216 (30) −2.2 114.7 103.2
XII 1157 (10) 15.9 62.5 101.4
XIII 584 (2) 19.6 87 150.7
2009–2013 XIV 17598 (15) 4.5 190.7 226.8
(11.20%) XV 12837 (44) 19.5 103.4 204.6
XVI 7651 (62) 5.9 127.5 169.8
XVII 1692 (10) 21.6 109.4 266.5
Values in bold identified areas where trends were higher than global trends (for each a-b period)
2004-2013 2004-2008 2009-2013.
I
III
II IV
V
VI VII
XII
IX
XI
X
XIII
XV
XVI
XIV XVII VIII
reaching 40.1%, with an increase in the rate of ADE from 46 cases to 164 cases/10 000 inpatients.
In the period 2009–2013 four clusters with significant in-creases were identified. Clusters XIV and XVI showed a slower increase in their trend when compared with the country mean. In this period Cluster XVII showed an in-crease in the mean percentage rate (21.6%) that was twice the observed in the country mean.
The mean annual change in rate for the period 2004 to 2013 was 7.8%, although in 2009–2013 an accelerate increase in rate was detected. Globally all clusters present increasing trends, however cluster VI, the smaller one in this period including eight municipalities with 10 112 dis-charges, shows an irregular trend in 2009. A very acceler-ate trend was identified for cluster V, belonging to the South region of the country, that was not identified as critical the half periods.
Decreasing trends are only observable in the period 2004–2008, with cluster IX including Oporto metropolitan area and cluster XI placed in region Centro and Alentejo. Comparing with the increasing rate in this period, reaching in cluster VIII an annual increase per-centage of 40.1%, the decreasing rate are very small with a percentage rate only −2.9% in cluster IX and −2.2% in
cluster XI. Clusters with high increasing trends comprised a small number of municipalities. Such clusters should be analyzed more closely, as their trend may be explained by the variation of small numbers or administrative issues. We must also mention that clusters with decreasing trends (IX and XI) are bigger, as per the number of pa-tients discharged, when compared with the clusters with increasing trends (VII, VIII, X, XII and XIII) in same period. Critical areas, identified through space-time clus-tering were partially consistent with the municipalities with the maximum rate obtained in the descriptive ap-proach. Space-time clustering analysis is preferred for identified critical areas, even in small numbers although a careful interpretation of this results and future studies must be considered [41].
The number of ADE has increased in the last decade in Portugal, with the subgroup of AP being more stable in time than ADR. High variability across country was observed and the method applied to this study, a combin-ation between space-time clustering and spatial varicombin-ation in temporal trends, allow the identification of the areas with high risk and with temporal trend different from the rest of the country.
The increase in the frequency of ADE was expected considering several factors that can contribute for ADE (new drugs, population ageing, multiple drugs in therapy, comorbidities etc.) but the variations must be understand [32–34, 42]. Results are consistent with other studies using administrative hospital datasets which report in-creasing trends of ADE related hospitalizations in
England, Germany and Sweden. Current efforts worldwide are now being developed to reduce morbidity and mortal-ity related to drugs and the application of this method-ology provides better knowledge to set geographic priorities within the country pharmacovigilance system.
In this analysis we assumed homogeneity in the codifi-cation and in the notificodifi-cation rate in space and time. If this situation does not occur biases can affect the study results.
Conclusion
The mean annual percentage change in ADE rate in the period 2004–2013 was 7.8%, with all clusters in an increase trend. In the first half period 2004–2008, the increase was slighter lower (3.7%) but in the period 2009–2013 we observed an accelerate increase reaching 11.2%. Identified high incidence areas weren’t overlap with trends results, but joint analysis of these results raises very promising prospects for the design of future interventions to control this challenging problem. The impact of ADE is huge, with widely variations within country, and presents an increasing pattern. Future re-search using individual (comorbidities, concomitant medication, life style or genetic predisposition) and con-textual risk factors (regional variability related with health services) can be helpful to explain this spatiotem-poral variability in order to promote local tailored and updated actions of prevention.
Abbreviations
ADE:Adverse drug events; ADR: Adverse drug reactions; AP: Accidental poisoning by drugs
Acknowledgements
The authors would like to thank to the Central Authority for Health Services, I.P., abbreviated as ACSS, I.P for providing access to the data.
Funding
This study was partially supported by the Fundação para a Ciência e a Tecnologia (FCT) (SFRH/BD/79860/2011). FCT did not have a role in the design of the study and collection, analysis, and interpretation of data and in writing the manuscript.
Availability of data and materials
The data that support the findings of this study are available from Central Authority for Health Services, I.P.,(abbreviated as ACSS, I.P) but restrictions apply to the availability of these data, which were used under license for the current study, and so are not publicly available. Data are however available from the authors upon reasonable request and with permission of ACSS, I.P.
Authors’contributions
GS was responsible for research planning, data analysis, interpretation of results and elaboration of the present manuscript. CM and CN were also responsible for research planning and for consultancy and review of the present manuscript. All authors read and approved the final manuscript.
Competing interests
The authors declare that they have no competing interests.
Consent for publication
Ethics approval and consent to participate
Ethics committee approval and informed consent were not required, as data was based on an official data set and was previously anonymous.
Publisher’s Note
Springer Nature remains neutral with regard to jurisdictional claims in published maps and institutional affiliations.
Author details
1Escola Nacional de Saúde Pública, Universidade NOVA de Lisboa, Av Padre
Cruz, 1600-560 Lisbon, Portugal.2AMGEN Biofarmaceutica, Lisbon, Portugal. 3Health Economics Group Division of Health Research, Lancaster University,
Lancaster, UK.4Centro de Investigação em Saúde Pública, Universidade NOVA de Lisboa, Lisbon, Portugal.
Received: 31 January 2017 Accepted: 1 May 2017
References
1. Madeira S, Melo M, Porto J, Monteiro S. Pereira de Moura JM, Alexandrino MB, et al. The diseases we cause: Iatrogenic illness in a department of internal medicine. Eur J Intern Med. 2007;18(5):391–9.
2. World Health Organization Geneva, Issue No.9, October 2004; http://apps. who.int/iris/bitstream/10665/68782/1/WHO_EDM_2004.8.pdf. Accessed 15 Oct 2016.
3. Beijer HJ, de Blaey CJ. Hospitalisations caused by adverse drug reactions (ADR): a meta-analysis of observational studies. Pharmacy world & science : PWS. 2002;24(2):46–54. Epub 2002/06/14.
4. Pouyanne P, Haramburu F, Imbs JL, Begaud B. Admissions to hospital caused by adverse drug reactions: cross sectional incidence study. French Pharmacovigilance Centres BMJ. 2000;320(7241):1036. Epub 2000/04/14. 5. Pirmohamed M, James S, Meakin S, Green C, Scott AK, Walley TJ, et al.
Adverse drug reactions as cause of admission to hospital: prospective analysis of 18 820 patients. BMJ. 2004;329(7456):15–9. Epub 2004/07/03. 6. Lazarou J, Pomeranz BH, Corey PN. Incidence of adverse drug reactions in
hospitalized patients: a meta-analysis of prospective studies. Jama. 1998; 279(15):1200–5.
7. Classen DC, Pestotnik SL, Evans RS, Burke JP. Computerized surveillance of adverse drug events in hospital patients. Jama. 1991;266(20):2847–51. Epub 1991/11/27. 8. Davies EC, Green CF, Mottram DR, Pirmohamed M. Adverse drug reactions
in hospital in-patients: a pilot study. J Clin Pharm Ther. 2006;31(4):335–41. Epub 2006/08/03.
9. Lagnaoui R, Moore N, Fach J, Longy-Boursier M, Begaud B. Adverse drug reactions in a department of systemic diseases-oriented internal medicine: prevalence, incidence, direct costs and avoidability. Eur J Clin Pharmacol. 2000;56(2):181–6. Epub 2000/07/06.
10. Stolley PD. How study of geographic epidemiology of disease can help in detection of adverse drug reactions. Clin Pharmacol Ther. 1976;19(5 Pt 2): 679–82.
11. Patel P, Zed PJ. Drug-related visits to the emergency department: how big is the problem? Pharmacotherapy. 2002;22(7):915–23.
12. Routledge PA, O’Mahony MS, Woodhouse KW. Adverse drug reactions in elderly patients. Br J Clin Pharmacol. 2004;57(2):121–6. Epub 2004/01/30. 13. Graham AJ, Atkinson PM, Danson FM. Spatial analysis for epidemiology.
Acta Trop. 2004;91(3):219–25.
14. Elliott P, Best N. Geographics pattern of disease. In Encyclopedia of epidemiologic methods Gail MH, Benichou J (eds).2000; pp 405–412. England: John Wiley & Sons.
15. Kulldorff M, Heffernan R, Hartman J, Assuncao R, Mostashari F. A space-time permutation scan statistic for disease outbreak detection. PLoS Med. 2005;2(3), e59.
16. Beato Filho CC, Assuncao RM, Silva BF, Marinho FC, Reis IA, Almeida MC. [Homicide clusters and drug traffic in Belo Horizonte, Minas Gerais State, Brazil from 1995 to 1999]. Cadernos de saude publica. 2001;17(5):1163–71. Epub 2001/10/27. Conglomerados de homicidios e o trafico de drogas em Belo Horizonte, Minas Gerais, Brasil, de 1995 a 1999.
17. Areias C, Briz T, Nunes C. Pulmonary tuberculosis space-time clustering and spatial variation in temporal trends in Portugal, 2000–2010: an updated analysis. Epidemiol Infect. 2015;143(15):3211–9.
18. Rezaeian M, Dunn G, St Leger S, Appleby L. Geographical epidemiology, spatial analysis and geographical information systems: a multidisciplinary glossary. J Epidemiol Community Health. 2007;61(2):98–102.
19. Elliott P, Wartenberg D. Spatial epidemiology: current approaches and future challenges. Environ Health Perspect. 2004;112(9):998–1006. Epub 2004/06/17.
20. Hougland P, Nebeker J, Pickard S, Van Tuinen M, Masheter C, Elder S, et al. Using ICD-9-CM Codes in Hospital Claims Data to Detect Adverse Events in Patient Safety Surveillance. In: Henriksen K, Battles JB, Keyes MA, Grady ML, editors. Advances in Patient Safety: New Directions and Alternative Approaches (Vol 1: Assessment). Rockville (MD)2008.
21. Stausberg J. International prevalence of adverse drug events in hospitals: an analysis of routine data from England, Germany, and the USA. BMC Health Serv Res. 2014;14:125.
22. Bourgeois FT, Shannon MW, Valim C, Mandl KD. Adverse drug events in the outpatient setting: an 11-year national analysis. Pharmacoepidemiol Drug Saf. 2010;19(9):901–10. Epub 2010/07/14.
23. Nebeker JR, Barach P, Samore MH. Clarifying adverse drug events: a clinician’s guide to terminology, documentation, and reporting. Ann Intern Med. 2004;140(10):795–801. Epub 2004/05/19.
24. Burgess CL, Holman CD, Satti AG. Adverse drug reactions in older Australians, 1981–2002. Med J Aust. 2005;182(6):267–70. Epub 2005/03/22. 25. Miguel A, Bernardo M, Freitas A, Lopes F, Azevedo L, Pereira AC.
Detection of adverse drug reactions using hospital databases-a nationwide study in Portugal. Pharmacoepidemiol Drug Saf. 2013;22(8):907–13.
26. van der Hooft CS, Sturkenboom MC, van Grootheest K, Kingma HJ, Stricker BH. Adverse drug reaction-related hospitalisations: a nationwide study in The Netherlands. Drug safety : an international journal of medical toxicology and drug experience. 2006;29(2):161–8. Epub 2006/ 02/04.
27. Price RC, Pettey W, Freeman T, Keahey K, Leecaster M, Samore M, et al. SaTScan on a Cloud: On-Demand Large Scale Spatial Analysis of Epidemics. Online J Public Health Inform. 2010;2(1):ISSN1947-2579.
28. Nunes C. Tuberculosis incidence in Portugal: spatiotemporal clustering. Int J Health Geogr. 2007;6:30.
29. Nunes C. The space-time dimension in public health: from classical description to clustering analysis. Revista Portuguesa de Saúde Pública. 2008;28:5–14.
30. CfDCaP CDC. Epi Info. 2013.
31. Mackichan JJ, Lee WLM. Factors Contributing to Drug-Induced Diseases. In: Tisdale JE, Miller DA, Pharmacists ASoH-S, editors. Drug-induced Diseases: Prevention, Detection, and Management: American Society of Health-System Pharmacists; 2010. p. 23–30.
32. Evans RS, Lloyd JF, Stoddard GJ, Nebeker JR, Samore MH. Risk factors for adverse drug events: a 10-year analysis. Ann Pharmacother. 2005;39(7–8): 1161–8. Epub 2005/05/18.
33. Bates DW, Miller EB, Cullen DJ, Burdick L, Williams L, Laird N, et al. Patient risk factors for adverse drug events in hospitalized patients. ADE Prevention Study Group. Arch Intern Med. 1999;159(21):2553–60. Epub 1999/11/26. 34. van den Bemt PM, Egberts AC, Lenderink AW, Verzijl JM, Simons KA, van der
Pol WS, et al. Risk factors for the development of adverse drug events in hospitalized patients. Pharmacy world & science : PWS. 2000;22(2):62–6. Epub 2000/06/13.
35. Azaz-Livshits T, Levy M, Sadan B, Shalit M, Geisslinger G, Brune K. Computerized survelliance of adverse drug reactions in hospital: pilot study. Br J Clin Pharmacol. 1998;45(3):309–14. Epub 2000/07/15.
36. Hallas J, Harvald B, Worm J, Beck-Nielsen J, Gram LF, Grodum E, et al. Drug related hospital admissions. Results from an intervention program. Eur J Clin Pharmacol. 1993;45(3):199–203. Epub 1993/01/01.
37. Salmeron-Garcia A, Cabeza Barrera J, Vergara Pavon MJ, Roman Marquez E. Cortes de Miguel S, Vallejo-Rodriguez I, et al. Detection of adverse drug reactions through the minimum basic data set. Pharmacy world & science : PWS. 2010;32(3):322–8. Epub 2010/03/10.
38. Wu TY, Jen MH, Bottle A, Molokhia M, Aylin P, Bell D, et al. Ten-year trends in hospital admissions for adverse drug reactions in England 1999–2009. J R Soc Med. 2010;103(6):239–50.
40. Stausberg J, Hasford J. Drug-related admissions and hospital-acquired adverse drug events in Germany: a longitudinal analysis from 2003 to 2007 of ICD-10-coded routine data. BMC Health Serv Res. 2011;11:134. 41. Moraga P, Kulldorff M. Detection of spatial variations in temporal trends
with a quadratic function. Stat Methods Med Res. 2013.
42. Klein E, Bourdette D. Postmarketing adverse drug reactions: A duty to report? Neurology Clinical practice. 2013;3(4):288–94. Epub 2013/11/07.
• We accept pre-submission inquiries
• Our selector tool helps you to find the most relevant journal • We provide round the clock customer support
• Convenient online submission
• Thorough peer review
• Inclusion in PubMed and all major indexing services
• Maximum visibility for your research
Submit your manuscript at www.biomedcentral.com/submit