CPD
11, 2341–2388, 2015Spatial and temporal oxygen isotope variability in northern
Greenland
S. Weißbach et al.
Title Page
Abstract Introduction
Conclusions References
Tables Figures
◭ ◮
◭ ◮
Back Close
Full Screen / Esc
Printer-friendly Version
Interactive Discussion
Discussion
P
a
per
|
Discussion
P
a
per
|
Discussion
P
a
per
|
Discussion
P
a
per
|
Clim. Past Discuss., 11, 2341–2388, 2015 www.clim-past-discuss.net/11/2341/2015/ doi:10.5194/cpd-11-2341-2015
© Author(s) 2015. CC Attribution 3.0 License.
This discussion paper is/has been under review for the journal Climate of the Past (CP). Please refer to the corresponding final paper in CP if available.
Spatial and temporal oxygen isotope
variability in northern Greenland –
implications for a new climate
record over the past millennium
S. Weißbach1, A. Wegner1, T. Opel2, H. Oerter1, B. M. Vinther3, and S. Kipfstuhl1
1
Alfred Wegener Institut Helmholtz-Zentrum für Polar- und Meeresforschung, Bremerhaven, Germany
2
Alfred Wegener Institut Helmholtz-Zentrum für Polar- und Meeresforschung, Potsdam, Germany
3
Centre for Ice and Climate, Niels Bohr Institute, University of Copenhagen, Denmark
Received: 07 May 2015 – Accepted: 02 June 2015 – Published: 23 June 2015
Correspondence to: S. Weißbach ([email protected])
CPD
11, 2341–2388, 2015Spatial and temporal oxygen isotope variability in northern
Greenland
S. Weißbach et al.
Title Page
Abstract Introduction
Conclusions References
Tables Figures
◭ ◮
◭ ◮
Back Close
Full Screen / Esc
Printer-friendly Version
Interactive Discussion
Discussion
P
a
per
|
Discussion
P
a
per
|
Discussion
P
a
per
|
Discussion
P
a
per
|
Abstract
We present for the first time all 12δ18O records obtained from ice cores drilled in the framework of the North Greenland Traverse (NGT) between 1993 and 1995 in northern Greenland between 74 to 80◦
N, 36 to 49◦
W and 2000 to 3200 m a.s.l. The cores cover an area of 680 km×317 km,∼200 000 km2or 10 % of the area of Greenland.
Depend-5
ing on core length (100–175 m) and accumulation rate (90–200 kg m−2a−1) the records reflect an isotope-temperature history over the last 500–1100 years.
Theδ18O signal in northern Greenland is influenced by temperature, accumulation and the topography of the North Greenland ice sheet between 72 and 80◦N. About 12 % of the variability can be attributed to the position of the single drill sites in relation
10
to the ice sheet topography.
Lowest δ18O mean values occur north of summit and east of the main divide. In general, ice cores drilled on the main ice divide show different results than those drilled east of the main ice divide that might be influenced by secondary regional moisture sources.
15
A stack of all 12 NGT records and the NGRIP record is presented with improved signal-to-noise ratio. This stack represents the meanδ18O signal for northern Green-land that is interpreted as proxy for temperature. Our northern GreenGreen-landδ18O stack in-dicates isotopically enriched periods compared to their average during medieval times, about 1420±20 AD and from 1870 AD onwards. The period between 1420 AD and
20
CPD
11, 2341–2388, 2015Spatial and temporal oxygen isotope variability in northern
Greenland
S. Weißbach et al.
Title Page
Abstract Introduction
Conclusions References
Tables Figures
◭ ◮
◭ ◮
Back Close
Full Screen / Esc
Printer-friendly Version
Interactive Discussion
Discussion
P
a
per
|
Discussion
P
a
per
|
Discussion
P
a
per
|
Discussion
P
a
per
|
1 Introduction
During the past decades the Arctic region has experienced a pronounced warming exceeding that of other regions (e.g. Masson-Delmotte et al., 2015). To set this warming into an historical context, a profound understanding of natural variability of past climate of the Arctic is essential. To do so, studying climate records is the first step. However,
5
meteorological measurements in the Arctic are only available for relatively short time periods; only a few time series start already in the 19th century. Hence, proxy data from climate archives such as ice cores from the polar ice caps are necessary.
Studying the climate of the past centuries allows us to compare the instrumental data with proxy records and therefore to assess the quality of the proxies for climate
10
reconstructions.
Stable water isotopes (hereδ18O) in ice cores are used to derive paleo-temperatures (e.g. Fischer et al., 1998c; Johnsen et al., 2000; Steffensen et al., 2008). They are largely controlled by equilibrium and kinetic fractionation processes during evapora-tion at the ocean surface, along the poleward air-mass transport and condensaevapora-tion of
15
precipitation, depending on temperature and moisture conditions (Dansgaard et al., 1969).
The isotope ratio is not only driven by local temperature, but is affected by several factors like moisture sources and their proximity to the deposition site, the topography of the ice sheet and the seasonality of precipitation. In addition the isotope signal is
al-20
tered by post-depositional processes like wind-induced redistribution of snow, temper-ature gradient metamorphism and diffusion. Stacked records are used to compensate for effects due to regional differences and to improve the signal-to-noise ratio (Fisher et al., 1985).
To date, most ice core studies on the Greenland ice sheet were carried out point
25
CPD
11, 2341–2388, 2015Spatial and temporal oxygen isotope variability in northern
Greenland
S. Weißbach et al.
Title Page
Abstract Introduction
Conclusions References
Tables Figures
◭ ◮
◭ ◮
Back Close
Full Screen / Esc
Printer-friendly Version
Interactive Discussion
Discussion
P
a
per
|
Discussion
P
a
per
|
Discussion
P
a
per
|
Discussion
P
a
per
|
influenced by the North Atlantic Oscillation (NAO) and are strongly related to southwest Greenland air temperatures. On the other hand, summer season stable water isotope ratios show higher correlations with North Atlantic sea surface temperature conditions (Vinther et al., 2010). In particular, northern Greenland has been little investigated so far, even though it differs significantly from the south in terms of lower air temperatures
5
and lower snow accumulation rates (Fischer et al., 1998c). Thus, the results from south-ern Greenland are not directly transferable to the northsouth-ern part. For a correct estimate of mass balances as well as the response to the ongoing climate change, knowledge of accumulation rates and the spatial distribution ofδ18O as a temperature proxy are important for the entire Greenland ice sheet. However, due to northern Greenland’s
10
remoteness its recent past climate has, up to now, only been little investigated.
Using the accumulation rates of the updated (compared to Friedmann et al., 1995; Schwager, 2000) Alfred-Wegener Institute (AWI) North-Greenland-Traverse (NGT) data, it was possible to show that the area of lower accumulation rates is much larger than expected before, which has a huge influence on the outlet glaciers (Weißbach
15
et al., 2015).
The NGT ice cores offer for the first time the possibility to study the spatial and tempo-ral variability of stable oxygen isotope records from northern Greenland. Furthermore, they allow the analysis of the common spatial stable water isotope signal in northern Greenland by stacking the individual records to significantly reduce the isotopic noise
20
that is present in a single data record due to local peculiarities.
The main objectives of this study are (1) to investigate the spatial variability ofδ18O in northern Greenland using this new set ofδ18O data and to evaluate the influence of isotopic noise on a single record, (2) to assess whether stable water isotope records from sites with low accumulation rates can be interpreted as climate signals, (3) to
25
CPD
11, 2341–2388, 2015Spatial and temporal oxygen isotope variability in northern
Greenland
S. Weißbach et al.
Title Page
Abstract Introduction
Conclusions References
Tables Figures
◭ ◮
◭ ◮
Back Close
Full Screen / Esc
Printer-friendly Version
Interactive Discussion
Discussion
P
a
per
|
Discussion
P
a
per
|
Discussion
P
a
per
|
Discussion
P
a
per
|
2 Material and methods
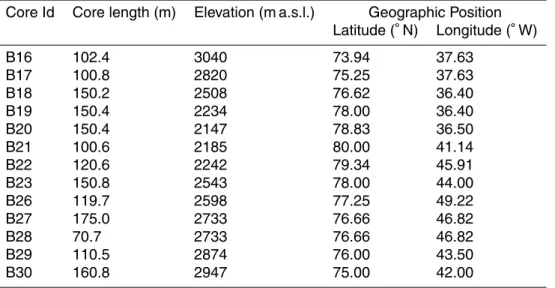
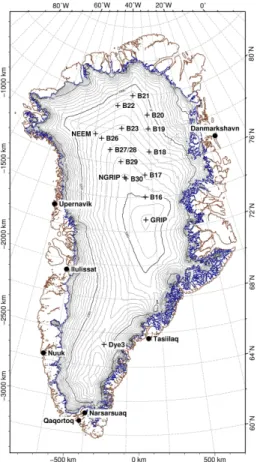
The ice cores presented here were drilled during the NGT from 1993 to 1995. In total, 13 ice cores (B16–B23, B26–B30) from 12 different sites (Table 1, Fig. 1) were drilled along the traverse route. The ice cores cover the last 500–1000 years. The drillings were accompanied by extensive surface snow studies (e.g. Schwager, 1999).
5
B21 and B23 as well as B26 to B30 are located on ice divides (Fig. 1) while B16–B20 were drilled east of the main ice divide. The NGRIP core (North Greenland Ice Core Project Members, 2004) was drilled 14.5 km northwest of B30 following the main ice divide and is therefore included in this study.
Before analyzing the stable water isotopes, a density profile of each core was
mea-10
sured. To do so, the single core segments (approximately 1 m long) were weighed in the field. Additional higher-depth resolution density records were determined us-ing gamma-absorption measurements in the AWI cold lab (Wilhelms, 1996). Finally, in 2012 density of the first 70 m of the three cores B19, B22 and B30 was analysed by X-ray computer tomography (X-CT, Freitag et al., 2013).
15
An exponential function fitted to the data taking into account all three types of density data with same respect was used to calculate water equivalent (w. eq.) accumulation rates and to synchronize the cores.
Selected parts of B30 were also analyzed for electrolytic conductivity using high resolution continuous flow analysis.
20
For the isotopic measurements the ice was cut in samples of 1–5 cm depth resolu-tion, corresponding to 2–10 samples year−1. After meltingδ18O was determined using mass spectrometers type Delta E und S from Finnigan MAT in the AWI laboratory with uncertainties less than 0.1 ‰ as determined from long-term measurements. The cores B27 and B28 were drilled at the same site. Parts of the core B27 (8.25–11.38 m water
25
CPD
11, 2341–2388, 2015Spatial and temporal oxygen isotope variability in northern
Greenland
S. Weißbach et al.
Title Page
Abstract Introduction
Conclusions References
Tables Figures
◭ ◮
◭ ◮
Back Close
Full Screen / Esc
Printer-friendly Version
Interactive Discussion
Discussion
P
a
per
|
Discussion
P
a
per
|
Discussion
P
a
per
|
Discussion
P
a
per
|
Six of the NGT cores (B16, B18, B20, B21, B26 and B29) were already dated up to a certain depth by annual layer counting (using density, major ions or δ18O) in prior studies (e.g. Fischer and Mieding, 2005; Fischer et al., 1998a, b; Schwager, 2000). Depending on the availability of data and differences in snow accumulation rates the dating quality of these cores varies between 1 and 5 years accuracy. For the other NGT
5
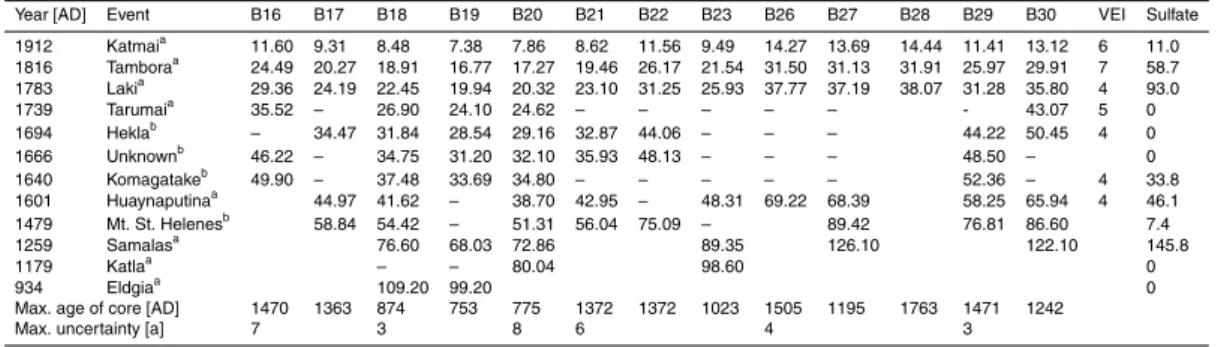
cores annual layer counting was not possible due to the very low accumulation rates. To achieve the same dating quality for all NGT cores for better comparison and to apply the dating on the whole core length, we used a new dating procedure for all cores. From density corrected (w. eq.) high resolution electrical conductivity profiles (Werner, 1995; Wilhelms, 1996) and SO24−-concentration profiles for B16, B18, B21 (Fischer
10
et al., 1998a, b), B20 (Bigler et al., 2002) and electrolytic conductivity profile (B30), distinct volcanic horizons were identified and used as match points to synchronize the cores (Table 2). Some of the volcanic eruptions show a more pronounced signal in the Greenlandic ice than others. Thus not all eruptions could be identified in every record. Between match points, the annual dating was assigned assuming a constant snow
15
accumulation rate. If a volcanic match point could not be clearly identified in an ice core, the next time marker was used to calculate the mean accumulation rate. Below the deepest volcanic match point, the last calculated accumulation rate was extrapolated until the end of the core.
3 Results
20
3.1 Depth-age models and snow accumulation rates
The last millennium was a volcanically active time (Sigl et al., 2013). The volcanic aerosols deposited on the Greenland ice sheet can be used as time markers. The depths of peaks in conductivity and sulfate concentration attributed to certain volcanic horizons are given in Table 2 as used for our dating approach.
CPD
11, 2341–2388, 2015Spatial and temporal oxygen isotope variability in northern
Greenland
S. Weißbach et al.
Title Page
Abstract Introduction
Conclusions References
Tables Figures
◭ ◮
◭ ◮
Back Close
Full Screen / Esc
Printer-friendly Version
Interactive Discussion
Discussion
P
a
per
|
Discussion
P
a
per
|
Discussion
P
a
per
|
Discussion
P
a
per
|
During the last 500 years, the time period between two detectable eruptions at NGT sites does not exceed 100 years for all the cores. This leads to a dating uncertainty for each core smaller than 10 years compared to the annually counted timescales (Mieding, 2005; Schwager, 2000), minimal at the matching points. The three youngest volcanic reference horizons (Katmai, Tambora and Laki), the eruption from 1257 AD
5
(Samalas), and 934 (Eldgia) were found in all cores, whereas the other eruptions could not be clearly identified in every ice core. We could not find a common pattern (e.g. distance, strength of the eruption) whether or not horizons could be observed in all records.
This already indicates a high spatial variability within the study region related to
sig-10
nificant influences of local to regional peculiarities (e.g. wind drift or sastrugi formation). An overview of the resulting mean accumulation rates for the entire core lengths for all NGT drilling sites as well as the respective ranges are given in Table 3. According to our dating, the cores reaching furthest back in time are B18, B19 and B20, covering more than the last 1000 years. These northeasterly cores have the lowest
accumula-15
tion rates with values below 100 kg m−2a−1 (B19: 94 kg m−2a−1, B20: 98 kg m−2a−1), whereas the highest mean accumulation rate is found for B27/28 in the southwest of our study region with 180 kg m−2a−1. Generally, the accumulation rate decreases from the sites located on the main ice divide in the south west of the study area to the north east.
20
The observed range of accumulation at one single site is highest for the southwest-ern cores (B30 and B29) ranging between 137 and 161 kg m−2a−1 (B29). Lowest val-ues are found for the cores east of the main ice divide (e.g. B17, B18 and B19) ranging between 113 and 119 kg m−2a−1(B17).
3.2 Spatial variability ofδ18O in northern Greenland
25
CPD
11, 2341–2388, 2015Spatial and temporal oxygen isotope variability in northern
Greenland
S. Weißbach et al.
Title Page
Abstract Introduction
Conclusions References
Tables Figures
◭ ◮
◭ ◮
Back Close
Full Screen / Esc
Printer-friendly Version
Interactive Discussion
Discussion
P
a
per
|
Discussion
P
a
per
|
Discussion
P
a
per
|
Discussion
P
a
per
|
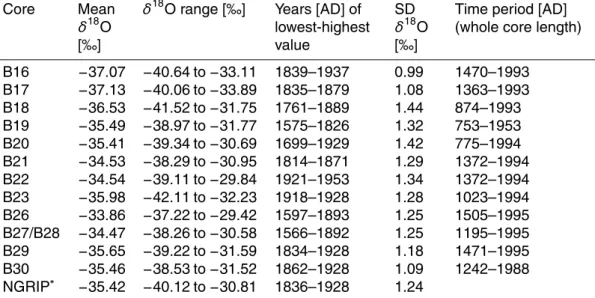
The length of the records varies depending on accumulation rate and total length of the core. The longest records are from B19 (back to 753 AD) and B20 (back to 775 AD). The following comparisons of the individual records refer to the longest common time window (1505–1953 AD). Although diffusion is known to change isotopic values in the snow, in this study the data were not corrected for diffusion effects because the very
5
low accumulation rates would hamper this calculation.
The lowest mean values (B16–B18) are found east of the main ice divide and north of the summit, but not at the summit as might be expected. Generally, the cores located east of the main ice divide show lower mean δ18O values than those located on the ice divide (Fig. 3a). For instance, B30, and B29 are on similar altitude and latitudes as
10
B16 and B17 but show significantly heavier values (Fig. 3a).
The maximum difference in meanδ18O values of individual ice cores is 3.3 ‰ (high-est meanδ18O in B26:−33.86 ‰, lowest meanδ18O in B17:−37.13 ‰). The standard deviation (SD) within each core in the common time window (1505–1953 AD) is lowest for B16 (0.99 ‰) and highest for B18 (1.44 ‰). We found no general relation between
15
accumulation rate and standard deviation of theδ18O values for all individual cores, even though the northern cores with generally lower accumulation rates show higher standard deviations than the southern cores.
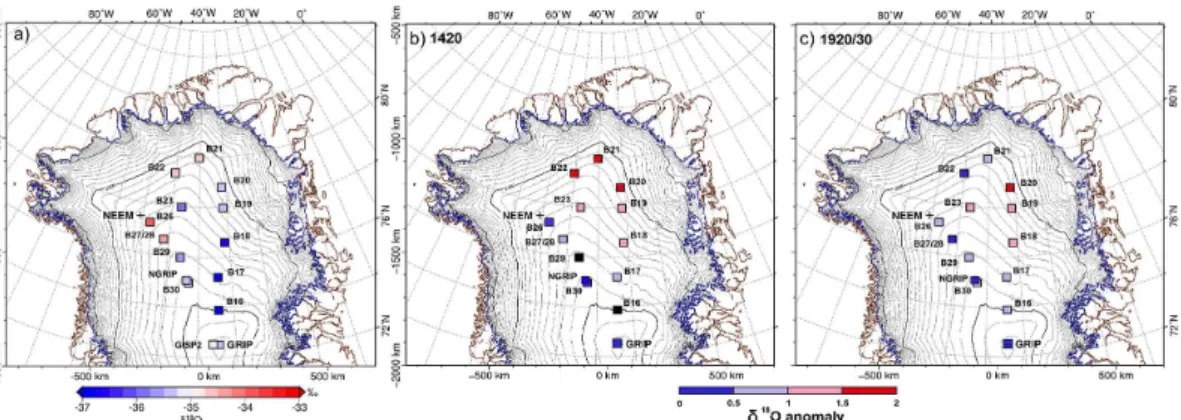
In Fig. 2, we compare our individual NGT δ18O records to other published Central to North Greenland (GRIP, GISP2, NGRIP)δ18O time series. Prominent decadal-scale
20
maxima and minima occurred mostly isochronally. However, specific events such as warm periods around 1420 AD or 1920–1930 AD or a cold period in the 17th century are more pronounced in the NGT cores compared to summit.
Some records show faster changes between warmer and colder events (e.g. GRIP, B30 and B26), while others (e.g. B17–B21) remain longer at values higher or lower
25
CPD
11, 2341–2388, 2015Spatial and temporal oxygen isotope variability in northern
Greenland
S. Weißbach et al.
Title Page
Abstract Introduction
Conclusions References
Tables Figures
◭ ◮
◭ ◮
Back Close
Full Screen / Esc
Printer-friendly Version
Interactive Discussion
Discussion
P
a
per
|
Discussion
P
a
per
|
Discussion
P
a
per
|
Discussion
P
a
per
|
or colder years. In general, the first half of the last millennium was characterized by longer warm or cold anomalies than the second half.
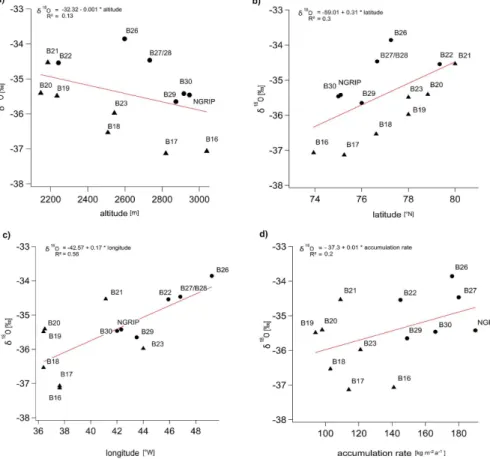
We investigated the relationship between the altitude, latitude and longitude of the drilling sites and the meanδ18O values (Fig. 4a–c), which are statistically significant (p <0.05) only for longitude and latitude. Among the factors influencing the mean
iso-5
topic composition, the longitude has the strongest impact (R2=0.56). Figure 4c shows the clear east-to-west gradient in the meanδ18O values in northern Greenland. In con-trast, the effect of the altitude is rather low (R2=0.13) and not statistically significant.
From the regression functions, we find that in northern Greenland δ18O values de-crease from north to south and west to east as well as from higher to lower altitudes
10
(Fig. 4).
Regarding snow accumulation rate we differentiate two groups: (I) cores with accu-mulation rates lower than 145 kg m−2a−1 mainly located east of the main ice divide (B16–B21 and B23) and (II) cores with higher accumulation rates (B22, B26–B30 and NGRIP). We find heavierδ18O ratios for sites with higher accumulation rates (Fig. 4d).
15
The relationship is weak but becomes stronger for higher accumulation rates.
The correlation coefficients between the annualδ18O-records of individual ice cores are relatively small (r =0.1 to 0.36,p <0.05). This can be partly explained by the fact that the 13 northern Greenland (NG) drilling sites (12 NGT and NGRIP) are up to 680 km apart from each other. The strongest correlations are found for the cores from
20
the southwest (B30–B26) and the lowest for those from the northeast (B19, B20). There is a significant linear relationship between the distance between the core sites and their annualδ18O correlation coefficient (r=−0.44,p <0.05). However, it is not always true that the cores with smallest distance between them have the highest correlations.
For smoothed values (5 year running mean) the correlation coefficients between the
25
CPD
11, 2341–2388, 2015Spatial and temporal oxygen isotope variability in northern
Greenland
S. Weißbach et al.
Title Page
Abstract Introduction
Conclusions References
Tables Figures
◭ ◮
◭ ◮
Back Close
Full Screen / Esc
Printer-friendly Version
Interactive Discussion
Discussion
P
a
per
|
Discussion
P
a
per
|
Discussion
P
a
per
|
Discussion
P
a
per
|
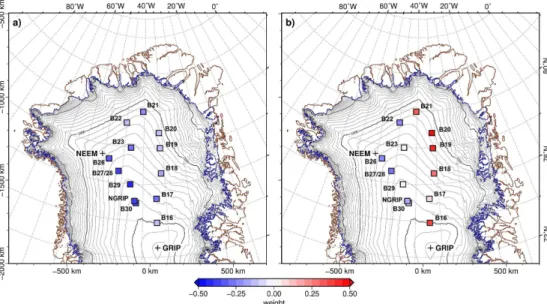
To study the regional-scale patterns of common variability of all annualδ18O records, we performed a principal component analysis (PCA). All calculations are done for the largest common time window of all cores (1505–1953 AD). Other time periods were used as well, and they show similar results.
Only the first two principal components (PC1 and PC2) are above the noise level. The
5
first two eigenvectors of the isotopic time series explain 34.1 % of the total variance (PC1: 21.8 %, PC2: 12.3 %). The other PCs are dominant in one or two records but are not significant for the total variance of the entire dataset. The loading patterns are mapped in Fig. 5 and show a homogeneus pattern for PC1 and a bipolar result for PC2.
3.3 The northern Greenlandδ18O-stack
10
To reduce the noise in the singleδ18O records, we calculated a stacked record by aver-aging the 13 annual NGδ18O records in their overlapping time periods (Fig. 6). Before stacking, all records were centred and normalized regarding their common time window (1505–1953 AD). The SD of the NG-stack (0.44 for 1505–1953 AD) is less than half of the SD in annualδ18O records of the individual cores. Also Vinther et al. (2010) make
15
clear that stacking is important to improve signal-to-noise ratio in low accumulation rate areas. Local drift noise would account for half of the total variance in single-site annual series (Fisher et al., 1985).
As the NG-stack before 1000 AD is based on only four records (<25 % of the to-tal core numbers), we decided to focus in the following only on the time period after
20
1000 AD.
To investigate the relationship of the NG-stack with air temperature, we used monthly meteorological observations from coastal southwest Greenland sites and Stykkishol-mur in Northwest Iceland available from the Danish Meteorological Institute (DMI – http://www.dmi.dk; 1784–1993 AD) and the Icelandic Meteorological Office (http:
25
tem-CPD
11, 2341–2388, 2015Spatial and temporal oxygen isotope variability in northern
Greenland
S. Weißbach et al.
Title Page
Abstract Introduction
Conclusions References
Tables Figures
◭ ◮
◭ ◮
Back Close
Full Screen / Esc
Printer-friendly Version
Interactive Discussion
Discussion
P
a
per
|
Discussion
P
a
per
|
Discussion
P
a
per
|
Discussion
P
a
per
|
perature records longer than 200 years for our study even though they are in large distance (706–2206 km).
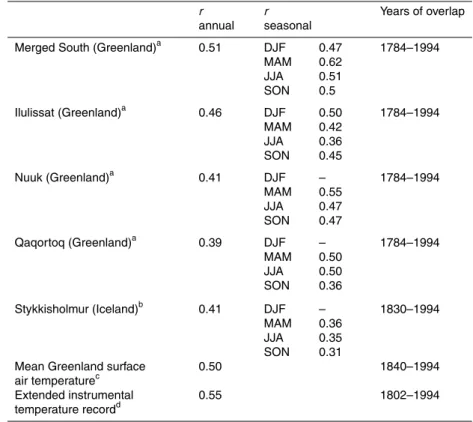
The correlation coefficients between the NG-stack and these air temperature records are shown in Table 5. Dating uncertainties are taken into account by comparing 5 year running means. The NG-stack shows low but significant (p <0.001) correlations to the
5
air temperatures at all sites (Table 5).
The strongest correlation with annual mean temperature was found for the merged station data at Greenland’s southeast coast (r=0.51), and the temperature recon-struction for the North Atlantic Arctic boundary region of Wood et al. (2010) (r=0.55); the lowest was found for Qaqortoq (r =0.39) also in the south of Greenland (Table 5).
10
For Stykkisholmur the correlation is in the range of the Greenlandic ones (r=0.41). Slightly higher correlations are obtained by comparing the NG-stack to seasonal data. Except for Ilulissat, winter months (DJF) show weaker correlations; spring (MAM) and summer (JJA) months show stronger correlations to the NG-stack.
Although the NG-stack record shows some correlation with temperature data from
15
coastal Greenland sites, it remains an open question, how the NG-stackδ18O varia-tions can be converted to absolute temperature changes within North–East Greenland during the last millennium.
For more than 30 years such conversion of isotopic time series of Greenland ice cores was based on a modern analogue approach taking the observed spatial
iso-20
tope/temperature gradient of 0.67± −0.2 ‰◦C−1 (Dansgaard, 1964; Johnsen et al., 1989) as a valid calibration for converting isotope records of Greenland ice cores into temperature changes (e.g. Grootes et al., 1993). The strong confidence of glaciolo-gists into this approach came principally from two observations. (1) Over both polar ice sheets, the spatial correlation between modern isotope and annual mean temperature
25
CPD
11, 2341–2388, 2015Spatial and temporal oxygen isotope variability in northern
Greenland
S. Weißbach et al.
Title Page
Abstract Introduction
Conclusions References
Tables Figures
◭ ◮
◭ ◮
Back Close
Full Screen / Esc
Printer-friendly Version
Interactive Discussion
Discussion
P
a
per
|
Discussion
P
a
per
|
Discussion
P
a
per
|
Discussion
P
a
per
|
However, for the Greenland area this long time accepted approach has been chal-lenged during the last decade. Two entirely independent analytic techniques, one based on the numerical interpretation of borehole temperatures (e.g. Dahl-Jensen et al., 1998) and the other based on the occlusion process of gases into the ice (e.g. Buizert et al., 2014; Severinghaus et al., 1998) allow a direct temperature
re-5
construction at least for some periods of the past. Consistently both methods point to much lower temporalδ18O T−1 slopes ranging between 0.4–0.3 ‰◦C−1(Jouzel et al., 1997a). Consequently they indicate a much higher temperature variability in Green-land during the last glacial period. For the period of the last 9000 years the GreenGreen-land average Holocene isotope–temperature relationship has been estimated to be 0.44–
10
0.53 ‰◦
C−1
again substantially lower as the modern spatial gradient (Vinther et al., 2009). However, as all these studies cover much longer time periods as compared to our NG-stack records, no firn conclusion can be drawn from these studies about an appropriate isotope–temperature relationship for the last millennium.
Along the NGT firn temperature measurements in about 15 m depth had been done.
15
But due to their small range of about 2 K difference it is difficult to reassess the general Greenland isotope temperature relationship from Johnsen et al. (1989) from the NGT data, solely. Schwager (2000) added data from Dansgaard et al. (1969) from along the EGIG traverse, which was also used in Johnsen et al. (1989), to expand the temper-atures range to derive a more reliable isotope-temperature gradient. This calculated
20
gradient of 0.7± −0.2 ‰◦C−1is within the gradient uncertainty range given by Johnsen et al. (1989). Using our updated NGT dataset we get the same results.
If we apply the spatial isotope/temperature gradient of 0.7 ‰◦
C−1
for the range of isotope variations (−1.43 to 2.51 ‰) of the NG-stack record, the isotope data would translate into temperature changes of−2.04 to 3.59◦C within the last millennium.
How-25
ever, applying instead a temporal gradient of 0.48 ‰◦
C−1
CPD
11, 2341–2388, 2015Spatial and temporal oxygen isotope variability in northern
Greenland
S. Weißbach et al.
Title Page
Abstract Introduction
Conclusions References
Tables Figures
◭ ◮
◭ ◮
Back Close
Full Screen / Esc
Printer-friendly Version
Interactive Discussion
Discussion
P
a
per
|
Discussion
P
a
per
|
Discussion
P
a
per
|
Discussion
P
a
per
|
gradients reported by Buizert et al. (2014) would result in comparable temperature changes.
The resulting temperature ranges are larger than expected (e.g. Dahl-Jensen et al., 1998) which is an additional argument not to calculate absolute temperatures from the NG-stack with the given gradients.
5
We conclude that any conversion of the NG-stack isotope record into absolute tem-perature variations during the last millennium is highly uncertain. Thus, for the following part of the manuscript, we will refer to NG-stack isotope anomalies as relative temper-ature changes in terms of “warmer” (i.e. isotopically enriched) and “colder” (isotopically depleted), only, but refrain from converting our ice core data into absolute temperature
10
changes.
3.4 Last millennium climate from stacked NGδ18O record
The NG-stack covers the time between 753 AD and 1994 AD (Fig. 6). For a better visu-alisation of decadal to centennial scale variability a 30 year running mean is added. The running mean shows the warmest period around 1420 AD and the coldest in 1680 AD.
15
The isotopically warmest single year during the last 1000 years in northern Greenland was 1928 AD, whereas 1835 AD was the coldest.
Distinct decadal- to centennial-scale warm and cold anomalies can be detected in the stacked (Fig. 6) as well as individualδ18O records (Fig. 2) and are partly re-lated to well-known climate anomalies such as the Medieval Climate Anomaly (MCA,
20
950–1250 AD, Mann et al., 2009), the Little Ice Age (LIA, 1400–1700 AD, Mann et al., 2009) and Early Twentieth Century Warming (ETCW 1920–1940 AD, Semenov and Latif, 2012).
We find a pronounced warm period from 850 to 1100 AD, which has its maximum between 900 and 1000 AD. This is about 100 years earlier than the described MCA in
25
CPD
11, 2341–2388, 2015Spatial and temporal oxygen isotope variability in northern
Greenland
S. Weißbach et al.
Title Page
Abstract Introduction
Conclusions References
Tables Figures
◭ ◮
◭ ◮
Back Close
Full Screen / Esc
Printer-friendly Version
Interactive Discussion
Discussion
P
a
per
|
Discussion
P
a
per
|
Discussion
P
a
per
|
Discussion
P
a
per
|
A longer period of cold temperatures occurred during the 17th and early 19th century and was already attributed to the LIA by a prior NGT study that used only 4 cores (B16, B18, B21 and B29, Fischer et al., 1998c). A cold period in northern Greenland corresponding to the LIA is later than reconstructed for the Northern Hemisphere by Mann et al. (2009), with lowest values during 1620–1780 AD and in the first half of the
5
19th century. Interestingly, the warmest mean values of the last 1000 years at 1420 AD lie within the timeframe of LIA.
A clear, but compared to other periods not outstanding, warm event corresponding to the ETCW is in the early 20th century. Since the 1870s AD, the values are above the 1000 year mean. At the end of the 20th century, the temperature stagnates at a high
10
mean level. However, as the NGT cores were drilled between 1993 and 1995 AD, the warmest years of the recent decades (Wood et al., 2010) are not included in our record. For the NG-stack as well as most of the individual NGT cores the isotopically warmest periods besides the 1420 AD event were in the 10th and 20th centuries, in particular between 1900 and 1950 AD. These years are even warmer than the most
15
recent years covered by the NGT cores (i.e. the 1980s).
4 Discussion
4.1 Regionalδ18O variability in northern Greenland
Stable water isotope ratios in ice are widely used as a proxy for air temperature (Dans-gaard, 1964; Johnsen et al., 1995; Jouzel et al., 1997b). In this section, we will discuss
20
the representativity of a single ice core δ18O-record in northern Greenland and the influence of different aspects as changes in altitude, latitude, longitude or accumula-tion rate on the stable water isotope ratio. The comparison to direct air-temperature observation data and proxy data allows to assess the quality of the proxy in terms of paleo-climatological interpretation.
CPD
11, 2341–2388, 2015Spatial and temporal oxygen isotope variability in northern
Greenland
S. Weißbach et al.
Title Page
Abstract Introduction
Conclusions References
Tables Figures
◭ ◮
◭ ◮
Back Close
Full Screen / Esc
Printer-friendly Version
Interactive Discussion
Discussion
P
a
per
|
Discussion
P
a
per
|
Discussion
P
a
per
|
Discussion
P
a
per
|
4.1.1 Spatial distribution
Variability inδ18O is dependent on local (e.g. wind), regional (e.g. position on the ice sheet) and large-scale (e.g. circulation patterns) processes. Even adjacent cores may differ considerably according to snow drift (Fisher et al., 1985). In this study, and as expected from the large distances between the drilling sites, correlations between the
5
δ18O-records are generally relatively low (r <0.36 for annual values). One further rea-son for the lower correlations may be attributed to dating uncertainties. As smoothing the data does not increase the correlation coefficient significantly (stillr <0.5 for 5 year running mean values), we conclude that different regional influences on theδ18O val-ues play a more important role. All cores with the higher correlations (B23, B26, B27/28,
10
B29 and B30) are located in the same area in the western part of northern Greenland whereas all other cores are located more to the east.
The PC1 has negative loadings on all the time series and therefore represents a ho-mogenous regional-scale pattern even though the loadings for the cores on the ice divide are higher. In contrast, PC2, as the second strongest influence, shows a
pro-15
nounced east–west difference (Fig. 5). A similar pattern with distinct differences be-tween the main ice divide region and the eastern region can also be found in several other aspects.
We found lighter δ18O values in the southern and eastern part of northern Green-land in contrast to the general speculations of Dansgaard (1954), who expected lighter
20
values northward. The east-to-west difference is also expressed by the dependency ofδ18O values on longitude (Fig. 4). This is in line with results from Box (2002), who found that there is often an opposite trend in air temperatures in east and west Green-land. The antiphase of temperature records from east and west Greenland is may be explained by the importance of different weather regimes (e.g. Ortega et al., 2014).
25
CPD
11, 2341–2388, 2015Spatial and temporal oxygen isotope variability in northern
Greenland
S. Weißbach et al.
Title Page
Abstract Introduction
Conclusions References
Tables Figures
◭ ◮
◭ ◮
Back Close
Full Screen / Esc
Printer-friendly Version
Interactive Discussion
Discussion
P
a
per
|
Discussion
P
a
per
|
Discussion
P
a
per
|
Discussion
P
a
per
|
deviations (SD) inδ18O, which can be partly explained by the fact that a smaller number of accumulation events scatters easier.
The east-to-west difference is also detectable in the temporal variability of the annual
δ18O values. Cores with more rapid fluctuations are from summit and the main ice divide, while those cores drilled east of the divide have longer periods of positive or
5
negative anomalies. We conclude that east of the divide, the climate conditions are not as variable and therefore the annualδ18O signal is of greater persistence.
Taking all these aspects together, we argue that the main ice divide has a large influence on the spatialδ18O pattern representing temperatures.
The main ice divide separates the Greenland ice sheet into eastern and western
re-10
gions (Fig. 1). Cyclonic activity is most important for the precipitation over Greenland. Cyclones forming over Hudson Bay or Baffin Bay and winds from the west or south-west transport air masses to Greenland (Chen et al., 1997). The cyclonic influence decreases from south to north and from west to east because of the blocking influence of the summit and the main ice divide. Furthermore, we observe a stronger isotope–
15
altitude relationship for the cores on the ice divide (r=0.96). This may be explained by different atmospheric circulation conditions allowing additional moisture from other sources to reach the region east of the ice divide. This is supported by the finding of Friedmann et al. (1995) which suppose based on data from B16 to B19 that northeast Greenland receives more moisture from local sources as the Greenlandic Sea, Atlantic
20
Ocean and the Canadian Wetland, in particular during summer.
Buchardt et al. (2012) noted that the relationship between accumulation rate and
δ18O is not distinct for Greenland. They see the “foehn effect” (dry warm wind in the lee of the ice divide) as one reason. The foehn effect causes an anticorrelation be-tweenδ18O and accumulation rate, which is not seen in central Greenland but on the
25
CPD
11, 2341–2388, 2015Spatial and temporal oxygen isotope variability in northern
Greenland
S. Weißbach et al.
Title Page
Abstract Introduction
Conclusions References
Tables Figures
◭ ◮
◭ ◮
Back Close
Full Screen / Esc
Printer-friendly Version
Interactive Discussion
Discussion
P
a
per
|
Discussion
P
a
per
|
Discussion
P
a
per
|
Discussion
P
a
per
|
B16, B17 and B18 have the lowest meanδ18O values (about−37 ‰) observed so far in northern Greenland and maybe also the lowest in Greenland. This is in contrast to the findings of Ohmura (1987), who suggested for this region temperatures similar to summit. Figure 4 indicates that accumulation, latitude and altitude may have minor impact on theδ18O values here. One possible explanation would be additional moisture
5
isotopically depleted during the transport from rather northern directions.
The cores more to the north (B19–B22) were drilled at lower altitude and therefore record different climate signals (i.e. from lower air masses) compared to the high al-titude ice cores that, in turn, record a more smoothed signal of higher atmospheric layers. Similar effects were observed e.g. in Svalbard (Isaksson et al., 2005), even
10
though in considerably lower altitudes compared to Greenland.
Johnsen et al. (1989) found a regression slope of δ18O with respect to latitude δ(δ18O)/δ(latitude)=−0.54 ‰ degree−1 and with respect to altitude
δ(δ18O)/δ(altitude)=−0.006 ‰ m−1for large areas of Greenland.
The multiple linear regressions show enormous uncertainties of the elevation and
15
latitude relationship. Using the parameters given by Johnsen et al. (1989), it is not possible to calculate certain δ18O relationships to altitude and geographic position from northern Greenland’s ice cores. However, using different tuning factors for the Johnsen model, it was possible to accomplish almost equal R2 (∼0.8) for northern Greenland’sδ18O values compared to the Johnsen et al. (1989) results. Applying this
20
approach to our data, we find δ(δ18O)/(δ(latitude)=−0.30 (±0.40) ‰ degree−1 and
δ(δ18O)/δ(altitude)=−0.0035 (±0.0024) ‰ m−1. The regression residuals are linearly related to longitude as well as accumulation rate (Fig. 7).
This justifies that for northern Greenland ice cores, the differences in mean δ18O can be largely explained by geographic gradients in topography (i.e. altitude, latitude
25
and longitude) and accumulation rate. Thus, we assume that the variability in the NG stackedδ18O record represents past temperature development.
NG-CPD
11, 2341–2388, 2015Spatial and temporal oxygen isotope variability in northern
Greenland
S. Weißbach et al.
Title Page
Abstract Introduction
Conclusions References
Tables Figures
◭ ◮
◭ ◮
Back Close
Full Screen / Esc
Printer-friendly Version
Interactive Discussion
Discussion
P
a
per
|
Discussion
P
a
per
|
Discussion
P
a
per
|
Discussion
P
a
per
|
stack (r =−0.97, p≪0.01). This leads to the conclusion that 22 % of the signal in the northern Greenlandδ18O records can be interpreted as a regional climate signal. This is supported by the fact that Vinther et al. (2010) found for their PC1 from winter
δ18O values from southern Greenland’s ice cores a strong correlation (r=0.71) to air temperature data.
5
The main divide influences the pathways of air masses, causing the “foehn effect” and thus lower accumulation rates in the east. Thus we conclude that the largest part of the spatial differences inδ18O values in northern Greenland is caused by the influence the topography of the ice sheet on the regional climate system.
4.1.2 Paleoclimatic significance of the stackedδ18O
10
As the NG-stack is a result of 13 ice cores over a large area we assume its regional rep-resentativity. From the PCA we know that the first two PC’s are significantly correlated to the NG-stack, which supports the validity of the stack.
A direct comparison of the δ18O and direct air temperature measurements is hin-dered by the distance between drill sites and weather stations and results in relatively
15
low correlations (Table 5). Comparably low correlations between annualδ18O means and measured temperatures from coastal stations are also reported for the NEEM record (Steen-Larsen et al., 2011).
However, the rather low correlation coefficients might underestimate the real regional
δ18O-temperature relations because of different reasons.
20
We expect that the most important reasons are the large distances and the difference in altitude (i.e. more than 2000 m) between drill sites and the meteorological stations, which let them receive different atmospheric signals. The stations are located at the coast and are in turn also likely influenced by local factors as the occurrence of sea ice. The difference in altitude is also one important fact causing the differences in GRIP
25
and DYE3 borehole temperature data (Dahl-Jensen et al., 1998).
CPD
11, 2341–2388, 2015Spatial and temporal oxygen isotope variability in northern
Greenland
S. Weißbach et al.
Title Page
Abstract Introduction
Conclusions References
Tables Figures
◭ ◮
◭ ◮
Back Close
Full Screen / Esc
Printer-friendly Version
Interactive Discussion
Discussion
P
a
per
|
Discussion
P
a
per
|
Discussion
P
a
per
|
Discussion
P
a
per
|
distributed. However, it is not possible to generate sub-annual data for northern Green-land ice cores due to low accumulation. We find a tendency to stronger correlation be-tween the annualδ18O and summer (JJA,r=0.35–0.51) and spring (MAM,r=0.36– 0.62) temperatures for most of the stations. This points to a higher proportion of sum-mer snow in the annual accumulation in northern Greenland, too.
5
Also regional noise factors such as wind drift and sastrugi formation as well as un-certainties in ice core dating and the usage of very old observation data have to be taken into account.
In summary, we consider the northern Greenland δ18O stacked record as a reli-able proxy for annual temperature for northern Greenland. The regional
representative-10
ness of the NG-stack is supported by the general similarity to the NEEMδ18O record (Masson-Delmotte et al., 2015) for the period 1724–1994 AD. Even single events such as the highest values in 1928 AD and the 1810–1830 AD cooling occur in both records. To assess regional differences within northern Greenland, stacks of subsets of cores will be discussed in terms of interpretation as a temperature proxy. As illustrated in
15
Fig. 4, we differentiate two different types of cores, cores drilled on the ice divide and cores drilled east of the ice divide. Accordingly, in Fig. 6 the overall northern Greenland
δ18O stack used in this study is compared to a stack of the cores of lower accumulation rate drilled east of the main ice divide (B16, B17, B18, B19, B20, B21 and B23) (group I) and a stack of those on the ice divide (B22, B26, B27, B29, B30 and NGRIP) (group II)
20
(Fig. 8).
Even though there is a similar overall trend, the three records show differences in amplitude and timing of warm and cool events. The correlation between the two sub-stacks is rather low (r=0.71). In the 11th and 12th centuries, we observe a quasi-anti-correlation between group I and group II. Even during the well-known climate events
25
CPD
11, 2341–2388, 2015Spatial and temporal oxygen isotope variability in northern
Greenland
S. Weißbach et al.
Title Page
Abstract Introduction
Conclusions References
Tables Figures
◭ ◮
◭ ◮
Back Close
Full Screen / Esc
Printer-friendly Version
Interactive Discussion
Discussion
P
a
per
|
Discussion
P
a
per
|
Discussion
P
a
per
|
Discussion
P
a
per
|
two sub-stacks. In group I (east, low accumulation rate) events like the 1420 AD or the first part of the LIA show a higher amplitude.
The stack of group I (east, low accumulation rate) has a higher correlation to the total NG-stack (r =0.96) compared to group II (r=0.67) for the period 994–1994 AD. Looking at the time period 1505–1993 AD with a high number of cores included in both
5
sub-stacks, the correlation coefficients to the total NG-stack are almost equal (group I:
r=0.95, group II: r =0.90, p <0.1). Here, both records reflect the mean changes in
δ18O for northern Greenland. Differences before 1505 AD may be artefacts of low core numbers even though regional differences in climate conditions cannot be ruled out.
We consider the NG-stack as a climate record confirms our interpretation of PC1,
10
and displays the overall climate variation independent of local influences as topogra-phy or accumulation rate. In contrast, results from studies with only one record become uncertain, as they may be affected by a lower signal-to-noise ratio and a higher influ-ence of other local non-climate effects.
4.2 Temporal variability of arcticδ18O values and their forcing factors
15
To set the results in an Arctic-wide context we compare our northern Greenland tem-perature record (NG-stack) to ice-core records from Siberia (Akademii Nauk – AN, Opel et al., 2013), Canada (Agassiz Ice Cap – Agassiz, Vinther et al., 2008), Svalbard (Lomonosovfonna – Lomo, Divine et al., 2011) and south Greenland (Dye3, Vinther et al., 2006b) as well as a multi-proxy reconstruction of annual Arctic SAT (Arctic2k,
20
PAGES 2k Consortium, 2013; Fig. 9) that cover our time period.
Note that some of these time series (Agassiz, Arctic2k) are also stacked records with a wider regional representativeness, whereas others are single records (Dye3, AN, Lomo), which influences the strength of correlation due to different signal-to-noise ratios. For the discussion of the temperature record, we concentrate on the smoothed
25
values (30 year running means).
CPD
11, 2341–2388, 2015Spatial and temporal oxygen isotope variability in northern
Greenland
S. Weißbach et al.
Title Page
Abstract Introduction
Conclusions References
Tables Figures
◭ ◮
◭ ◮
Back Close
Full Screen / Esc
Printer-friendly Version
Interactive Discussion
Discussion
P
a
per
|
Discussion
P
a
per
|
Discussion
P
a
per
|
Discussion
P
a
per
|
of the NGT cores (B16, B18 and B21) are used to generate this multi-proxy record. The aim of PAGES 2k was to generate an Arctic wide representative record. In total, 59 records including 16 ice cores were used. NGT cores represent only 3 out of these 59 records. The correlation coefficient between the stacked anomalies of B16, B18 and B21 and the Arctic2k temperature is small (r =0.24) so we can assume that the NGT
5
records do not dominate the reconstruction.
We conclude that a good correlation between the NG stack and the Arctic2k record show that the temperature in northern Greenland follows in general the Arctic-wide mean temperature.
The Lomonosovfonna record is interpreted as a winter record and has only a weak
10
correlation to the NG-stack (r=0.22). More summer snow in northern Greenland com-pared to Lomonosovfonna could be one possible explanation for the weak correlation between both records.
On a short-term scale, there are differences in the well-known climatic events (MCA, LIA and ETWC; Fig. 9), which are reflected with different intensity in theδ18O values
15
and show spatial patterns.
The Lomonosovfonna, Akademii Nauk and Arctic2k records show significantly more enrichedδ18O values during the MCA. However, smaller events of abnormal warm tem-peratures during the MCA are observed for Agassiz and Dye3. Our NG-stack shows warmer values earlier than the MCA time period given by Mann et al. (2009). We
con-20
clude that further north in the Arctic the warm events during MCA are less pronounced or earlier in timing.
The Lomonosovfonna and Arctic2k records show a dominant cold period during the LIA from 1580 to 1870 AD. Also, our northern Greenland as well as the Agassiz and Akademii Nauk ice cores reveal distinct LIA cooling periods in contrast to the Dye3 ice
25
CPD
11, 2341–2388, 2015Spatial and temporal oxygen isotope variability in northern
Greenland
S. Weißbach et al.
Title Page
Abstract Introduction
Conclusions References
Tables Figures
◭ ◮
◭ ◮
Back Close
Full Screen / Esc
Printer-friendly Version
Interactive Discussion
Discussion
P
a
per
|
Discussion
P
a
per
|
Discussion
P
a
per
|
Discussion
P
a
per
|
Between 1920 and 1940 AD, there was a major warming period in the Arctic, known as ETCW and observed in all shown records here. Chylek et al. (2006) determined from meteorological data that the 1920–1930 warming was stronger than the 1995–2005 warming. For the NG-stack and Akademii Nauk record, the ETCW was warmer than the second half of the 20th century, which distinguishes them from other shown records.
5
The ETCW is assumed to be independent of external forcing but caused by internal climate variability, in particular sea ice-atmosphere feedbacks (Wood and Overland, 2010). This let us conclude that northern Greenland may also be a good place to study forcing independent climate changes.
However, natural external forcing (i.e. insolation, solar irradiance and volcanic
erup-10
tions) is assumed to influence the temperature that can be studied from northern Greenland’s ice cores.
In general, higher solar activity causes higher temperatures (as during the MCA) whereas cold periods (e.g. LIA) are dominated by lower solar activity (Ammann et al., 2007). Based on some of the NGT records (B16, B18, B21 and B29),
Fis-15
cher et al. (1998c) explained most of the long-term variation in northern Greenland by changes in solar activity.
Volcanism causes strong negative radiative forcing (Robock, 2000). It is assumed that volcanic eruptions inject large quantities of sulfur-rich gases into the stratosphere and global climate can be cooled by 0.2–0.3◦C for several years after the eruption
20
(Zielinski, 2000). Results from Crowley (2000) indicate that volcanism generally ex-plains roughly 15–30 % of the variability in global temperatures.
Miller et al. (2012) argued that century-scale cold summer anomalies of which the LIA represents the coldest one, occur because natural forcing is either weak or, in the case of volcanism, short-lived. PAGES 2k Consortium (2013) shows that periods
25
CPD
11, 2341–2388, 2015Spatial and temporal oxygen isotope variability in northern
Greenland
S. Weißbach et al.
Title Page
Abstract Introduction
Conclusions References
Tables Figures
◭ ◮
◭ ◮
Back Close
Full Screen / Esc
Printer-friendly Version
Interactive Discussion
Discussion
P
a
per
|
Discussion
P
a
per
|
Discussion
P
a
per
|
Discussion
P
a
per
|
To check the impact of volcanic eruptions on the temperature of northern Green-land, we compared theδ18O values of the high-resolution data of the individual NGT cores as well as of the stacked record 5 years before and after major volcanic eruption (Table 2).
Not in all cases are eruptions followed by a distinct cold period. For example the
5
Tambora eruption in 1815/16 AD or Huyanaputina in 1601 AD took place within a gen-eral cold period in northern Greenland (Fig. 2), and a possible additional cooling effect cannot be clearly attributed to the volcanic eruptions. For the Mt. St. Helens eruption in 1479 AD, we see an ongoing warming trend, whereas the 1259 AD eruption took place during an ongoing cooling. Thus the eruption cannot be the reason for the onset of
10
the cold period. After the Katmai eruption in 1912 AD, we observe a cooling in some of the cores with higher accumulation rate (e.g. B29 and B26). The cores with the lowest accumulation rates (B17–B21) do not show any temperature response to the volcanic eruption.
Thus, there is no general direct relationship between volcanic eruptions and cooling
15
in northern Greenland; neither in the NG-stack nor in the singleδ18O records. It was therefore also not possible to distinguish between equatorial and Icelandic volcanoes.
The reconstructions of Box et al. (2009) showed that volcanic cooling is concentrated in western Greenland, which is consistent with the findings from instrumental records (Box, 2002; Robock and Mao, 1995), and is largest in winter as the dynamically active
20
season. From our dataset, we conclude as Fischer et al. (1998c) that volcanic climate forcing is limited in northern Greenland.
As Swingedouw et al. (2015) argue it also might be possible that the direct cooling response of volcanic eruptions is first to the ocean and only after years seen in theδ18O values from ice cores which complicates the study of cooling after volcanic eruptions
25
from ice core data.
CPD
11, 2341–2388, 2015Spatial and temporal oxygen isotope variability in northern
Greenland
S. Weißbach et al.
Title Page
Abstract Introduction
Conclusions References
Tables Figures
◭ ◮
◭ ◮
Back Close
Full Screen / Esc
Printer-friendly Version
Interactive Discussion
Discussion
P
a
per
|
Discussion
P
a
per
|
Discussion
P
a
per
|
Discussion
P
a
per
|
The Atlantic Multidecadal Oscillation, AMO, could be one possible influence causing these low-frequency oscillations. As AMO index reconstruction (Gray et al., 2004) does not cover the time between 1100 and 1600 AD, we only can speculate about an influ-ence in that time due to the similar periodicity. For the time period 1567–1990 AD, the correlation between the NG-stack and the AMO index is weak (r=0.06), which might
5
be due to the uncertainties in historical AMO data. However, since 1800 AD we observe a higher correlation coefficient (r =0.66,p <0.05) implying a possible relation.
One of these warmer periods is about 1420±20 AD, an abnormal warm event which is observed in our northern Greenland record and has not been pointed out in other ice core studies before. The event is observable in all nine NGT cores covering this time
10
(Fig. 2) as well as in NGRIP but not in the temperature records from southern Green-land as the Dye3 ice core (Fig. 9). One reason here might be the specific geographical position in the North.
Furthermore, we observe a difference between the Canadian and Siberian Arctic regarding the 1420-event. Unlike the Siberian Akademii Nauk ice core, theδ18O values
15
of the Agassiz cores from Ellesmere Island also show a trend to more enriched values in that period but not as strong as in northern Greenland.
The fact that the 1420 event is not clearly noticeable in other surrounding Arctic ice cores emphasizes that this event may have occurred on a smaller regional scale. However, it seems to have been of dominant influence and is also reflected in a smaller
20
warming for the Arctic2k record (Fig. 9).
The spatial distribution of the 1420 event in northern Greenland is mapped in Fig. 3b. The event is strongest in the upper north and shows a different pattern than theδ18O anomalies of the 1920–1930 warm phase, which is also attributed to internal variability and is strongest in the northeast of Greenland.
25
CPD
11, 2341–2388, 2015Spatial and temporal oxygen isotope variability in northern
Greenland
S. Weißbach et al.
Title Page
Abstract Introduction
Conclusions References
Tables Figures
◭ ◮
◭ ◮
Back Close
Full Screen / Esc
Printer-friendly Version
Interactive Discussion
Discussion
P
a
per
|
Discussion
P
a
per
|
Discussion
P
a
per
|
Discussion
P
a
per
|
in northern Greenland. As we see no forcing anomaly, we interpret the 1420-event as caused by internal Arctic climate dynamics with a sea-ice-atmospheric feedback.
Box (2002) argued that climate variability in Greenland is linked to the Northern Os-cillation (NAO), volcanism and sea ice extent. NAO (Vinther et al., 2003) is calculated to be weakly reflected (r =−0.2,p <0.01) in the NG-stack, similar to White et al. (1997)
5
for summit ice cores, whereas none of the single NGT records is significantly cor-related (p <0.05) to the NAO index. The NG-stack has an increased signal-to-noise level, which is why the correlation here might be clearer than from individual records. Also, the sub-stack of the records on the ice divide (group II) as well as those east (group I) are significantly correlated (r=−0.19 and−0.17,p <0.05) to the NAO index.
10
The cores east of the main ice divide are expected to be out of the major cyclonic track. We conclude that NAO is not of major importance for northern Greenlandδ18O values. Around 1420 AD, an anti-correlation between sea-ice extent in the Arctic Ocean (Kin-nard et al., 2011) and theδ18O values is observed (Fig. 10). The sea ice in the Arctic Ocean shows a recession in this time of warm temperatures in northern Greenland.
15
A shrunken sea ice extent would cause higher temperatures on a regional scale and would increase the amount of water vapour from local sources. Therefore, compared to distant sources, more isotopically-enriched moisture (Sime et al., 2013) may contribute to precipitation in northern Greenland, in particular east of main ice divide.
However, we do not see any direct relationship between sea-ice extent and our
NG-20
stack during the rest of time. The used sea ice record is an Arctic-wide one, which means that the climatic events of regional extent do not have to be always reflected in the sea ice extent record. Nevertheless, also the recent NEEMδ18O record from north-west Greenland, shows a generally close relationship with the Labrador Sea/Baffin Bay sea ice extent (Masson-Delmotte et al., 2015; Steen-Larsen et al., 2011).
25
CPD
11, 2341–2388, 2015Spatial and temporal oxygen isotope variability in northern
Greenland
S. Weißbach et al.
Title Page
Abstract Introduction
Conclusions References
Tables Figures
◭ ◮
◭ ◮
Back Close
Full Screen / Esc
Printer-friendly Version
Interactive Discussion
Discussion
P
a
per
|
Discussion
P
a
per
|
Discussion
P
a
per
|
Discussion
P
a
per
|
in the interpretation of the 1420 event because B16 and B26 do not reach the age of 1420 AD and we do not see a strong anti-correlation during any other time period.
5 Conclusions
With the full set of the NGT records, it was now for the first time possible to describe regional differences in theδ18O values in northern Greenland over the last 1000 years.
5
Because of the ice sheet topography we see a clear east-to-west difference in north-ern Greenlandδ18O distribution. The east-to-west gradient is larger than the north-to-south gradient. We find a more pronounced persistence of warm or cold events east of the main ice divide and assume more stable climate conditions there. The eastern part is more influenced by local effects like changes in the Arctic Ocean, which has to
10
be supported by the results of climate models. For the first, time a local warm event at 1420±20 AD was pointed out. We assume an atmosphere-sea ice feedback as one possible reason for this event.
Due to the shadowing effect of the main ice divide we find the lowest accumulation rates in the northeast, whereas the lowest meanδ18O values are found east of the main
15
ice divide north of summit. The lowestδ18O mean values seem to be independent of accumulation rate.
We have presented a new 1000 year stacked δ18O record for northern Greenland covering 10 % of the area of Greenland. We found this NG-stack to be representative for the northern Greenland temperature.
20
Northern Greenland δ18O represents known climatic variations of the last millen-nium. We see a warm MCA and can derive distinct LIA cooling from our NG-stack.
The results of single site ice-core studies are likely weakened by the finding that only 22 % of the localδ18O signal is related to climate. 12 % of the variability is attributed to ice sheet topography. The remaining 66 % are therefore due to other processes.
CPD
11, 2341–2388, 2015Spatial and temporal oxygen isotope variability in northern
Greenland
S. Weißbach et al.
Title Page
Abstract Introduction
Conclusions References
Tables Figures
◭ ◮
◭ ◮
Back Close
Full Screen / Esc
Printer-friendly Version
Interactive Discussion
Discussion
P
a
per
|
Discussion
P
a
per
|
Discussion
P
a
per
|
Discussion
P
a
per
|
The solar activity and internal Arctic climate dynamics are likely the main factors influencing the temperature in northern Greenland. In contrast we could not find a gen-eral cooling effect of volcanic eruptions in our data.
Acknowledgements. Stefanie Weißbach was financed by the “Earth System Science Research School (ESSReS)”, an initiative of the Helmholtz Association of German Research Centres
5
(HGF) at the Alfred Wegener Institute (AWI), Helmholtz Centre for Polar and Marine Research. This study contributes to the Eurasian Arctic Ice 4k project funded by Deutsche Forschungs-gemeinschaft (grant OP 217/2-1 awarded to Thomas Opel).
Anna Wegner acknowledges REKLIM for funding.
Many thanks to the drill and lab team who have measured theδ18O with endurance over
10
more than 20 years. We also thank Johannes Freitag and Katja Instenberg for high resolution (CT) density measurements, Martin Rückamp for compiling the maps, Martin Werner for helpful discussions that improved the manuscript and Kirstin Meyer for proofreading.
References
Ammann, C. M., Joos, F., Schimel, D. S., Otto-Bliesner, B. L., and Tomas, R. A.: Solar influence
15
on climate during the past millennium: results from transient simulations with the NCAR Climate System Model, P. Natl. Acad. Sci. USA, 104, 3713–3718, 2007.
Andersen, K. K., Azuma, N., Barnola, J.-M., Bigler, M., Biscaye, P., Caillon, N., Chappel-laz, J., Clausen, H. B., Dahl-Jensen, D., Fischer, H., Flückiger, J., Fritzsche, D., Fujii, Y., Goto-Azuma, K., Grønvold, K., Gundestrup, N. S., Hansson, M., Huber, C., Hvidberg, C. S.,
20
Johnsen, S. J., Jonsell, U., Jouzel, J., Kipfstuhl, S., Landais, A., Leuenberger, M., Lorrain, R., Masson-Delmotte, V., Miller, H., Motoyama, H., Narita, H., Popp, T., Rasmussen, S. O., Raynaud, D., Rothlisberger, R., Ruth, U., Samyn, D., Schwander, J., Shoji, H., Siggard-Andersen, M.-L., Steffensen, J. P., Stocker, T. F., Sveinbjörnsdóttir, A. E., Svensson, A., Takata, M., Tison, J.-L., Thorsteinsson, T., Watanabe, O., Wilhelms, F., and White, J. W. C.:
25