Palavras chave: Métricas de paisagem Conservação florestal Floresta urbana Áreas prioritárias Índice. Histórico: Recebido 05/05/2016 Aceito 08/08/2016
Keywords: Landscape metrics Forest conservation Urban forest Priority areas Index
1 Luiz de Queiroz College of Agriculture - Piracicaba, São Paulo, Brazil 2 Federal University of São Carlos - Sorocaba, São Paulo, Brasil Correspondência:
kaline.mello@gmail.com ISSN 0104-7760
DOI: 10.1590/01047760201622032172
Kaline de Mello
1, Rogério Hartung Toppa
2, Eliana Cardoso-Leite
2PRIORITY AREAS FOR FOREST CONSERVATION IN AN URBAN LANDSCAPE
AT THE TRANSITION BETWEEN ATLANTIC FOREST AND CERRADO
ABSTRACT:
Urbanization and agriculture growth are some of the major causes of natural
ecosystems depletion and biodiversity loss. Conservation efforts can be developed through
the prioritization of areas for forest conservation in order to minimize this process. Here, we
establish conservation strategies based on a spatial analysis of forest fragments in an urban
landscape at the transition between two important Brazilian biodiversity hotspots: Atlantic
Forest and Cerrado. A high-resolution mapping of forest patches was used to quantify forest
cover and to provide spatial analysis. We developed a Forest Conservation Priority Index
(FCPI) derived from landscape metrics to select priority areas for forest conservation efforts.
We used area, shape and proximity metrics as landscape structure indicators. Landscape
metrics were classified and we attributed a rank and weights for them to calculate the FCPI.
Forest covers 17% of the study area. 60% of the forest patches comprise less than one
hectare, 95% less than 10 ha and only 1% more than 50 ha. The largest fragments (> 100ha)
are all long and narrow. Also, fewer than half the patches are connected to others. Regions
classified as high and very high priority for forest conservation are localized at greater slopes,
along rivers and on private lands. Our index allowed the prioritization of forest fragments in an
urban landscape, directing efforts of conservation. Creating protected areas and restoration
plans are necessary for the better situation of the natural ecosystem. Land-use planning must
resolve human demands and conservation of this important ecosystem.
ÁREAS PRIORITÁRIAS PARA CONSERVAÇÃO FLORESTAL EM UMA
PAISAGEM URBANA NA TRANSIÇÃO ENTRE MATA ATLÂNTICA E CERRADO
RESUMO:
O crescimento urbano e agrícola é uma das maiores causas de degradação dos
ecossistemas naturais e da perda de biodiversidade. Os esforços de conservação podem ser
planejados com base na priorização de áreas para conservação florestal de forma a minimizar
esse processo. Neste trabalho, nós estabelecemos estratégias de conservação com base em
uma análise espacial dos fragmentos florestais em uma paisagem urbana na transição entre dois
“hotspots” brasileiros: Mata Atlântica e Cerrado. Um mapa de alta resolução dos fragmentos
florestais foi usado para quantificar a cobertura florestal e para fornecer uma análise espacial
dos mesmos. Nós criamos um Índice de Prioridade de Conservação Florestal (IPCF) derivado
de métricas de paisagem para selecionar áreas prioritárias para esforços de conservação da
floresta. Foram utilizadas as métricas de área, forma e proximidade como indicadores de
estrutura da paisagem. As métricas de paisagem foram classificadas, atribuindo-se classes
e pesos a cada uma para calcular o IPCF. A cobertura florestal representa 17% da área de
estudo, sendo que 60% dos fragmentos florestais apresentam área menor que um hectare,
95% são menores que 10 ha e apenas 1% é maior que 50 ha. Os maiores fragmentos (>100
ha) são alongados e estreitos e menos da metade dos fragmentos são conectados a outros.
Áreas classificadas como de prioridade alta e muito alta para conservação florestal estão
localizadas em declividades acentuadas, ao longo de rios e em áreas particulares. Nosso índice
permitiu a priorização de fragmentos florestais em uma paisagem urbana, direcionando os
INTRODUCTION
Natural landscapes have been deeply transformed
throughout the world due to urbanization and other
anthropic activities. Landscape change has caused the
current biodiversity loss crisis and ecosystem services’
degradation (WU, 2008). Nonetheless, remnants of
natural vegetation within cities may play the role of
refuges for plants and animals otherwise maladapted to
the urban environment (GODEFROID; KOEDAM, 2003;
OLIVER et al., 2011). Green areas and forest fragments
in Brazilian cities often have many species of birds, not
just those typically common in urban areas, but also
those with restricted distributions or even endangered
(GALINA; GIMENES, 2006; VALADÃO et al., 2006;
SANTOS; CADEMARTORI, 2010). The importance
of species conservation in urban areas is clear because
more than half the people in the world live in
ever-expanding cities (CARREIRO, 2008). In Brazil, for
example, over 85% of people live in urban areas (IBGE,
2010). The two biomes in Brazil that have suffered the
most from urban sprawl are the Atlantic Forest and the
Cerrado (IBGE, 2012).
The Atlantic Forest is one of the most important
global biodiversity hotspots (MYERS et al., 2000). Its
original cover has been reduced by approximately 89%
due to unplanned agriculture and urban sprawl, (RIBEIRO
et al., 2009). Cerrado is also a global biodiversity
hotspot, and its rapid destruction is due to agricultural
expansion especially of soybean (mostly destined for
meat production) and more recently sugar cane (for the
production of ethanol as a biofuel) (IBGE, 2012). These
two biomes are connected by a seasonally dry tropical
forest (SDTF) (HUGHES et al., 2013) in southeastern
Brazil. SDTF is among the most devastated forest types
because of its strategic location: low slopes and not far
from the coastal zone, where agriculture and urban
growth easily occur. In addition, the SDTF is second
among the most threatened centers of endemism in
the Atlantic Forest, with only 7.1% of its original cover
remaining and 6.8% of its remaining forest under
protection (RIBEIRO et al., 2009).
Prioritizing areas for conservation is the first step
to develop strategies to mitigate impacts on biodiversity
(VALENTE; VETTORAZZI, 2011; ARONSON; SASHA,
2013). By prioritization, we may more effectively target
specific resources and direct efforts for environmental
policy design. Understanding forest ecosystem
structure (i.e. forest composition and configuration) is
essential for both forest conservation and restoration
projects (VALENTE; VETTORAZZI, 2008; METZGER;
BRANCALION
, 2013). It allows the identification of
important factors to maintain local biodiversity and
define actions to reestablish landscape functions and
ecosystem services.
Landscape metrics have been increasingly used
in prioritization to achieve rapid and criterion-based
results and are often simpler and less costly than the
heretofore use of indicator species (BANKS-LEITE et
al., 2011; PEROVIC et al., 2015; SCHINDLER et al.,
2015). Landscape metrics are used to determine areas
of conservation interest and to indicate potentially
species-rich areas, and are used in various stages in
conservation planning (SCHINDLER et al., 2013; DE
JESUS et al., 2015), such as to evaluate forest structure
changes (del CASTILLO et al., 2015; BAKER et al., 2015;
OTERO et al., 2015).
Environmental planning based on landscape
ecology can generate important information for
understanding ecological dynamics and to consolidate
management proposals for landscapes with remnants of
natural vegetation in areas with ongoing human activities
(METZGER; BRANCALION, 2013).
The general objective of the study is to determine
priority areas for forest conservation in an urban
landscape. Specific objectives are; (1) to evaluate forest
structure based on landscape metrics; (2) to develop
a forest conservation priority index; (3) to develop
strategies to sustain forest conservation and its ecosystem
services in anthropic landscapes.
MATERIAL AND METHODS
Study area
The study was conducted in Sorocaba city, located
in the southeastern region of the state of São Paulo, Brazil
(23°20’25”S – 23°35’15”S, 47°17’46”W – 47°34’55”W).
It comprises an area of ~45,000 ha and an estimated
population of 586,625 (in 2010, Figure 1). Sorocaba
is the most populated city in the Sorocaba and Middle
Tietê watershed. With the other nearby major cities
(São Paulo, Campinas, Santos and others) it forms the
São Paulo Macrometropolis (SILVA; FONSECA, 2013)
comprising one of the largest centers of population in the
world, with its associated industries, services, airports
and ports, major highways and universities.
seasonally dry tropical forest (hereafter SDTF). Anthropic
transformation of the landscape here was initially due to
agricultural development followed by industrialization.
Economic growth and proximity to the city of São Paulo
(with the largest population of any city in South America)
have led the intense conversion of natural landscapes to
urban areas, resulting in a matrix of forest patches within
the anthropic landscape. With only 17% of agricultural
area, Sorocaba has a high level of urbanization.
Forest mapping
Forest patches were mapped by digital visual
classifi cation by on-screen digitizing of aerial photographs
taken in 2006 on a scale of 1:20,000 with 0.4 m spatial
resolution. Prior to mapping, points of interest were
recorded in the fi eld using GPS and to differentiate,
in aerial photos, between native forests and exotic
Eucalyptu
s and
Pinus
plantations, citrus crops and
Leucaena
spp (exotic leguminous). We created a sort key for digital
image interpretation based on these known points and
image attributes such as tone, texture and shape.
We estimated map accuracy by using an error
matrix and the kappa coeffi cient (CONGALTON;
GREEN, 1998). The kappa coeffi cient indicates
classifi cation quality on a scale of 0 to 1 (1 is perfect).
We used 200 points on the image to compare with
land-use checking in the fi eld, allowing for determination of
errors of omission (when the map omitted something
found in the fi eld) and commission (when the map has
a feature not found in the fi eld). We obtained a kappa
index of 0.8
and so maps were well-representative of the
fi eld following Rosner (2006) in which kappa ≥ 0.75 is
considered excellent. Errors of commission were usually
due to confusion among growth stages of
Eucalyptus
spp. Only one error of omission was found. Previous
studies showed errors related to the mapping scale. At
the 1:50,000 scale, the accurate mapping is diffi cult when
patches are smaller than 30 ha, have hillside forests or have
easily confused plantations of
Eucalyptus
spp. and riparian
vegetation (RIBEIRO et al., 2009). Our scale (1:2,000)
allowed accurate mapping of small patches (<1 ha).
Forest confi guration
Forest confi guration was based on calculation of
landscape metrics in a Geographic Information System
(GIS) environment (ArcGIS version 9.2; ESRI, 2007),
using the extension V-LATE 1.1 (Vector-based Landscape
Analysis Tools). R version 2.7.1 (R DEVELOPMENT
Core Team, 2008) was used for all data processing.
We calculated total forest cover and area, shape and
connectivity as structural landscape metrics for all
forest patches. We chose these metrics based on
three ecological concepts. First, island biogeography
(MacArthur and Wilson, 1967), in which large areas
should have greater environmental variation and
consequently greater biodiversity (METZGER, 1999).
Second, the edge effect, in which the infl uence of the
adjacent landscape is large and depends on the length
and area of the natural forest patches and infl uences the
species composition along the edges (HARPER et al.,
2005). Third, in metapopulation dynamics (HANSKI,
1998), with subpopulations separated by gaps or barriers
FIGURE 1 Location of the study area, the city of Sorocaba, state of São Paulo, Brazil, the transition region between Atlantic Forestand, at times, connected by dispersal, in which the
degree of connectivity will facilitate or hinder movement
between habitat fragments (TAYLOR et al., 1993). These
three metrics are more or less independent concepts
and so permit independent analysis.
The shape of a habitat patch determines the
extent of its perimeter and area. A circular shape is that
which minimizes the perimeter/area ratio and generates
edges all equidistant from the patch center. Patch shape
was estimated using a shape metric (SHAPE) expressed
as given by the following equation 1, where, P is the
circumference, A is area and c is a constant. A perfect
circle has a SHAPE value of zero, and SHAPE values > 6
are heuristically considered irregular.
metric values were grouped into five classes in order
to normalize them for the same equation (below). The
values were ranked as follows: one (1) least important,
and five (5) most important. Furthermore, each metric
received a weight
.
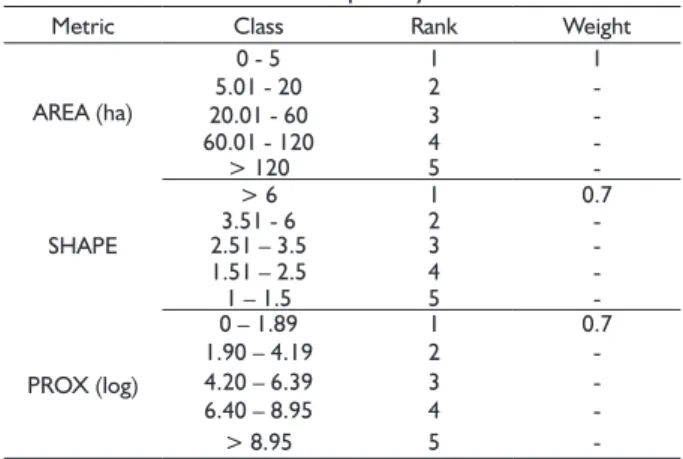
For the final rank importance for
conservation, we proposed the equation 3 Index, named
Forest Conservation Priority Index (FCPI), where, FCPI
is the forest conservation priority index for each patch, R
is rank and W is weight (Table 2).
P SHAPE
A c
= [1]
Estimates of fragment isolation and connectivity
based on landscape metrics only describe structural
relationships among forest patches (structural
connectivity; METZGER, 1999). We used the metric
PROX which calculates area of all patches within a buffer
centered on the target patch divided by the squared
distance from it, equation 2, where, A is area summed
over all patches within the buffer, and D is the distance
of each one to the target patch summed over all patches.
[2]
(
)
2A PROX
D
=
å
å
PROX values range from 0 to infinity, in which 0 is
when there is only one fragment in the buffer and large
values indicate a combination of larger areas with smaller
inter-patches distances. We used this metric with four
buffer sizes to simulate movement distances over open
areas of typical rainforest animals: 50 m for small birds
(AWADE; METZGER, 2008), 100 m for birds and small
mammals (BOSCOLO; METZGER, 2009; FORERO
MEDINA; VIEIRA, 2009), 500 m to 1000 m for some
mammals and insects (TONHASCA-Jr et al., 2003;
LIRA et al., 2007).
Priority areas for forest conservation
We discarded a metric in the analysis when it
was strongly correlated with another metric used in
the analysis (Table 1). Upon examination of buffers,
we selected the 100 m buffer because it is likely to
represent a greater number of animal groups in the
study area. We also discarded large distances (> 500 m)
to avoid overestimation of displacement because there
are no large mammals in this modified landscape. The
[3]
TABLE 1 Correlations between patch metrics (n = 2537), including shape (SHAPE), area (AREA) and connectivity (PROX) at four levels (50, 100, 500, 1000m).
Variables AREA SHAPE 50 100 500
SHAPE 0.52 - - -
-50 0.17 0.23 - -
-100 0.20 0.22 0.97 -
-500 0.20 0.21 0.95 0.98
-1,000 0.21 0.22 0.95 0.98 0.99
*All correlations are statistically significant at P < 0.001.
TABLE 2 Class, rank and weights of metrics used to calculate forest conservation priority index.
Metric Class Rank Weight
AREA (ha)
0 - 5 1 1
5.01 - 20 2
-20.01 - 60 3
-60.01 - 120 4
-> 120 5
-SHAPE
> 6 1 0.7
3.51 - 6 2
-2.51 – 3.5 3
-1.51 – 2.5 4
-1 – -1.5 5
-PROX (log)
0 – 1.89 1 0.7
1.90 – 4.19 2
-4.20 – 6.39 3
-6.40 – 8.95 4
-> 8.95 5
-Recent studies suggest that bird diversity in very
fragmented landscapes is more strongly influenced by
fragment size over connectivity (OLIVER et al., 2011;
MARTENSEN et al., 2012; DAMI et al., 2013). On the
other hand, small mammals are influenced by fragment
size and isolation (VIEIRA et al., 2009). Following
guidelines suggested by these and other studies
(GENELETTI, 2004; METZGER et al., 2008; RIBEIRO et
al., 2009) we assigned greater weight (1) to AREA and W
= 0.7 for SHAPE and PROX, expressed as given by the
following equation 4:
[4]
( ) ( ) ( )
R W AREA + R W SHAPE + R W PROX FCPI =
W
× × ×
å
( ) ( ) ( )
R AREA + 0.7 R SHAPE + 0.7 R PROX 100m FCPI =
2.4
We established five levels of FCPI: very low
(1.0-2.0), low (2.0-2.5), medium (2.5-3), high (3-3.25)
and very high (>3.25). Ranges of these classes were
determined using Jenks Natural Breaks (an algorithm
to maximize similarity of numbers in groups and the
distance between groups).
After the priority map, we checked if the public
open spaces named as Park in Sorocaba have high
priority for conservation. A total of 33 public areas were
considered in this analysis.
We validated the FCPI using a sample data and
running the index for those fragments. We selected
the Areia Branca Watershed, in the North of Sorocaba
City, because it presented all classes of priority. Areia
Branca stream is a tributary of the Sorocaba River, and
its watershed comprises 101 forest fragments. After the
simulation, we applied a principal components analysis
(PCA) to check the pattern of the FCPI classification and
the importance of each landscape metric for Sorocaba
city and Areia Branca Watershed. A multivariate analysis
of variance (MANOVA) was applied to determine
whether there are significant differences between the
classes of priority. PCA analysis was carried out in MVSP
3.22 software, whereas MANOVA analysis was carried
out using PAST 3.12 software (RENCHER, 2002).
RESULTS
Forest cover and configuration
Sorocaba presented a forest cover of 7,509 ha
that represents 17% of the territory. It is distributed
in 2,537 patches, of which 1,716 are smaller than 1 ha
and which comprise 7% of the total forest cover (Figure
2). 2,406 fragments are smaller than 10 ha (95% of the
total of fragments) and they represent 35% of the total
forest cover. Only 24 fragments are > 50 ha (1% of the
total), and 8 of them are > 100 ha. Fragments < 50 ha
comprise 65% of the total forest remaining in the study
area. All the forest fragments are smaller than 400 ha.
The largest patches are 100 to 320 ha (Figure 2).
The forest cover is concentrated in the southeast
of the city, where the largest forest patch is located (320
ha). This region is more mountainous and has a large
river network (Figure 1). In addition, we indicated forest
remaining in the North of the city along the Pirajibú
River, one of the main tributaries of the Sorocaba River
(Figure1). All the fragments in the south and central zones
of the study area are < 10 ha and they are distributed
among open spaces within the urban matrix and < 300
m from rivers. In general, the largest forest fragments
were found associated with the waterbodies.
Among all fragments, 15 fragments showed a very high
SHAPE index (> 6) while 1,704 showed low values (< 2).
SHAPE Index near to 1 indicates patches presenting a shape
close to a circle. High values of SHAPE represent complex
shapes. Larger patches tend to have complex shapes than the
smaller ones (Figure 3, E).
When connectivity was calculated using buffers of
50 m and 100 m, connectivity was often zero or very
near zero and only increased when larger buffers were
used (500 – 1,000 m). Thus, the relationship between
buffer and the value of PROX near zero (<1) was
50:552, 100:317, 500:127 and 1,000:53 (Figure 3, A, B,
C and D). All the fragments > 50 ha showed PROX >
1 for all buffer distances. This means that none of the
largest fragments is a patch isolated in the urban matrix.
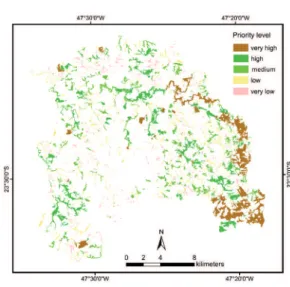
Priority areas for forest conservation
According to the forest conservation priority
index (FCPI), 330 fragments were classified as very low
priority, 1,205 as low priority, 595 as medium priority,
300 as high priority and 107 as very high priority (Figure.
4). Fragments of very high priority for forest conservation
totaled 2,038 ha, and fragments with high priority, 2,093
ha. Together they represent an area of 4,131 ha (55%
of total forest cover over all fragments). Fragments of
medium priority represent 22% of the total forest cover,
followed by low (16%) and very low priority (7%).
Forest patches with high values of importance
tend to be eastern, in higher slopes and where rivers
are concentrated (Figure 4). Fragments that border the
Pirajibú River, in the industrial zone of the city, were very
high priority due their size (all of them bigger than 60
ha – Rank 4 and 5) and high connectivity (Rank 5). Only
two of the 33 public parks in Sorocaba showed forest
patches of very high priority (Mário Covas and Pirajibú).
Both are located along the Pirajibú River. Another public
area showed high priority for conservation (Brigadeiro
Tobias). The remainder of the high priority areas is north
and west of the city, on private properties. Most of the
FIGURE 2 Number of forest fragments by size classes andpublic areas showed priority levels between very low
and medium.
The PCA analysis showed that FCPI has the
same pattern classifying the fragments for all the data
and for the sample data in the index validation step
(Figure
5). The fi rst two axes of the PCA explained 90%
of the variation for all data (Sorocaba city) and 87% for
the sample data (Areia Branca Watershed). The fi rst
axis explained 61% of the variation for Sorocaba city
and 54% for the Areia Branca Watershed, showing that
all the landscape metrics were important for the FCPI.
There is a gradient from very low priority fragments to
very high. The second axis explained 29% of the variation
for Sorocaba and 33% for the Areia Branca Watershed,
showing that the connectivity is important even when
area and shape are not so high. MANOVA tests showed
signifi cant difference between all the priority classes
for both Sorocaba city (Wilk´s
λ
= 0.22; F = 439; P <
0.0001 in all cases) and Areia Branca Watershed (Wilk´s
λ
= 0.13; F = 24.66; P < 0.0001 in all cases).
DISCUSSION
Due to fragmentation and habitat loss, the
situation is extremely precarious and unless measures
are soon taken, this ecotone between Atlantic Forest
and Cerrado will be lost. Sorocaba city showed a forest
cover close to other cities with the same forest type in
the state of São Paulo, Brazil, for example: 17% of forest
cover in Santa Cruz da Conceição and 14% in São Carlos
(FUSHITA et al., 2010; CINTRA et al., 2006), showing
a worrying situation of the SDTF. The maintenance of
endemic or threatened species found in this area such
as
Copaifera langsdorffi i, Cedrela fi ssilis
and
Machaerium
villosum
of fl ora, Procnias nudicollis
and
Urubitinga coronata
FIGURE 3 Dispersion of forest fragments as a function of thevalues of the area and connectivity (PROX) using the following buffer values: A = 50 m, B = 100 m, C = 500 m, D = 1,000 m; and as a function of the values of the area and shape (SHAPE) with a trend line (E).
of birds, and
Monodelphis iheringi
of mammals (SMITH et
al., 2014) depends on a conservation strategy.
Landscapes with many small fragments (<50 ha,
in our case with most forest fragments <10 ha), in a
heterogeneous matrix, is a typical pattern in the Atlantic
Forest (PARDINI et al., 2009, RIBEIRO et al., 2009),
Cerrado (VALENTE; VETTORAZZI, 2008; FUSHITA
et al., 2010) and in most fragmented biomes in the
word (BODIN et al., 2006). On the other hand, small
fragments can be important if they allow a connection
among larger remnants. Forest patches > 0.72 ha can
become stepping stones, facilitating the movement of
many species (METZGER, 1997). Removal of patches
smaller than 50 ha increases the isolation of the major
forest patches and reduces their connectivity (RIBEIRO
et al., 2009). Pereira et al. (2010) found that small forest
patches (<10 ha) have great values of diversity of tree
species in Lavras, Brazil. Strohbach et al. (2009) analyzed
neighborhoods with different cover types in an urban
area in Germany, and found out that the highest diversity
of bird species is related to neighborhoods with a high
quantity and quality of green spaces, such as forest
fragments, urban parks and riparian forests. In our study,
connectivity showed strong importance to determine
priority forest fragments, even when area and shape are
not so high, showing that the connectivity is an important
landscape indicator.
Many forest patches may not support some
populations of native fl ora and fauna because they are
too small (up to 400 ha) and are largely infl uenced
by the urban matrix. However, if corridors exist, or
if some dispersal occurs, then these fragments may
include meta-population dynamics. A study in the
U.S.A. has shown that some forest fragments of 100
to 500 ha, even in highly urbanized areas, have a high
diversity of bird species and the inclusion of extensive
natural areas in urban landscapes may be the key to the
conservation of the biodiversity of migratory and local
birds (OLIVER et al., 2011). The larger forest patches
that we found for Sorocaba can play an important role
for biodiversity conservation. Studies with many taxa
in urban landscapes revealed that species composition
and richness are directly related to forest patch size
(GODEFROID; KOEDAM, 2003; VIEIRA et al., 2009;
SANTOS; CADEMARTORI, 2010; BRÄUNIGER et al.,
2010, SOGA; KOIKE, 2012; DAMI et al., 2013). Species
richness, when comparing protected areas in urban and
rural settings, responds more to fragment size than to
the extent of urbanization (KNAPP et al., 2008).
In our study, the largest forest patches are located
mainly in peripheral regions to the urban center, at high
slopes or in riparian zones. Complex topography often
has more mature forests because development and
agriculture usually use fl atter terrains fi rst (
SILVA et al.,
2007; ROMPRÉ et al., 2008). Urbanization lasts longer
than other types of habitat loss (MCKINNEY, 2002), and
the conversion of habitat to urban areas should be seriously
debated in the tropics since it may be the most important
cause of habitat loss in the future (ROMPRÉ et al., 2008).
On the other hand, forest patches with a complex or long
shape as riparian zone generate more area under edge
effect. Those areas show low tree richness than areas
farther from the edge (OLIVEIRA et al., 2015).
The majority of the remnants are in the remaining
rural areas, but some fragments with high and very high
priority stand out in the peripheral areas of the city
center. They are threatened by urban sprawl, mainly
related to property speculation, as occurs in other
developing countries (LOPES et al., 2001). Most of these
forest patches are on private lands, generating a need
for action on the part of the government to work closely
with landowners in order to establish better strategies
for maintaining these forest patches. One alternative is
the creation of Private Reserves of Nature Patrimony,
a category of protected area according to the Brazilian
FIGURE 5 Principal components analysis on priority classes forNational System of Protected Areas (law number 9985 of
July 18, 2000). The initiatives of private protected areas
creation in Brazil are still low, mainly at municipal levels.
Municipalities with urban growth in a fragmented biome,
besides encouraging the creation of private protected
areas, should implement a system of economic valuation
and compensation for environmental services provided
by private properties as well as laws, tax incentives and
funding for biodiversity conservation and reforestation
projects. Despite having many laws relating to biodiversity
conservation on private property, Brazil still has limited
incentives for conservation by landowners.
The FCPI was a strong framework to determine
priority areas for forest conservation in an urban
landscape, and can be replicated in other cities or
watersheds as shown by our results. It is a low-cost
alternative for a first step to target resources and direct
efforts for forest conservation, once it is simpler and less
costly than the use of indicator species (BANKS-LEITE
et al., 2011; SCHINDLER et al., 2015). This approach
can direct new studies of biodiversity starting by the
priority fragments. The ecosystem conservation across
the urban-rural gradient is critical to the long-term
environmental health of metropolitan areas in the world,
such as the São Paulo Macrometropolis. Urban forests
must be incorporated in the planning actions and the
management of municipalities, and the FCPI can help
decision-makers on environmental policies design.
Once native vegetation areas are increasingly
threatened and the number of protected areas is
not representative, nature conservation will largely
depend on proper management of an anthropogenic
matrix (FONSECA et al., 2009; RIBEIRO et al., 2009).
According to Ferraz et al. (2014), the Atlantic Forest
cover is actually a heterogeneous mosaic of forests of
different ages, situated in different landscape conditions,
and thus having different quality levels for biodiversity
conservation and ecosystem services provisioning. Tree
monocultures (as
Eucalyptus
spp.) can contribute greatly
for conserving biodiversity when maintaining a complex
and diverse understory (FONSECA et al., 2009). In
rural or urban landscape, educational programs and
environmental awareness should accompany all actions
for the conservation and restoration by incorporating
local people in planning, implementation and monitoring
actions. Population support in conservation projects is
critical to their success.
Whereas the city’s sprawl is an ongoing process,
the territorial planning must unite the demands for
infrastructure and environmental conservation. Urban
and industrial expansion plans should be integrated into
the goals of conservation and restoration of natural
ecosystems. Urban policies could be the key to more
effective conservation of biodiversity and ecosystem
services, creating sustainable cities.
CONCLUSIONS
Sorocaba has a high habitat fragmentation with
forest cover distributed in small patches, nevertheless it
has priority areas for forest conservation in the transition
between the Atlantic Forest and Cerrado.
Forest cover is concentrated at high slopes,
riverbanks and on floodplains, predominantly on private
lands. Larger forest patches tend to have a complex
shape due their location along the rivers. Fewer than half
the patches are connected to others.
The proposed index is a strong framework to
determine priority areas for forest conservation and
it can be applied in other locations. Area, shape and
connectivity are good landscape metrics to predict
interesting habitat patches and direct efforts for forest
conservation in an urban landscape.
Forest management actions must start by
the fragments with high and very high priorities
for conservation. Creating protected areas and
ecological restoration programs are necessary for the
better situation of the natural ecosystem, increasing
landscape connectivity.
REFERENCES
ARONSON, J.; SASHA, A. Ecosystem restoration is now a
global priority: time to roll up our sleeves. Restoration
Ecology, v. 21, n. 3, p. 293-296, 2013.
AWADE, M.; METZGER, J. P. Using gap‐crossing capacity to
evaluate functional connectivity of two Atlantic rainforest birds and their response to fragmentation. Austral Ecology, Carlton, v. 33, n. 7, p. 863-871, 2008.
BAKER, S. R.; BLOOM, N.; DAVIS, S. J. Measuring economic
policy uncertainty. The National Bureau of Economic
Research, n. 21633, 2015.
BANKS-LEITE, C.; EWERS, R.M.; KAPOS, V.; MARTENSEN, A. C.; Metzger, J.P. Comparing species and measures of landscape structure as indicators of conservation importance. Journal of Applied Ecology, London, v. 46, p. 706-714, 2011.
BOSCOLO, D.; METZGER, J.P. Is bird incidence in Atlantic forest fragments influenced by landscape patterns at multiple scales? Landscape Ecology, Amsterdam, v. 24, p. 907-918, 2009.
BRÄUNIGER, C.; KNAPP, S.; KÜHN, I.; KLOTZ, S. Testing taxonomic and landscape surrogates for biodiversity in an
urban setting. Landscape and Urban Plan, v. 97, n. 4, p.
283-295, 2010.
CARREIRO, M.M. The Growth of Cities and Urban Forest. In: CARREIRO, M.M.; SONG, Y.; WU, J. (Org.). Ecology, Planning, and Management of Urban Forests: international perspectives. Springer, 2008.
CINTRA, R. H. S., SANTOS, J. R., MOSCHINI, L.E. PIRES, J.S.R., HENKE-OLIVEIRA, C. Qualitative and quantitative analysis of environmental damages throw instauration and register of lawful documents. Arquivos de Biologia e Tecnologia, v. 49, p. 989-999, 2006.
CONGALTON, R.G.; GREEN, K. Assessing the accuracy of remotely sensed data: principles and practices. New York: Lewis Publishers, 1998.
DAMI, F.D.; MWANSAT, G.S.; MANU, S.A. The effects of forest fragmentation on species richness on the Obudu Plateau, south-eastern Nigeria. African Journal of Ecology, v. 51, n.1, p. 32-36, 2013.
DE JESUS, E. N., FERREIRA, R. A., ARAGÃO, A. G., SANTOS, T. I. S., ROCHA, S. L., Structure of forest fragments of the river basin Poxim-SE, as subsidy to ecological
restoration. Revista Árvore, v. 39, n.3, p. 467-474, 2015.
DEL CASTILLO, E. M.; GARCÍA-MARTIN, A.; ALADRÉN, L. A. L.; DE LUIS, M. Evaluation of forest cover change using remote sensing techniques and landscape metrics in
Moncayo Natural Park (Spain). Applied Geography, v. 62, p. 247-255, 2015.
ESRI. ArcGis, the Complete Geographical Information System. California, USA: Redlands 2007.
FERRAZ, S. F.B.; FERRAZ, K.M.P.M.B.; CASSIANO, C.C.; BRANCALION, P.H.; DA LUZ, D.T.A.; AZEVEDO, T.N.; TAMBOSI, L.R.; METZGER, J.P. How good are tropical forest patches for ecosystem services provisioning? Landscape Ecology, v. 29, p. 187-200, 2014.
FONSECA, C.R.; GANADE, G.; BALDISSERA, R.; BECKER, C.G.; BOELTER, C.R.; BRESCOVIT, A.D.; CAMPOS, L.M.; FLECK, T.; FONSECA, V.S.; HARTZ, S.M.; JONER, F.; KAFFER, M.I.; LEAL-ZANCHET, A.M.; MARCELLI, M.P.; MESQUITA, A.S.; MONDIN, C.A.; PAZ, C.P.; PETRY, M.V.; PIOVENSAN, F.N.; PUZKE, J.; STRANZ, A.; VERGARA, M.; VIEIRA, E.M. Towards an ecologically-sustainable forestry in the Atlantic Forest. Biological Conservation, Liverpool, v. 141, p. 1209-1219, 2009.
FORERO-MEDINA, G.; VIEIRA, M.V. Perception of a fragmented landscape by Neotropical marsupials: effects of body mass and environmental variables. Journal of Tropical Ecology, Cambridge, v. 25, p. 53-62, 2009.
FUSHITA, A. T.; ARAUJO, R.T.; PIRES, J.S.R.; SANTOS, J.E. Dinâmica da vegetação natural e das áreas de preservação permanente na paisagem do município de Santa Cruz da Conceição (SP, Brasil), In: SANTOS, J.E.; ZANIN, E.M.; MOSCHINI, L.E. (Eds.), Faces da Polissemia da Paisagem: Ecologia, Planejamento e Percepção. Rima., pp.193-200, 2010.
GALINA, A.B.; GIMENES, M.R. Riqueza, composição e distribuição espacial da comunidade de aves em um fragmento florestal urbano em Maringá, Norte do Estado do Paraná, Brasil. Acta Scientiarum Biological Sciences, Maringá, v. 28, n.4, p. 379-388, 2006.
GENELETTI, D. A GIS-based decision support system to identify nature conservation priorities in an alpine valley. Land Use Policy, Oxford, v. 21, p. 149-160, 2004.
GODEFROID, S.; KOEDAM, N. How important are large vs. small forest remnants for the conservation of the
woodland flora in an urban context? Global Ecology and
Biogeography, v. 12, n. 4, p. 287-298, 2003.
HANSKI, I.A. Metapopulation dynamics. Nature, v. 396, p. 41-49, 1998.
HARPER, K.A., MACDONALD, S. E., BURTON, P. J., CHEN, J., BROSOFSKE, K. D., SAUNDERS, S. C., ESSEEN, P.
A. Edge influence on forest structure and composition
in fragmented landscapes. Conservation Biology,
Washington, v. 19, n. 3, p. 768-782, 2005.
HUGHES, C.E.; PENNINGTON, R.T.; ANTONELLI, A. Neotropical Plant Evolution: Assembling the Big Picture. Botanical Journal of the Linnean Society, v. 171, p. 1-18, 2013.
IBGE. Instituto Brasileiro de Geografia e Estatística. Atlas Nacional do Brasil - Milton Santos. IBGE, 2010.
IBGE. Instituto Brasileiro de Geografia e Estatística. Indicadores de Desenvolvimento Sustentável. IBGE, 2012.
KNAPP, S.; KUHN, I.; MOSBRUGGER, V.; KLOTZ, S. Do protected areas in urban and rural landscapes differ in species diversity? Biodiversity and Conservation, v. 17, p. 1595-1612, 2008.
LIRA, P.K., FERNANDEZ, F.A.S., CARLOS, H.S.A., CURZIO, P.L. Use of a fragmented landscape by three species of opossum in Southeastern Brazil. Journal of Tropical Ecology, v. 23, p. 427-435, 2007.
MACARTHUR, R.H.; WILSON, E.O. The theory of island biogeography. Princepton University Press, 1967.
MARTENSEN, A.C.; RIBEIRO, M.C.; BANKS-LEITE, C.; PRADO, P.I.; METZGER, J.P. Associations of forest cover, fragment area and connectivity with neotropical understory bird species richness and abundance. Conservation Biology, v. 26, n.6, p.1100-1111, 2012.
MCKINNEY, M.L. Urbanization, biodiversity, and Conservation. Bioscience Journal, v.52, n. 10, p. 883-890, 2002.
METZGER, J. P.; BRANCALION, P. H. Challenges and Opportunities in Applying a Landscape Ecology Perspective in Ecological Restoration: a Powerful Approach to
Shape Neolandscapes. Brazilian Journal of Nature
Conservation, v.11, n. 2, p. 103-107, 2013.
METZGER, J.P. Relationships between landscape structure and tree species diversity in tropical forests of South-East Brazil. Landscape and Urban Plan, v. 37, p. 29-35, 1997. METZGER, J.P. Estrutura da Paisagem e Fragmentação: Análise
Bibliográfica. Anais da Academia Brasileira de Ciências, v. 71, p. 445-462, 1999.
MYERS, N.; MITTERMEIER, R.A.; MITTERMEIER, C.G.; FONSECA, G.A.B.; KENT, J. Biodiversity hotspots for conservation priorities. Nature, v. 403, p. 853-858, 2000. OLIVER, A.J., HONG-WA, C., DEVONSHIRE, J., OLEA, K.R.,
RIVAS, G.F., GAHL, M.K. Avifauna richness enhanced in large, isolated urban parks. Landscape and Urban Plan, v. 102, p. 215-225, 2011.
OTERO, I.; MARULL, J.; TELLO, E.; DIANA, G.L.; PONS, M.; COLL, F.; BOADA, M. Land abandonment, landscape, and biodiversity: questioning the restorative character of the forest transition in the Mediterranean. Ecology and Society, v. 20, n. 2, p. 7, 2015.
PARDINI, R., FARIA, D.; ACCACIO, G.M.; LAPS, R.R.; MARIANO-NETO, E.; PACIENCIA, A. M.L.B.; DIXO, M.; PEROVIĆ, D.; GÁMEZ-VIRUÉS, S.; BÖRSCHIG, C.; KLEIN, A.-M.; KRAUSS, J., STECKEL, J.; ROTHENWÖHRER, C.; ERASMI, S.; TSCHARNTKE, T.; WESTPHAL, C. Configurational landscape heterogeneity shapes functional community composition of grassland butterflies. Journal of Applied Ecology, v. 52, p. 505–513, 2015.
OLIVEIRA, L.S.C.; MARANGON, L.C.; FELICIANO, A.L.P.; LIMA, A.S.; CARDOSO, M.S.O.; DOS SANTOS, W.B.
Efeito de borda em remanescentes de floresta atlântica
na bacia do rio Tapacurá, Pernambuco. Cerne, v.21, n.2,
p.169-174, 2015.
PEREIRA, I.M.; BERG, E.V.D.; PINTO, L.V.A.; HIGUCHI, P.; CARVALHO, D.A. Avaliação e proposta de conectividade dos fragmentos remanescentes no campus da Universidade Federal
de Lavras, Minas Gerais. Cerne, v.16, n.3, p.305-321, 2010.
R DEVELOPMENT CORE TEAM. A Language and Environment for Statistical Computing. R Foundation for Statistical Computing, 2008. http:// www.R-project.org. RIBEIRO, C.R.; METZGER, J.P.; MARTENSEN, A.C.;
PONZONI, F.J.; HIROTA, M.M. The Brazilian Atlantic Forest: how much is left, and how is the remaining forest distributed? Implications for conservation. Biological Conservation, v.142, p. 1141-1153, 2009.
RENCHER, A.C. 2002. Methods of multivariate analysis, 2nd ed. Wiley.
ROMPRÉ, G.; ROBINSON, W.D.; DESROCHERS, A. Causes of habitat loss in a Neotropical landscape: The Panama Canal corridor. Landscape and Urban Plan, v.87, p. 129-139, 2008.
SANTOS, M.F.B.; CADEMARTORI, C.V. Estudo comparativo da avifauna em áreas verdes urbanas da região metropolitana de Porto Alegre, sul do Brasil. Biotemas, v.23, n.1, p. 181-195, 2010.
SCHINDLER, S.; VON WEHRDEN, H.; POIRAZIDIS, K.; HOCHACHKA, W.M.; WRBKA, T.; KATI, V. Performance of methods to select landscape metrics for modelling species richness. Ecological Modelling, v. 295, p. 107-112, 2015.
SCHINDLER, S.; WEHRDEN, H.V.; POIRAZIDIS,K.; WRBKA, T.; KATI, V. Multiscale performance of landscape metrics as indicators of species richness of plants, insects and vertebrates. Ecological Indicators, v. 31, p. 41-48, 2013.
SILVA, G.; FONSECA, M. D. L.São Paulo, city-region: constitution and development dynamics of the São Paulo
macrometropolis. International Journal of Urban
Sustainable Development, v. 5, n.1, p. 65-76, 2013.
SMITH, W.; MOTA JUNIOR, V.D.; CARVALHO, J.L.
Biodiversidade do município de Sorocaba. Prefeitura
Municipal de Sorocaba - Secretaria do Meio Ambiente, 2014.
SOGA, M., KOIKE, S. Relative importance of quantity, quality and isolation of patches for butterfly diversity in fragmented urban forests. Ecological resources, v. 27, p. 267-271, 2012. STROHBACH, M.W., HAASE, D., KABISCH, N. Birds and
the city: urban biodiversity, land use, and socieconomics. Ecology and Society, v. 14 n.2, p. 31, 2009.
TAYLOR, P. D. FAHRIG, L., HENEIN, K., MERRIAM, G Connectivity is a vital element of landscape structure. Oikos, v. 68, n. 3, p. 571-573, 1993.
TONHASCA Jr, A.; ALBUQUERQUE, G.S.; BLACKMER, J.L. Dispersal of euglossine bees between fragments of the Brazilian Atlantic Forest. Journal of Tropical Ecology, Cambridge, v. 19, p. 99-102, 2003.
VALENTE, R.O.A.; VETTORAZZI, C. A. Definition of priority
areas for forest conservation through the ordered weighted
averaging method. Forest Ecology and Management, v.
256, n.6, p. 1408-1417, 2008.
VALENTE, R.O.A.; VETTORAZZI, C. A.Multicriteria evaluation in the definition of priority areas for forest restoration, aiming at the sustainable water management. In: BILIBIO, C., HENSEL, O., SELBACH, J. (Eds.). Sustainable water management in the tropics and subtropics and case studies in Brazil. UNIKASSEL, PGCUlt, UFMA, Brazil. p. 377-406, 2011.
VIEIRA, M.V. et al. Fragment size and isolation as determinants of small mammal composition and richness in Atlantic Forest remmants. Biological Conservation, v. 142, p. 1191-1200, 2009.