Vol. 59: e16150509, January-December 2016 http://dx.doi.org/10.1590/1678-4324-2016150509
ISSN 1678-4324 Online Edition
BRAZILIAN ARCHIVES OF BIOLOGY AND TECHNOLOGY
A N I N T E R N A T I O N A L J O U R N A L
Helicobacter pylori Infection is a Significant Factor Risk for
Hyperhomocysteinemia in the Patients with Coronary
Artery Disease
Soudabeh
Fallah
1*, Nariman
Moradi
2, Fadaei
Reza
2, Ahmadi
Reza
2,
Tabatabei
Azardokht
2, Morteza Seifi
31
Hemmat Highy way, Iran (the Islamic Republic of); 2Iran University of Medical Sciences – Biochemistry, Tehran, Iran (the Islamic Republic of); 3 University of Alberta - Medical Genetics, Edmonton, Canada
ABSTRACT
This work aimed to determine whether seropositivity to Helicobacter pylori infection was an independent risk factor for hyperhomocysteinemia patients with cardiovascular disease. The H. pylori IgG, IgA and homocystein levels in 96 patients with cardiovascular disease and 64 participants free of cardiovascular disease as control subjects were determined by ELISA assay. The results showed that seropositivity to H. pylori IgG and IgA levels of coronary artery disease (CAD)patients was significantly higher than the controls and CAD patients with H. pylori IgG and IgA negative antibodies. A significant correlation was found between the seropositivity to H. pylori IgG and homocysteine levels of CAD patients in comparison with the controls and CAD patients with seronegativity to H. pylori IgG and IgA (r=0.233, P= 0.019 ). The involvement of H. pylori infection in atherosclerosis process was based on the chronic inflammation, which might facilitate the CAD-related pathologies. The effect of the presence of H. pylori infection on homocysteine levels elevation in the CAD patients (as a risk factor independent of other traditional factors) was remarkable.
Key words: Cardiovascular disease, ELISA assay, homocysteine, Helicobacter pylori
INTRODUCTION
Cardiovascular disease is the most common cause of mortality and morbidity in the United States and many other nations (Reddy-Vanga et al. 2010). Coronary atherosclerosis process is multi-factorial. Traditional and classic cardiovascular risk factors such as diabetes mellitus (DM), hypertension (HTN), smoking and obesity have introduced as major causes, but significant proportions of the patients with coronary artery disease (CAD) do not have these traditional risks. Other factors, which may affect this chronic process, have been evaluated (Folsom et al. 1998; Reddy-Vanga et al. 2010; Rogha et al. 2012). For example,
infection-related chronic inflammation from Helicobacter
pylori (H. pylori) is one of the CAD risk factors, because the CAD risk factors plasma fibrinogen, C-reactive protein, and blood leukocyte count become elevated in the seropositive subjects (Folsom et al. 1998). H. pylori infection is the most common infection worldwide, especially in the developing countries (Rogha et al. 2012). According to many reports, 70-90% of apparently healthy people of developing countries are estimated to be infected with H. pylori (Rogha et al. 2012; Chmiela et al. 2015; Javadi et al. 2015).
H. pylori is a Gram-negative bacterium with perfect adaptation to the acidic environment of the stomach and high affinity to gastric epithelial cells. Recently, possible association between H. pylori infection and extragastric disorders has been also suggested (Franceschi et al. 2006; Pacifico et al. 2010; Pacifico et al. 2014). An indirect
association between the prevalence of H. pylori
and the occurrence of CAD is demonstrated by many research studies (Rogha et al. 2012; Chmiela et al. 2015; Javadi et al. 2015). A significant association of H. pylori infection with CAD (OR 3.18, 95% CI 1.08-9.40) was shown by a multivariate logistic regression analysis (Rogha et al. 2012). According to majority of findings, the
involvement of H. pylori in this process was based
on the chronic inflammation, which might facilitate the CAD-related pathologies (Rogha et al. 2012; Chmiela et al. 2015). Several
mechanisms have been proposed for how H. pylori
might accelerate macrovascular complications and increase CAD risk (Cenerelli et al. 2002; Rogha et al. 2012; Javadi et al. 2015). It has been demonstrated that H. pylori is an important and serious cause of elevated levels of homocysteine
(HCY) and is prevalent in the Caucasian population, ranging from 30 to 40% incidence. On the other hand, HCY is recognized as an
independent risk factor for cardiovascular
diseases. HCY has been demonstrated to be toxic to the endothelial cells and lipoproteins due to generation of oxygen radicals. High level of HCY appears to be one of the factors responsible for the increased risk of vascular damage and clinical CAD events (Sacco et al. 2004). A study on 116 patients with CAD who were matched with 116 controls via age and sex although showed a minor
association between H. pylori infection and CAD.
However, a stronger correlation between higher levels of triglycerides (fats) and lower levels of high density highdensity lipoprotein (HDL)
-cholesterol was found in the H. pylori-infected
patients (Laurila et al. 1999; Ekesbo et al. 2000; Hoffmeister et al. 2001; Kowalski 2001). Based on the above findings, these results could be
consistent with the hypothesis that H. pylori
infection might modify the serum lipid
concentrations in a way that could increase the risk of CAD (Sacco et al. 2004). Hence, knowing the inflammation as a cardiovascular risk factor in the
one hand and H. pylori and
hyper-homocysteinemia involvement in CAD incidence on the other hand could be interesting to evaluate the H. pylori infection effect on HCY levels and atherosclerosis processes.
Thus, this study examined whether H. pylori
seropositivity was associated with
hyperhomocysteinemia and cardiovascular disease occurrence.
MATERIAL AND METHODS
Sampling and Coronary Angiography
This study was approved by the Ethical Committee of Iran University of Medical Sciences. The cross-sectional study was performed in Rasool Akram Hospital of Tehran from June 2014 to October 2014. Ninety six consecutive CAD patients (68 men and 28 women; mean age 52. 95 ± 1.25 and 51.32 ± 1.61 years old, respectively) and 64 controls were enrolled into the study and candidates for coronary angiography and informed consent were selected. Before catheterization, all
the subjects completed a semi-structured
angiography was carried out by left-heart catheterization and arteriography using Judkins method, and then a cardiologist separately reviewed the angiography films. According to angiography reports, the clinical and laboratory
evaluated patients with ≥50% coronary stenosis
were considered as CAD positive group and participants with <50% coronary stenosis were considered as CAD negative group, or controls. Accordingly, patients with hepatic dysfunction, autoimmune disease, thyroid dysfunction and/or adrenal dysfunction as well as patients who consumed any kinds of glucocorticoids were excluded from the study.
Biochemical Measurements
Fasting blood sample of catheterization
participants were taken to measure lipid profiles,
immunoglobulins G and A (anti H. pylori IgG and
IgA) and homocysteine levels. ELISA kit (Diagnostic kit, PISHTAZ TEB Company, Teheran, Iran) was used to measure the
homocysteine levels. Anti-H. pylori antibody
status was determined by measuring the IgG and IgA antibody by ELISA assay (Diagnostic kit, PISHTAZ TEB Company). Spectrophotometric assay was used for lipid profiles assay.
Statistical Data Analysis
Statistical analyses were carried out using SPSS software (version 16.0, Chicago, IL, USA). Unpaired student t-tests and ANOVA test were used for comparing the continuous variable. Chi-square test was used for discrete variables. To
compare the association of H. pylori infection with
homocysteine and thereby CAD, logistic
regression tests were used by adjusting the sex and age plus history of diabetes, dyslipidemia, and/or hypertension.
RESULTS
Demographic characteristics of four study groups are shown in Tables 1 and 2. No significant differences were found in terms of demographic characteristics between the CAD patients and
controls with anti-H. pylori IgG positive and
negative and between the CAD patients and
controls with anti-H. pylori IgA positive and
negative. As shown in Table 1, the anti-H. pylori
IgG (72.49 ± 3.64U/mL) and IgA (46.72 ± 3.24 U/mL) levels of CAD patient with positive anti
-H. pylori IgG were significantly more than those were found in the CAD patients with negative
anti-H. pylori IgG (9.34 ± 2.11 and 12.20 ± 1.15
U/mL). The values of 8.05 ± 0.40 and 15.48 ± 3.18
U/mL were achieved for anti-H. pylori IgG and
anti-H. pylori IgA of controls with negative
anti-H.P. IgG, respectively, which were lower significantly than those found for CAD patient
with positive and negative anti-H. pylori IgG. The
anti-H. pylori IgG (67.21 ± 4.00 U/mL) and
anti-H. pylori IgA (38.90 ± 3.68 U/mL) levels of the control group with positive anti-H. pylori IgG
were lower than CAD patient with positive anti-H.
pylori IgG but significantly higher than negative
anti-H. pylori IgG CAD patients.
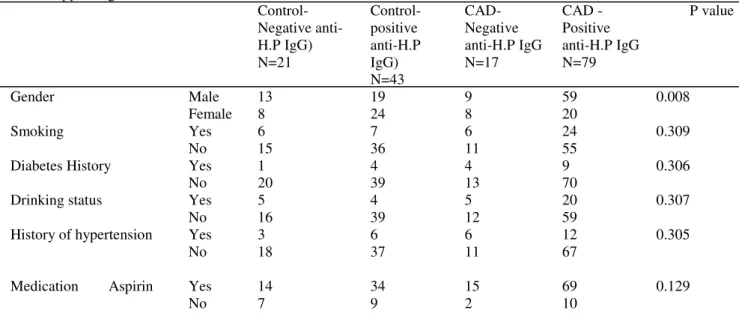
Table 1 - Demographic characteristics of CAD patients and controls with positive and negative
anti- H. pylori IgG
Control- Negative anti-H.P IgG) N=21 Control- positive anti-H.P IgG) N=43 CAD-Negative anti-H.P IgG N=17 CAD -Positive anti-H.P IgG N=79 P value
Gender Male 13 19 9 59 0.008
Female 8 24 8 20
Smoking Yes 6 7 6 24 0.309
No 15 36 11 55
Diabetes History
Drinking status
History of hypertension
Yes 1 4 4 9 0.306
0.307 0.305 No Yes No Yes No 20 5 16 3 18 39 4 39 6 37 13 5 12 6 11 70 20 59 12 67
Medication Aspirin Yes 14 34 15 69 0.129
Statin Yes 8 18 13 59 <0.001
No 13 25 4 20
Lozartan Yes 5 7 5 21 0.577
No 16 36 12 58
Anti H.P IgG( U/mL) 8.05 ± 0.40 67.21 ± 4.00 9.34 ± 2.11 72.49 ± 3.64 <0.001 Anti H.P IgA (U/mL) 15.48 ± 3.18 38.90 ± 3.68 12.20 ± 1.15 46.72 ± 3.24 <0.001 LDL-C ( mg/dL) 105.16 ± 6.84 93.97 ± 3.87 99.27 ± 5.41 98.37 ± 3.08 0.507 HDL-C( mg/dL) 39.53 ± 2.60 38.06 ± 2.06 35.07 ± 1.64 36.96 ± 0.93 0.550 Cholesterol ( mg/dL) 189.26 ± 11.28 167.58 ± 6.37 168.80 ± 7.85 169.12 ± 4.27 0.199 TG ( mg/dL) 152.89 ± 22.46 142.25 ±16.29 174.07 ± 23.64 126.53 ± 7.19 0.154 FBS( mg/dL) 102.40± 4.96 103.21± 6.84 106.26± 6.60 104. 08± 2.53 0.983 Age(years) 57.76 ± 2.36 55.49 ± 1.65 56.35 ± 2.47 59.79 ± 1.23 0.187 SBP(mmHg) 126.55 ± 2.61 131.79 ± 2.98 132.40 ± 1.82 131.04 ± 15.70 0.652 DBP(mmHg) 78.35 ± 2.19 80.02 ± 1.91 81.27 ± 2.48 83.15 ± 1.56 0.366 BMI (Kg/m2) 27.42± 0.74 27.58± 0.46 27.58± 0.96 26.41 ± 0.27 0.224
Anti H.P, anti-Helicobacter pylori; BMI, body mass index; FBS, fast blood sugar; HDL, high-density lipoprotein; LDL-C, low-density lipoprotein; SBP, systolic blood pressure; TG, triglyceride; DBP=diastolic blood pressure. Values are means±sd
According to Table 2, 64.96 ± 2.97 and 43.63 ± 3.07 U/mL of anti-H. pylori IgG and anti-H. pylori IgA, respectively of CAD patient with positive H. pylori IgA were significantly higher than those found for the CAD patients with negative anti-H. pylori IgA (21.16 ± 11.20 and 7.40 ± 0.48 U/mL). Controls with the negative
anti-H. pylori IgA (15.62 ± 5.31 and 6.61±
0.63U/mL) and the control subjects with positive
anti-H. pylori IgA (56.81 ± 4.72 and 38.06 ± 324
U/mL) respectively. As shown in Table 3 and
Figure 1 (A), the serum homocysteine
concentration of the CAD patients with positive
anti-H. pylori IgG (27.70 ± 1.28 µmol/L) was
significantly (P= 0.05) higher than CAD patients with negative anti-H. pylori IgG (22.16 ± 2.19 µmol/L). The difference between the HCY levels of CAD patients with positive anti-H. pylori IgG (27.70± 1.28µmol/L and the control group with positive anti-H.P. IgG (22.38 ± 1.19 µmol /L) was significant (P=0.02). The homocysteine levels of
the CAD patients with positive anti-H. pylori IgG
(27.70 ± 1.28 µmol/L) was significantly (P=0.02)
higher than the control subjects with negative anti-H.P IgG positive (20.62 ± 1.51 µmol /L). The serum homocysteine concentration of the control subjects with negative anti-H.P IgG positive (22.38 ± 1.19 µmol /L) and control group with negative anti-H.P IgG (20.62± 1.51 µmol /L) was not different significantly (P= 0.936). A significant correlation with r= 0.233 , P=0.0.19 was identified between anti-H. pylori IgG and homocysteine levels of the CAD patients with positive anti-H. pylori IgG (Fig.1 B), while the correlation between the anti-H. pylori IgG and homocysteine levels of CAD patients with
negative anti-H. pylori IgG was not significant (r=
0.005, P=0.493). The correlation between the
anti-H. pylori IgG and homocysteine levels of the control group with positive and negative anti-H.P IgG was not significant (r= -0.071, P=0.325 and r= -0.071, P=0.325, respectively). It is worth to note that correlation between the anti-H. pylori
IgG and homocysteine levels of all the subjects was significant (r= 0.233, P=0.002).
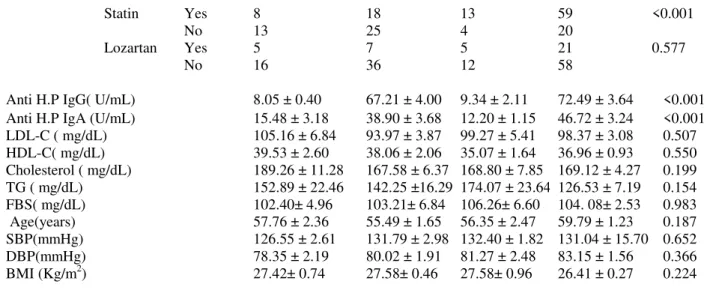
Table 2 - Demographic characteristics of CAD patients and controls with positive and negative H. pylori anti IgA
Control- Negative anti- H.P IgA N-14
Control-Positive anti-H.P IgA N=50
CAD-Negative anti-H.P IgA N=8
CAD-Positive anti-H.P IgA N=88
P value
Gender Male 7 25 6 62 0.067
Female 7 25 2 26
Smoking Yes 4 9 3 27 0.372
No 10 41 5 61
No 13 46 6 77
Medication Aspirin Yes 9 39 6 78 0.089
No 5 11 2 10
Statin Yes 5 21 6 66 <0.001
No 9 29 2 22
Lozartan Yes 4 8 2 24 0.458
No 10 42 6 64
Anti H.P IgG( U/mL) 15.62 ± 5.31 56.81 ± 4.72 21.16 ± 11.20 64.96 ± 2.97 <0.001 Anti H.P IgA( U/mL) 6.81 ± 0.63 38.06 ± 3.24 7.40 ± 0.48 43.63 ± 3.07 <0.001 LDL-C( mg/dL) 100.25 ± 7.79 97.24 ± 3.98 107.25 ± 9.10 97.67 ± 92.02 0.768 HDL-C( mg/dL) 39.42 ± 2.40 38.33 ± 1.96 39.75 ± 3.25 36.36 ± 0.85 0.501 Cholesterol( mg/dL) 178.77 ± 9.79 173.93 ± 7.02 176.88 ± 11.61 168.33 ± 4.00 0.728
TG( mg/dL) 165.85 ± 28.64 139.76 ±
14.73
192.50 ± 35.53 128.71 ± 6.68 0.099
FBS( mg/dL) 99.07 ± 6.27 104.08± 6.05 112.62 ± 8.99 103.72 ± 2.53 0.817 Age(years) 57.79 ± 3.10 55.80 ± 1.50 59.12 ± 2.99 59.18 ± 1.19 0.370 SBP(mmHg) 128.36 ± 3.06 130.60 ± 2.71 134.43 ± 4.46 131.00 ± 1.78 0.882 DBP (mmHg) 78.64 ± 2.71 79.73 ± 1.74 81.29 ± 3.10 82.96 ± 1.46 0.418 BMI(kg/m2) 27.99 ± 0.79 27.53 ± 0.44 26.65 ± 1.51 26.61 ± 0.37 0.306
Anti H.P, anti-helicobacter pylori; BMI, body mass index; FBS, fast blood sugar; HDL, high-density lipoprotein; LDL-C, low-density lipoprotein; SBP= systolic blood pressure; TG, triglyceride; DBP=diastolic blood pressure. Values are means±sd
As shown in Table 4 and Figure 2 A, there was not a significant (P=1) difference between the homocysteine levels of the CAD patients with
positive anti-H. pylori IgA (24.70 ± 0.80 µmol/L
as comparison with the CAD patients with
negative anti-H. pylori IgA (26.50 ± 4.49 µmol/L).
Serum homocysteine concentration of the CAD patients with positive anti-H. pylori IgA (24.70 ± 0.80 µmol/L µmol/L) was not significantly (P= 0.1) higher than the control subjects with positive
anti-H. pylori IgA (22.79 ± 1.12 µmol/L) but was
higher than the controls with negative anti-H.P. IgA positive (17.85 ± 1.07 µmol/L) significantly
(P=0.01). The difference between the
homocysteine levels of the control subjects with positive anti-H.P IgA (22.79 ± 1.12 µmol /L) and
controls with negative anti H. pylori IgA (17.85 ±
1.07 µmol/L) was not different significantly (P=0.34). Serum homocysteine concentration of
the CAD patients with negative anti-H. pylori IgA
(26.50 ± 4.49 µmol/L) was not significantly (P= 0.75) higher than the control subjects with positive
anti-H. pylori IgA (26.50 ± 4.49 µmol /L). A
significant correlation (P<0.001, r=0.691) was
found between the anti- H. pylori IgA and anti H.
pylori IgG of CAD patients in comparison with non-CAD patients (Fig. 3).
Figure 1-(A): Homocysteine levels of CAD patients with positive and negative anti H. pylori IgG and controls with
levels of CAD patients with positive and negative anti H. pylori IgG and of controls with positive and negative anti H. pylori IgG groups were identified.
A) 4 P=0.020 (in comparison with 1); 4 P=0.020 (in comparison with 2); 4, P=0.0 5 (in comparison with 3); 3, P=1.000 (in comparison with 2); 2, P=0.936 (in comparison with 1); 3, P=0. 935 (in comparison with 1);
Correlation in all subjects, r= 0.233, P=0.002; ○) Correlation in controls with negative anti H. pylori IgG,
r= 0.324, P= 0.076; □) Correlation in controls with positive anti H. pylori IgG, r= -0.071, P=0.325; ♦)
Correlation in CAD patients with negative anti H. pylori IgG, r= 0.005, P=0.493; ♦♦) Correlation in CAD patients with positive anti H. Pylori IgG, r= 0.233, P=0.0.19.
Table 3 - Homocysteine and anti H. pylori IgG and IgA levels of CAD patients with positive and negative anti-H.P
IgG
Control (Negative anti-H.P IgG) n=21
Control (Positive anti-H.P IgG) n=43
CAD (Negative anti-H.P IgG ) N=17
CAD (Positive
anti-H.P IgG) N=79
P value
Gender Male 13 19 9 59 0.008
Female 8 24 8 20
Smoking Yes 6 7 6 24 0.309
No 15 36 11 55
Diabetes History Yes 1 4 4 9 0.306
No 20 39 13 70
Medication Aspirin Yes 14 34 15 69 0.129
No 7 9 2 10
Statin Yes 8 18 13 59 <0.001
No 13 25 4 20
Lozartan Yes 5 7 5 21 0.577
No 16 36 12 58
Hemocysteine( µmol/L ) 20.62 ± 1.51 22.38 ± 1.19 22.16 ± 2.19 27.70 ± 1.28 0.003 Anti H.P IgG ( U/mL ) 8.05 ± 0.40 67.21 ± 4.00 9.34 ± 2.11 72.49 ± 3.64 <0.001 Anti H.P IgA ( U/mL) 15.48 ± 3.18 38.90 ± 3.68 12.20 ± 1.15 46.72 ± 3.24 <0.001
Anti H.P, anti Helicobacter pylori; Values are means± sd
Table 4 - Homocysteine and anti H. pylori IgG and IgA levels of CAD patients with positive and negative anti H.
pylori IgA and the control subjects with positive and negative anti-H. Pylori IgA
Controls-Negative anti-H.P IgA N=14
Controls-positive anti-H.P IgA N=50
CADs-Negative anti-H.P IgA N=8
CADs- Positive anti-H.P IgA N=88
P value
Gender Male 7 25 6 62 0.067
Female 7 25 2 26
Smoking Yes 4 9 3 27 0.372
No 10 41 5 61
Diabetes History Yes 1 4 2 11 0.490
No 13 46 6 77
Medication Aspirin Yes 9 39 6 78 0.089
No 5 11 2 10
Statin Yes 5 21 6 66 <0.001
No 9 29 2 22
Lozartan Yes 4 8 2 24 0.458
No 10 42 6 64
Hemocysteine (µmol/L) 17.85 ± 1.07 22.79 ± 1.12
26.50 ± 4.49 24.70 ± 0.80
0.007
4.72 2.97
Anti H.P IgA(U/ml) 6.81 ± 0.63 38.06 ±
3.24
7.40 ± 0.48 43.63 ± 3.07
<0.001
Values are means±sd
Figure 2- (A): Homocysteine levels of the CAD patients with positive and negative anti-H. pylori IgA and controls
with positive and negative anti-H. pylori IgA. (B): The correlation between the homocysteine and anti-H. pylori IgA levels of CAD patients with positive and negative anti-H. pylori and of the controls with positive and negative anti H. pylori IgA groups.
A) 4 P=0.011(in comparison with 1); 4 P=0.114(in comparison with 2); 4, P=1.000 (in comparison with 3); 3, P=0.197(in comparison with 1); 2, P=0.346 (in comparison with 1); 2, P=0.754(in comparison with 3); B)
Correlation between all groups, r= 0.197, P=0.006; ○) Correlation for controls with negative anti H. pylori
IgA, r= 0.324, P= 0.076; □) Correlation for controls with positive anti H. pylori IgA, r= -0.081, P=0.335; ♦)
Correlation for CAD patients with negative anti H. pylori IgA, r= 0.007, P=0.489; ♦♦) Correlation for CAD
patients with positive anti H. pylori IgA, r= 0.075, P=0.256.
Figure 3- Correlation between anti-H. pylori IgG and anti-H. pylori IgA of patients with the controls. r= 0.691, p<
DISCUSSION
Several studies have demonstrated that
hyperhomocysteinemia and H. pylori infection
have contributed in the cardiovascular disease pathogenesis, independent of other conventional risk factors (Sung and Sanderson 1996; Leung et al. 2001; Sharma and Aggarwal 2015). As shown in Tables 1 and 2, there was not a significant
difference between the demographic
characterization of the patients with CAD and controls. According to Figures 1 A and 2 A, a significant difference was found between anti-H.P. IgG and IgA levels of the patients with CAD (P=
0.020) and controls (P=0.011). Serum
homocysteine concentration of the patients with CAD was more than the controls significantly. A positive correlation was found between the
homocysteine levels and anti-H. pylori IgG in the
patients with CAD as comparison to the control
subjects. It has been proposed that H. pylori
infection might modify the serum homocysteine concentration in a way that could increase the risk of CAD. The results of a case-control study showed that H. pylori infection increased a two-fold risk of CAD (Sung and Sanderson 1996). However, the possible mechanism of a chronic
infection by H. pylori leading to atherosclerosis is
yet to be identified. One of the proposed
mechanisms is that H. pylori chronic infection
increases the acute inflammation factors such as fibrinogen and sialic acid, which are predictors of CAD (Ringnér et al. 1994). In consistent with these results, a higher concentration of fibrinogen and total leukocyte count were reported for the patients with cardiovascular disease and infected by H. pylori as comparison to controls (Patel et al.
1995). The other hypothesis is that chronic H.
pylori infection leads to malabsorption of vitamin B-6, vitamin B-12 and folate, methylation defeat and hyperhomocysteinaemia, thereby inducing arterial damage. It has been shown that nitric oxide secretion from the endothelial cells is inhibited by homocysteine, which comforts platelet aggregation and vasoconstriction. The balance between the procoagulants and anticoagulants might be changed by homocysteine via selective manners such as inhibition of the thrombomodulin processing and releasing, decreasing the protein C activation and inducing a protease activator of coagulation factor V (Sung and Sanderson 1996).
Other mechanisms of H. pylori infection that could
lead to atherosclerosis are destructive influence of
H. pylori and its products like cytokines and cytotoxins on coronary endothelium, activation of immune mechanisms, which react with the nuclei of monocytes in atherosclerotic vessel wall and cytoplasm of fibroblast-like cell in atherosclerosis plaques (Rogha et al. 2012). In agreement with the present results, the results of a study on 93 patients under diagnostic coronary arteriography with
infection H. pylori, showed a significant decrease
of vitamin B12 and folate levels, thereby increasing homocysteine levels. They suggested that homocysteine could induce endothelial damage directly, affect platelet function and coagulation factors and increase the oxidation of LDL-C, which have critical role in cardiovascular disease occurrence (Ringnér et al. 1994). In a
study patients with H. pylori infection exhibited a
decreased secretion of ascorbic acid by gastric mucosa and elevated gastric pH, thereby the folate absorption from the diet was decreased due to low ascorbic acid in gastric juice, and subsequently a significant rise was found in homocysteine levels (Lucock et al. 1995). However, it is important to consider that confounding variables such as vitamin deficiency, acute-phase response to vascular diseases, medication use, hypertension, advanced age and gender are well-known factors influencing homocysteinemia and should be
considered. An inverse relationship was
demonstrated among the homocysteine levels and
H. pylori infection in the patients with functional dyspepsia in a cross-sectional study by Rasool et al. (2012). The authors showed that 46.2% of H. pylori- positive patients had
hyperhomocysteinemia (>15 μmol/L) when
compared to H. pylori- negative group (44%).
They also reported that this was a higher proportion in comparison with that was observed in healthy population (Rasool et al. 2012). The
results demonstrated that H. pylori did affect
directly HCY metabolism in the liver (Cenerelli et al. 2002; Longo-Mbenza et al. 2012). They showed that disrupted metabolism of HCY, which was induced by H. pylori led to an increase of HCY levels similar to those found in diabetic patients. Emphasizing the probable impairment of insulin function regarding the regulation of HCY level through the homocysteine/methionine metabolism, which caused higher levels of HCY
in the CAD patients infected by H. pylori and the
importance of H. pylori infection in determining
In summary, a small sample size was investigated and these observations should be confirmed in a larger sample of the patients with more analysis works. Here, only two independent variables were analysed, but it would be worthwhile to consider other probable variables involving in CAD disease in future studies.
CONCLUSION
The present study demonstrated an inverse relationship between the homocysteine levels and
H. pylori seropositivity (IgG and IgA) and atherosclerosis occurrence in the patients with CAD. Since classic risk factors were not able to explain all cases of CAD, the results of present study suggested that chronic H. pylori infection affected the development or maintenance of CAD, since it induced chronic long term infection within gastric epithelium, which led to not only local but systemic inflammation. According to the present
findings, the involvement of H. pylori in this
process was based on the chronic inflammation,
which might facilitate the CAD-related
pathologies. Moreover, impact of the presence of
H. pylori was found on homocysteine levels in such patients.
ACKNOWLEDGEMENTS
This study was supported by a grant from the University of Medical Sciences. The authors would like to thank Rasool Akram Hospital for providing the samples.
REFERENCES
Cenerelli S, Bonazzi P, Galeazzi R, Testa I, Bonfigli AR, Sirolla C, et al. Helicobacter pylori masks differences in homocysteine plasma levels between controls and type 2 diabetic patients. Eur J Clin Invest. 2002; 32(3): 158-62.
Chmiela M, Gajewski A, Rudnicka K. Helicobacter pylori vs coronary heart disease - searching for connections. World J Cardiol. 2015; 7(4): 187-203. Ekesbo R, Nilsson PM, Lindholm LH, Persson K,
Wadström T. Combined seropositivity for H. pylori and C. pneumoniae is associated with age, obesity and social factors. J Cardiovasc Risk. 2000; 7(3): 191-195.
Folsom AR, Nieto FJ, Sorlie P, Chambless LE, Graham DY. Helicobacter pylori seropositivity and coronary heart disease incidence. Atherosclerosis Risk in
Communities (ARIC) Study Investigators. Circulation. 1998; 98(9): 845-850.
Franceschi F, Roccarina D, Gasbarrini A. Extragastric manifestations of Helicobacter pylori infection. Minerva Med. 2006; 97(1): 39-45.
Hoffmeister A, Rothenbacher D, Bode G, Persson K, März W, Nauck MA, et al. Current infection with Helicobacter pylori, but not seropositivity to Chlamydia pneumoniae or cytomegalovirus, is associated with an atherogenic, modified lipid profile. Arterioscler Thromb Vasc Biol. 2001; 21(3): 427-32.
Javadi L, Pourghassem Gargari B, Salekzamani S, Yousefzadeh R. Folate and homocysteine levels and their association with dietary intakes in Iranian patients infected with Helicobacter pylori: a case-control study. Acta Med Iran. 2015; 53(3): 162-167. Kowalski M. Helicobacter pylori (H. pylori) infection
in coronary artery disease: influence of H. pylori eradication on coronary artery lumen after percutaneous transluminal coronary angioplasty. The detection of H. pylori specific DNA in human coronary atherosclerotic plaque. J Physiol Pharmacol. 2001; 52(1 Suppl 1): 3-31.
Laurila A, Bloigu A, Näyhä S, Hassi J, Leinonen M, Saikku P. Association of Helicobacter pylori infection with elevated serum lipids. Atherosclerosis. 1999; 142(1): 207-210.
Leung WK, Ma PK, Choi PC, Ching JY, Ng AC, Poon P, et al. Correlation between Helicobacter pylori infection, gastric inflammation and serum homocysteine concentration. Helicobacter. 2001; 6(2): 146-150.
Longo-Mbenza B, Nsenga JN, Mokondjimobe E, Gombet T, Assori IN, Ibara JR, et al. Helicobacter pylori infection is identified as a cardiovascular risk factor in Central Africans. Vasc Health Risk Manag. 2012; 6: 455-461
Lucock MD, Priestnall M, Daskalakis I, Schorah CJ, Wild J, Levene MI. Nonenzymatic degradation and salvage of dietary folate: physicochemical factors likely to influence bioavailability. Biochem Mol Med. 1995; 55(1): 43-53.
Pacifico L, Anania C, Osborn JF, Ferraro F, Chiesa C. Consequences of Helicobacter pylori infection in children. World J Gastroenterol. 2010; 16(41): 5181-5194.
Pacifico L, Osborn JF, Tromba V, Romaggioli S, Bascetta S, Chiesa C. Helicobacter pylori infection and extragastric disorders in children: a critical update. World J Gastroenterol. 2014; 20(6): 1379-1401.
Rasool S, Abid S, Iqbal MP, Mehboobali N, Haider G, Jafri W. Relationship between vitamin B12, folate and homocysteine levels and H. pylori infection in patients with functional dyspepsia: A cross-section study. BMC Res Notes. 2012; 5: 206.
Reddy Vanga S, Good M, Howard PA, Vacek JL. Role of Vitamin D in Cardiovascular Health. Am J Cardiol. 2010; 106(6): 798-805.
Ringnér M, Valkonen KH, Wadström T. Binding of vitronectin and plasminogen to Helicobacter pylori. FEMS Immunol Med Microbiol. 1994; 9(1): 29-34. Rogha M, Nikvarz M, Pourmoghaddas Z, Shirneshan
K, Dadkhah D, Pourmoghaddas M. Is helicobacter pylori infection a risk factor for coronary heart disease? ARYA Atheroscler. 2012; 8(1): 5-8.
Sacco RL, Anand K, Lee HS, Boden-Albala B, Stabler S, Allen R, et al. Homocysteine and the risk of ischemic stroke in a triethnic cohort: the Northern Manhattan Study. Stroke. 2004; 35(10): 2263-2269. Sharma V, Aggarwal A. Helicobacter pylori: Does it
add to risk of coronary artery disease. World J Cardiol. 2015; 7(1): 19-25.
Sung JJ, Sanderson JE. Hyperhomocysteinaemia, Helicobacter pylori, and coronary heart disease. Heart. 1996; 76(4): 305–307.