http://www.uem.br/acta ISSN printed: 1679-9275 ISSN on-line: 1807-8621
Doi: 10.4025/actasciagron.v34i2.12616
A comparison of RAPD and ISSR markers reveals genetic diversity
among sweet potato landraces (
Ipomoea batatas
(L.) Lam.)
Monique Moreira Moulin*, Rosana Rodrigues, Leandro Simões Azeredo Gonçalves, Cláudia Pombo Sudré and Messias Gonzaga Pereira
Centro de Ciências e Tecnologias Agropecuárias, Universidade Estadual do Norte Fluminense “Darcy Ribeiro”, Av. Alberto Lamego, 2000, 28013-620, Campos dos Goytacazes, Rio de Janeiro, Brazil. *Author for correspondence. E-mail: moniquemoulin@gmail.com
ABSTRACT. Small farmers have played an important role in maintaining genetic resources of traditional varieties. Collecting and characterizing germplasm, especially landraces and heirloom varieties, are strategic activities that would create a knowledge base describing the traditional varieties of a given region and reduce the risk of genetic erosion. The objectives of this work were as follows: collect sweet potato roots from rural properties and local markets in Rio de Janeiro State, Brazil; characterize the accessions using RAPD and ISSR molecular markers, comparing the efficiency in discrimination of these two types of molecular markers; and estimate the genetic variability of the population. Fifty-nine samples from rural properties and 19 from local markets were studied. A matrix of binary data was developed to analyze the molecular data using the Jaccard index to estimate genetic differences among accessions, and clusters were made using the UPGMA method. The molecular techniques detected genetic variability among the accessions, with cophenetic correlation coefficients (CCC) of 0.80 for RAPDs and 0.89 for ISSRs. The RAPD and ISSR marker results corresponded well, with a correlation of 0.55. All of the accessions were considered distinct, which demonstrates that traditional farmers maintain sweet potato genotypes that have good genetic diversity.
Keywords: genetic resources, germplasm characterization, genetic variability, heirloom seeds.
Comparação dos marcadores RAPD e ISSR na estimativa da diversideade genética entre
acessos de batata-doce (
Ipomoea batatas
(L.) Lam.)
RESUMO. Os pequenos agricultores têm um importante papel na manutenção de recursos genéticos das variedades tradicionais. A coleta e caracterização de germoplasma, especialmente variedades locais e heirloom
são atividades estratégicas que permitem o desenvolvimento de conhecimentos sobre as variedades tradicionais de uma determinada região reduzindo o risco de erosão genética. Os objetivos deste trabalho foram: coletar raízes de batata-doce em propriedades rurais e estabelecimentos comerciais do Estado do Rio de Janeiro, Brasil; caracterizar os acessos usando os marcadores moleculares RAPD e ISSR; e estimar a variabilidade genética na população. Cinquenta e nove amostras coletadas em propriedades rurais e em 19 estabelecimentos comerciais foram estudadas. Uma matriz de dados binários foi desenvolvida para análise dos dados moleculares, usando o índice de Jaccard para estimar a dissimilaridade genética entre os acessos, e os grupos foram obtidos usando o método UPGMA. As técnicas moleculares detectaram variabilidade genética entre os acessos, com correlação cofenética de 0,80 para RAPD e 0,89 para ISSR. O resultado obtido com RAPD e ISSR foi correspondente, com uma correlação de 0,55. Todos os acessos coletados foram considerados distintos, o que demonstra que os agricultores tradicionais da região Norte Fluminense detêm genótipos de batata-doce com expressiva diversidade genética.
Palavras-chave: recursos genéticos, caracterização de germoplasma, variabilidade genética, sementes heirloom.
Introduction
Sweet potato (Ipomoea batatas (L.) Lam.) is considered
one of the least risky vegetables to grow, due to its rusticity, good production in poor soils, low incidence of pests and diseases, high tolerance to drought, low cost, cultivated mainly by small local farmers, and use as a staple food in many areas of the world (ROESLER et al., 2008). Traditionally, sweet potatoes have been
Worldwide, the largest producers of sweet potatoes are China, Indonesia, India and Japan. Brazil is the principal producer in Latin America, with approximately three million tons per year (CAVALCANTE et al., 2009). Nevertheless, little information is available about sweet potato genetic variability and diversity, especially when considering its cultivation in small farms (SOUZA, 2000).
Much of what is known about sweet potatoes is from common knowledge. Some cultivars, although being the same genetically, often have different names depending on the cultivated area, while different cultivars often have the same name (DAROS et al., 2002). Some factors such as changes in food consumers’ preferences, urbanization and the consequent rural exodus, and abandonment of rural properties have resulted in losses of genetic diversity of crops, including staple foods like sweet potato. For these reasons, studies on the genetic variability of contemporary landraces that have been selected for many generations in particular microenvironments are important for conserving these genetic resources. Consequently, collection expeditions should be made throughout the regions where the conservation of these landraces occurs (RITSCHEL; HUÁMAN, 2002).
Sweet potatoes are one of the principal crops cultivated by traditional farmers in Brazil in backyards and small plots, resulting in considerable knowledge and conservation of local varieties (VEASEY et al., 2008). The practice of cultivating local varieties is intrinsically linked to the cultural context of families and to the traditional knowledge associated with their cultures (ALBAGLI; MACIEL, 2004).
The correct identification, characterization and evaluation of conserved genotypes are fundamentally important for genetic improvement programs and for detecting duplicates in germplasm banks (GONÇALVES et al., 2008; LAURENTIN, 2009; SUDRÉ et al., 2010). Genetic divergence can be evaluated based on agronomic, morphological, molecular, biochemical, physiological and other characteristics. Studies with molecular markers have made significant contributions to our understanding of genetic diversity; when compared with other types of markers, they present a greater number of polymorphic loci, which allows distinguishing between accessions that may have similar morphological and agronomical traits (GONÇALVES et al., 2008). Different types of molecular markers are being studied for a wide range of applications including mapping specific genes, selecting genotypes in breeding programs
using marker-assisted selection and in establishing genetic resources. In the last case, the number of studied accessions is usually large, and it is necessary to use strategies and techniques that allow precise discrimination of the accessions, clustering the most similar ones. RAPD and ISSR are often chosen to perform these studies considering the advantages of these molecular techniques compared to other DNA markers. Still, RAPD is sometimes criticized because of lack of reproducibility.
The objectives of this study were as follows: (i) collect sweet potato roots from rural properties and markets in the northern region of the state of Rio de Janeiro, Brazil; (ii) characterize these accessions using RAPD and ISSR and compare the discrimination among accessions using these two types of markers; and (iii) estimate genetic diversity remaining in landraces cultivated in this Brazilian area.
Material and methods
Sweet potato roots were collected from small rural properties and local markets in various areas of northern Rio de Janeiro State, Brazil, in the municipalities of Campos dos Goytacazes and São João da Barra. Fifty-six sweet potato accessions were collected from rural properties, 19 from local markets in Rio de Janeiro state, and two from small farms in the neighboring state of Espírito Santo. Four sweet potato cultivars from Embrapa Hortaliças (‘Princesa’, ‘Brazlândia Roxa’, ‘Brazlândia Branca’ and ‘Brazlândia Rosada’) and one accession of Ipomoea pes-caprae were included in this study, resulting in a total of 82 accessions (Table 1).
Young, healthy, growing leaves were collected in the early morning from greenhouse plants because plants maintained in the dark have lower concentrations of polyphenols that interfere with DNA extraction (BORGES et al., 2009; SHARMA et al., 2008). Leaves of each accession were wrapped in aluminum foil, labeled and immediately immersed in liquid nitrogen to avoid DNA degradation. In the lab, this material was macerated in liquid nitrogen to the consistency of a fine powder. Approximately 100 mg of macerated tissue was transferred to 2.0 mL tubes and immersed in
liquid N2 for DNA extraction, using the protocol of
Sharma et al. (2008), with modifications. DNA quantification was performed in 1.0% agarose gels; the concentrations of the markers were measured
with the program Image, using a 250 bp marker as a
standard for comparison. The DNA was diluted to a
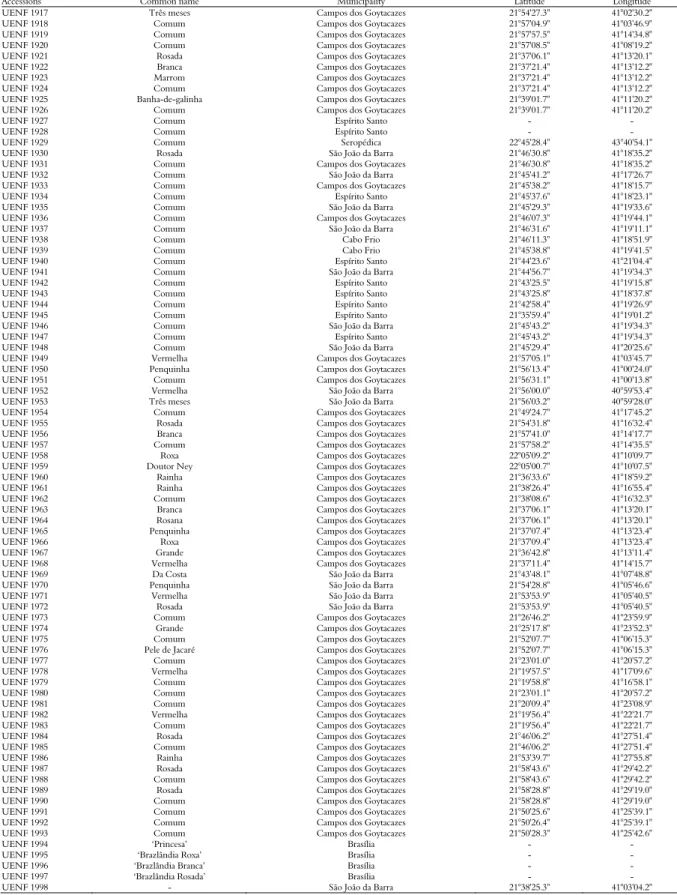
Table 1. Identification of sweet potato accessions, with collection number, common name, municipality, latitude and longitude of the collection sites. Rio de Janeiro, Brazil.
Accessions Common name Municipality Latitude Longitude UENF 1917 Três meses Campos dos Goytacazes 21°54'27.3" 41°02'30.2" UENF 1918 Comum Campos dos Goytacazes 21°57'04.9" 41°03'46.9"
UENF 1919 Comum Campos dos Goytacazes 21°57'57.5" 41°14'34.8" UENF 1920 Comum Campos dos Goytacazes 21°57'08.5" 41°08'19.2"
UENF 1921 Rosada Campos dos Goytacazes 21°37'06.1" 41°13'20.1" UENF 1922 Branca Campos dos Goytacazes 21°37'21.4" 41°13'12.2" UENF 1923 Marrom Campos dos Goytacazes 21°37'21.4" 41°13'12.2"
UENF 1924 Comum Campos dos Goytacazes 21°37'21.4" 41°13'12.2" UENF 1925 Banha-de-galinha Campos dos Goytacazes 21°39'01.7" 41°11'20.2" UENF 1926 Comum Campos dos Goytacazes 21°39'01.7" 41°11'20.2"
UENF 1927 Comum Espírito Santo - -
UENF 1928 Comum Espírito Santo - -
UENF 1929 Comum Seropédica 22°45'28.4" 43°40'54.1" UENF 1930 Rosada São João da Barra 21°46'30.8" 41°18'35.2" UENF 1931 Comum Campos dos Goytacazes 21°46'30.8" 41°18'35.2" UENF 1932 Comum São João da Barra 21°45'41.2" 41°17'26.7" UENF 1933 Comum Campos dos Goytacazes 21°45'38.2" 41°18'15.7" UENF 1934 Comum Espírito Santo 21°45'37.6" 41°18'23.1" UENF 1935 Comum São João da Barra 21°45'29.3" 41°19'33.6" UENF 1936 Comum Campos dos Goytacazes 21°46'07.3" 41°19'44.1" UENF 1937 Comum São João da Barra 21°46'31.6" 41°19'11.1" UENF 1938 Comum Cabo Frio 21°46'11.3" 41°18'51.9" UENF 1939 Comum Cabo Frio 21°45'38.8" 41°19'41.5" UENF 1940 Comum Espírito Santo 21°44'23.6" 41°21'04.4" UENF 1941 Comum São João da Barra 21°44'56.7" 41°19'34.3" UENF 1942 Comum Espírito Santo 21°43'25.5" 41°19'15.8" UENF 1943 Comum Espírito Santo 21°43'25.8" 41°18'37.8" UENF 1944 Comum Espírito Santo 21°42'58.4" 41°19'26.9" UENF 1945 Comum Espírito Santo 21°35'59.4" 41°19'01.2" UENF 1946 Comum São João da Barra 21°45'43.2" 41°19'34.3" UENF 1947 Comum Espírito Santo 21°45'43.2" 41°19'34.3" UENF 1948 Comum São João da Barra 21°45'29.4" 41°20'25.6"
UENF 1949 Vermelha Campos dos Goytacazes 21°57'05.1" 41°03'45.7" UENF 1950 Penquinha Campos dos Goytacazes 21°56'13.4" 41°00'24.0"
UENF 1951 Comum Campos dos Goytacazes 21°56'31.1" 41°00'13.8" UENF 1952 Vermelha São João da Barra 21°56'00.0" 40°59'53.4" UENF 1953 Três meses São João da Barra 21°56'03.2" 40°59'28.0" UENF 1954 Comum Campos dos Goytacazes 21°49'24.7" 41°17'45.2"
UENF 1955 Rosada Campos dos Goytacazes 21°54'31.8" 41°16'32.4" UENF 1956 Branca Campos dos Goytacazes 21°57'41.0" 41°14'17.7" UENF 1957 Comum Campos dos Goytacazes 21°57'58.2" 41°14'35.5"
UENF 1958 Roxa Campos dos Goytacazes 22°05'09.2" 41°10'09.7" UENF 1959 Doutor Ney Campos dos Goytacazes 22°05'00.7" 41°10'07.5" UENF 1960 Rainha Campos dos Goytacazes 21°36'33.6" 41°18'59.2" UENF 1961 Rainha Campos dos Goytacazes 21°38'26.4" 41°16'55.4" UENF 1962 Comum Campos dos Goytacazes 21°38'08.6" 41°16'32.3"
UENF 1963 Branca Campos dos Goytacazes 21°37'06.1" 41°13'20.1" UENF 1964 Rosana Campos dos Goytacazes 21°37'06.1" 41°13'20.1" UENF 1965 Penquinha Campos dos Goytacazes 21°37'07.4" 41°13'23.4"
UENF 1966 Roxa Campos dos Goytacazes 21°37'09.4" 41°13'23.4" UENF 1967 Grande Campos dos Goytacazes 21°36'42.8" 41°13'11.4" UENF 1968 Vermelha Campos dos Goytacazes 21°37'11.4" 41°14'15.7" UENF 1969 Da Costa São João da Barra 21°43'48.1" 41°07'48.8"
UENF 1970 Penquinha São João da Barra 21°54'28.8" 41°05'46.6" UENF 1971 Vermelha São João da Barra 21°53'53.9" 41°05'40.5" UENF 1972 Rosada São João da Barra 21°53'53.9" 41°05'40.5" UENF 1973 Comum Campos dos Goytacazes 21°26'46.2" 41°23'59.9"
UENF 1974 Grande Campos dos Goytacazes 21°25'17.8" 41°23'52.3" UENF 1975 Comum Campos dos Goytacazes 21°52'07.7" 41°06'15.3"
UENF 1976 Pele de Jacaré Campos dos Goytacazes 21°52'07.7" 41°06'15.3" UENF 1977 Comum Campos dos Goytacazes 21°23'01.0" 41°20'57.2"
UENF 1978 Vermelha Campos dos Goytacazes 21°19'57.5" 41°17'09.6" UENF 1979 Comum Campos dos Goytacazes 21°19'58.8" 41°16'58.1"
UENF 1980 Comum Campos dos Goytacazes 21°23'01.1" 41°20'57.2" UENF 1981 Comum Campos dos Goytacazes 21°20'09.4" 41°23'08.9"
UENF 1982 Vermelha Campos dos Goytacazes 21°19'56.4" 41°22'21.7" UENF 1983 Comum Campos dos Goytacazes 21°19'56.4" 41°22'21.7"
UENF 1984 Rosada Campos dos Goytacazes 21°46'06.2" 41°27'51.4" UENF 1985 Comum Campos dos Goytacazes 21°46'06.2" 41°27'51.4"
UENF 1986 Rainha Campos dos Goytacazes 21°53'39.7" 41°27'55.8" UENF 1987 Rosada Campos dos Goytacazes 21°58'43.6" 41°29'42.2" UENF 1988 Comum Campos dos Goytacazes 21°58'43.6" 41°29'42.2"
UENF 1989 Rosada Campos dos Goytacazes 21°58'28.8" 41°29'19.0" UENF 1990 Comum Campos dos Goytacazes 21°58'28.8" 41°29'19.0"
UENF 1991 Comum Campos dos Goytacazes 21°50'25.6" 41°25'39.1" UENF 1992 Comum Campos dos Goytacazes 21°50'26.4" 41°25'39.1" UENF 1993 Comum Campos dos Goytacazes 21°50'28.3" 41°25'42.6"
UENF 1994 ‘Princesa’ Brasília - -
PCR amplification reactions were performed according to the protocol in Williams et al. (1990), with some modifications, in an Eppendorf
thermocycler. The final reaction volume was 13 μL
containing the following: 10 mmol L-1 Tris-HCl,
pH 8.3, 50 mmol L-1 KCl, 2.4 mmol L-1 MgCl
2,
100 µmol L-1 of each of the deoxyribonucleotides
(dATP, dCTP, dGTP and dTTP), 0.4 µmol L-1 of
oligonucleotide primers, 5 ng of genomic DNA and
0.75 units of Taq DNA polymerase. First, 2 μL of
DNA was placed in the tube, and then 11 μL of the
previously described mix was added.
The PCR reactions (GeneAmp PCR System 9700 Thermal cycler - Applied Biosystems) were run under the following conditions: 4 min. at 94ºC for the initial denaturation; followed by 45 cycles consisting of 94ºC for 1 min., 35°C for 1 min., and 72ºC for 3 min.; with a final extension step at 72ºC for 7 min. The contents of each microtube were
stained with 6 μL of a solution of gel red and blue
juice (1:1), for a total volume of 19 μL. The
amplified fragments were separated in 2% agarose gels that were placed under UV light to visualize the
bands (Photodocumented with Minibis Pro –
Bio-imaging System).
The primers were chosen by screening 32 primers. These primers were used on three genotypes with distinct morphological characteristics. The following 18 primers gave good amplification: OPA 9; OPAA 03; OPAA 04; OPAA 11; OPAA 14; OPAA 16; OPAA 20; OPAB 06; OPAB 08; OPAC 07; OPAC 10; OPAC 12; OPAC 14; OPAC 15; OPAC 17; OPAC 20; OPB 17 and OPF 1 (Operon Technologies – California, USA).
For ISSR, the amplifications were run in a
final volume of 19 μL containing the following
reagents: 10 mmol L-1 Tris-HCl, pH 8.3,
50 mmol L-1 KCl, 2.4 mmol L-1 MgCl
2,
100 µmol L-1 of each dNTP, 0.4 µmol L-1 of
oligonucleotide primers, 5 ng of genomic DNA,
and 0.75 units of Taq DNA polymerase. A 2 µL
DNA aliquot was placed in each tube, and the above ingredients were added.
The PCR reactions (GeneAmp PCR System 9700 Thermal cycler - Applied Biosystems) were run as follows: 3 min. at 94ºC for the initial denaturation; followed by 40 cycles consisting of 94ºC for 1 min., 40-55ºC for 1 min. (depending on the primer), and 72ºC for 3 min.; and a final extension step of 72ºC for 7 min. The amplified fragments were separated in 1.5% agarose gel, stained with gel red, and visualized under UV light (photodocumented with Minibis Pro – Bio-imaging System).
The amplification conditions were optimized for each primer to determine the best temperature for
amplification. We used 19 primers: (GAGA)3CC;
(GT)6CC; (CAC)3GC; (AG)8YT; (AC)8CG;
(AC)8CT; (AC)8YG; (CT)8RG; (GGAT)3GA;
(GAA)6AA; (AG)8C; (CT)8G; (AC)8T; (AG)8YA;
(GA)8YT; (CA)8RG; (GT)8YC; (AC)8YC and
(ATG)6 (UCB primers – Columbia, Canada).
The statistical analysis of the data was performed considering a binary matrix that was constructed using the value ‘1’ to indicate band present and ‘0’ to indicate band absent. The monomorphic bands were eliminated. The binary data were submitted to analysis using the program Genes (CRUZ, 2006), and a dendrogram was constructed using the program R (R DEVELOPMENT CORE TEAM, 2009). Clustering was performed using Unweighted Paired Group Method using Arithmetic averages (UPGMA), and the results were validated by calculating the cophenetic correlation coefficient (CCC).
Results and discussion
RAPDs and genetic divergence
The 18 primers listed in Methods amplified 150 bands, of which 145 were polymorphic and five were monomorphic. There was a mean of eight polymorphic fragments per primer. The most polymorphic primer was OPAB 08, which generated 13 bands, followed by OPAC 17, which generated 11 polymorphic bands (Table 2). We observed a high level of polymorphisms with the RAPD-generated markers. Gichuki et al. (2003) used 11 primers (selected by assaying 100 primers) tested on 74 sweet potato accessions from various regions of the world. They found 71 polymorphic markers, with a mean of six polymorphic bands per primer. He et al. (2006) tested 30 RAPD primers on 108 sweet potato accessions (100 local varieties and eight cultivars); they obtained 218 polymorphic markers, with a mean of 7.3 polymorphic bands per primer.
Table 2. RAPD primers used, primer sequences, number of monomorphic and polymorphic bands generated in the study of genetic diversity of 81 accessions of Ipomoea batatas and one of
Ipomoea pes-caprae.
Primers Sequences
5’ – 3’
Polymorphic bands
Monomorphic bands
Total of bands
OPA 9 GGGTAACGCC 8 0 8
OPAA 03 TTAGCGCCCC 5 1 6
OPAA 04 AGGACTGCTC 7 2 9
OPAA 11 ACCCGACCTG 8 0 8
OPAA 14 AACGGGCCAA 10 0 10
OPAA 16 GGAACCCACA 8 0 8
OPAA 20 TTGCCTTCGG 10 0 10
OPAB 06 GTGGCTTGGA 7 0 7
OPAB 08 GTTACGGACC 13 0 13
OPAC 07 GTGGCCGATG 9 0 9
OPAC 10 AGCAGCGAGG 10 0 10
OPAC 12 GGCGAGTGTG 4 1 5
OPAC 14 GTCGGTTGTC 8 0 8
OPAC 15 TGCCGTGAGA 4 1 5
OPAC 17 CCTGGAGCTT 11 0 11
OPAC 20 ACGGAAGTGG 10 0 10
OPB 17 AGGGAACGAG 7 0 7
OPF 1 ACGGATCCTG 6 0 6
Total 145 5 150
The mean genetic distance between the genotypes was 0.49 (± 0.07). Using the Jaccard index, we found that the most distant genotypes were UENF 1953 and UENF 1998, with a distance of 0.77, while accessions UENF 1942 and UENF 1943 were the closest (0.21). The large mean distance that we found is an indication of a high level of genetic diversity. He et al. (2006) reported a range of 0.05 to 0.94, with a mean of 0.36.
RAPD marker distances based on the Jaccard dissimilarity index did not correlate with geographic distance. Gichuki et al. (2003) found that only 6.6% of the accessions that they studied had correlations between genetic and geographic distances. Most of the variability (93.4%) could be observed between genotypes from the same locality or region.
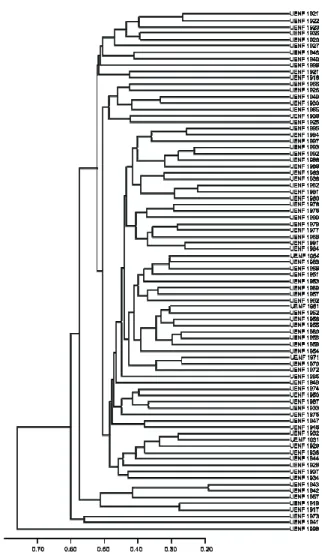
Considering an abrupt point of change at a distance of 0.53, five groups were formed by UPGMA (Figure 1). This result allowed us to
distinguish the Ipomoea pes-caprae species accession
(UENF 1998) separately from other sweet potato accessions, this accession being allocated to group I. Four polymorphic bands were obtained for this accession, corresponding to 11% of the total. Groups II and III comprised only one accession each. Accession UENF 1941 (group II), acquired from a commercial market in the municipality of Vitória, Espírito Santo State, gave five specific bands, (3.5% of the total). Accession UENF 1973 (group III), from a farm in the municipality of Campos dos Goytacazes, gave two specific polymorphic fragments. Group IV consisted of five accessions, three collected from farms in Campos dos Goytacazes (UENF 1917, UENF 1919 and UENF 1967) and two (UENF 1942 and
UENF 1943) from commercial markets. Group V had the largest number of accessions (74). The cultivars from Embrapa (UENF 1994, UENF 1995, UENF 1996 and UENF 1997) were in the same group, though UENF 1996 was distant from the other accessions.
Figure 1. Dendrogram obtained with UPGMA from the Jaccard dissimilarity matrix of 81 accessions of sweet potato and one of
Ipomoea pes-caprae (UENF 1998), based on 145 polymorphic and five monomorphic RAPD markers. Rio de Janeiro State, Brazil.
ISSR and genetic divergence
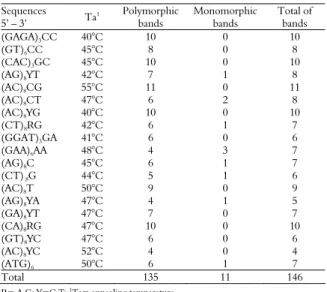
Using 19 primers that were selected previously based on the number of bands that they generated and the polymorphism of these bands (Table 3), we obtained 146 bands, 135 of which were polymorphic (92.4%) and 11 monomorphic (7.6%). Each primer generated a mean of 7.1 polymorphic fragments.
The most polymorphic primer was (AC)8CG (Table
3), which produced 11 bands, followed by the
primers (GAGA)3CC, (CAC)3GC, (AC)8YG and
(CA)8RG, each of which generated 10 polymorphic
Table 3. ISSR primers that were used, optimal annealing temperatures, and number of polymorphic and monomorphic bands that were generated in the study of 81 accessions of Ipomoea batatas and one accession of Ipomoea pes-caprae.
Sequences
5’ – 3’ Ta
1 Polymorphic
bands
Monomorphic bands
Total of bands
(GAGA)3CC 40°C 10 0 10
(GT)6CC 45°C 8 0 8
(CAC)3GC 45°C 10 0 10
(AG)8YT 42°C 7 1 8
(AC)8CG 55°C 11 0 11
(AC)8CT 47°C 6 2 8
(AC)8YG 40°C 10 0 10
(CT)8RG 42°C 6 1 7
(GGAT)3GA 41°C 6 0 6
(GAA)6AA 48°C 4 3 7
(AG)8C 45°C 6 1 7
(CT) 8G 44°C 5 1 6
(AC)8T 50°C 9 0 9
(AG)8YA 47°C 4 1 5
(GA)8YT 47°C 7 0 7
(CA)8RG 47°C 10 0 10
(GT)8YC 47°C 6 0 6
(AC)8YC 52°C 4 0 4
(ATG)6 50°C 6 1 7
Total 135 11 146
R= A,G; Y=C,T; 1Ta= annealing temperature.
A high level of polymorphism based on ISSR markers was found. Hu et al. (2003) used eight ISSR primers previously selected on 34 accessions of
Ipomoea (28 accessions of sweet potato and six accessions of wild species) and obtained 81 polymorphic bands, a mean of 10 bands per primer. However, this mean was based on the eight most polymorphic primers, disregarding the less polymorphic primers.
He et al. (2007) obtained 239 polymorphic markers in 100 sweet potato accessions, using 14 ISSR primers with a mean of 17 bands per primer. This high degree of polymorphism was due to the origin of these accessions, collected from China, New Guinea, and Indonesia, which are considered secondary centers of sweet potato biodiversity.
The ISSR technique provided an efficient assessment of genetic variability in this sweet potato population, as was also found in other studies of this crop (HU et al., 2003; QIANG et al., 2008). The mean distance between genotypes was 0.27 (± 0.07). The Jaccard similarity matrix classified accessions UENF 1934 and UENF 1998 as most distant, with a distance of 0.69. Accessions UENF 1994 (‘Princesa’) and UENF 1995 (‘Brazlândia Roxa’) were the closest, with a distance of 0.05. He et al. (2007) found genetic distances of 0.17 to 1.48, with a mean of 0.57. Qiang et al. (2008) reported genetic distances of from 0.16 to 0.92, with a mean distance of 0.57. The differences in genetic distances observed in these studies were due mainly to differences in the origin of the accessions. He et al.
(2007) and Qiang et al. (2008) worked with accessions from different parts of the world.
The genetic distances based on the Jaccard similarity index, using ISSR markers, did not correlate with geographic distance between the sampling locations, demonstrating that the accessions did not have distance-related genetic variability. This result could be due to the widespread practice of exchanging accessions between neighboring farmers and relatives, resulting in the same genotype having different names in different localities. Veasey et al. (2008), in a study made with microsatellite markers, also did not find correlations between geographic distances and genetic differences among sweet potato accessions collected in Vale do Ribeira, São Paulo Sate. However, Qiang et al. (2008), who used ISSR markers, found an association between genetic and geographic distances working with accessions from various Asian countries, different from the study of Veasey et al. (2008) and our study, in which most accessions were from the same geographic region.
Using an abrupt cutoff point at a distance of 0.30, we distinguished four groups using UPGMA (Figure 2). We were able to separate the accession
I. pes-caprae (UENF 1998) from the other sweet potato accessions, and this accession was allocated to a separate group. For this species, all of the ISSR primers amplified fragments, many of them characteristic of this accession, with 15 specific bands corresponding to 11% of the total number of bands.
Accession UENF 1973, collected from a farm, constituted group II. Group III consisted of the accessions UENF 1996 (from Embrapa), UENF 1988 and UENF 1993, from farms in the municipality of Campos dos Goytacazes. Group IV had the largest number of accessions (77). A total of 109 polymorphic markers were detected in this group, which consisted of accessions collected from farms and markets. This group included the Embrapa cultivars UENF 1994, UENF 1995 and UENF 1997, but not UENF 1996.
Comparison between RAPD and ISSR markers
Figure 2. Dendrogram obtained with UPGMA from the Jaccard dissimilarity matrix of 81 accessions of sweet potato and one of Ipomoea pes-caprae (UENF 1998), based on 145 polymorphic and five monomorphic ISSR markers. Rio de Janeiro State, Brazil.
In a study made with another species that
forms tuberous roots, cassava (Manihot esculenta), a
higher degree of correlation was found (r = 0.75) when RAPDs and AFLPs were compared (COLOMBO et al., 2000).
RAPD markers gave 96.7% polymorphic fragments, while ISSR markers gave 92.4% polymorphic markers, being slightly less polymorphic. Both RAPD and ISSR markers separated the sweet potato accessions from an
accession of another species, Ipomoea pes-caprae
(UENF 1998); specific polymorphic markers confirmed the genetic diversity between these accessions.
Accession UENF 1973 grouped separately; it was allocated to a specific group based both on RAPD and ISSR markers, demonstrating that there was good correspondence between the results generated with these two types of markers. It was also found that the Embrapa cultivars (UENF 1994, UENF 1995 and UENF 1997) grouped together with both types of markers; Brazlândia Branca cultivar (UENF 1996) was allocated farther away based on RAPDs and in a different group based on ISSRs.
Many of the accessions collected from farms and markets grouped similarly with these two techniques. However, the genotypes did not separate by geographic distance based on the two markers.
A possible explanation for the lack of genetic versus geographic distance correlation would be intensive interchange of sweet potato lines among farmers.
Most of the accessions collected from farms and markets clustered in various groups without clear separation, which demonstrates the high variability of sweet potato genotypes in the northern region of Rio de Janeiro state. Both types of molecular markers, RAPDs and ISSRs, demonstrated strong differences and a high degree of polymorphism; no duplicates were detected.
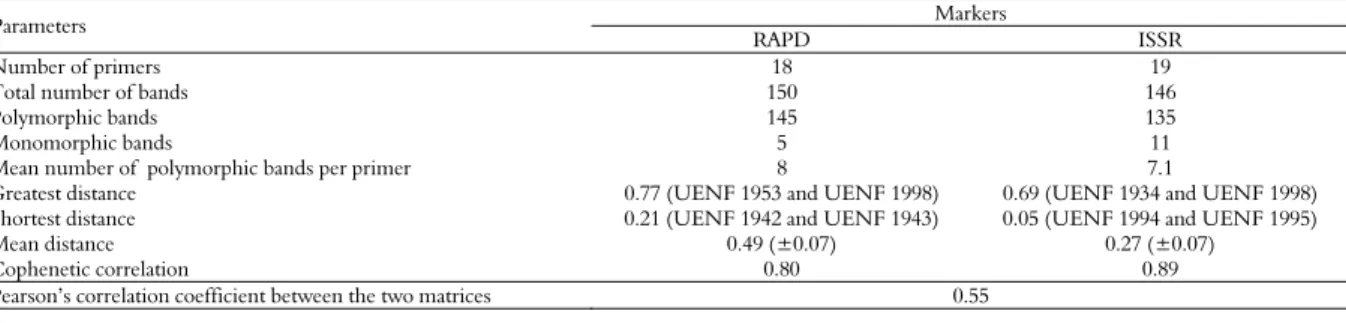
Table 4. Comparison between the use of RAPD and ISSR markers in the analysis of genetic diversity of 81 accessions of sweet potato and one of Ipomoea pes-caprae. Rio de Janeiro State, Brazil.
Markers Parameters
RAPD ISSR
Number of primers 18 19
Total number of bands 150 146
Polymorphic bands 145 135
Monomorphic bands 5 11
Mean number of polymorphic bands per primer 8 7.1
Greatest distance 0.77 (UENF 1953 and UENF 1998) 0.69 (UENF 1934 and UENF 1998)
Shortest distance 0.21 (UENF 1942 and UENF 1943) 0.05 (UENF 1994 and UENF 1995)
Mean distance 0.49 (±0.07) 0.27 (±0.07)
Cophenetic correlation 0.80 0.89
Conclusion
Although anthropic pressure and changing agricultural practices impose a high risk of genetic erosion of agrobiodiversity, for the sweet potato, there is still large genetic variability being conserved by small farmers in Rio de Janeiro State, Brazil.
DNA markers assayed by RAPD and ISSR were consistent in revealing genetic diversity in sweet potato landraces from Rio de Janeiro State and, considering costs, feasibility, lab structure and availability of trained personnel, both techniques can be recommended in characterization of sweet potato genetic resources.
References
ALBAGLI, S.; MACIEL, M. L. Informação e conhecimento na inovação e no desenvolvimento local.
Ciência da Informação, v. 33, n. 3, p. 9-16, 2004. BORGES, A.; ROSA, M. S.; RECCHIA, G. H.; QUEIROZ-SILVA, J. R.; BRESSAN, E. A.; VEASEY, E. A. CTAB methods for DNA extraction of sweetpotato for microsatellite analysis. Scientia Agricola, v. 64, n. 4, p. 529-534, 2009.
CAVALCANTE, M.; FERREIRA, P. V.; PAIXÃO, S. L.; COSTA, J. G.; PEREIRA, R. G.; MADALENA, J. A. S. Potenciais produtivo e genético de clones de batata-doce.
Acta Scientiarum. Agronomy, v. 31, n. 3, p. 421-426, 2009.
COLOMBO, C.; SECOND, G.; CHARRIES, A. Genetic relatedness between cassava (Manihot esculenta Crantz) and
M. flabellifolia and M. Peruviana based on both RAPD and AFLP markers.Genetics and Molecular Biology, v. 23, n. 2, p. 417-423, 2000.
CRUZ, C. D. Programa GENES: estatística experimental e matrizes. Viçosa: UFV, 2006.
DAROS, M.; AMARAL JÚNIOR, A. T.; PEREIRA, T. N. S.; LEAL, N. R.; FREITAS, S. P.; SEDIYAMA, T. Caracterização morfológica de acessos de batata-doce.
Horticultura Brasileira, v. 20, n. 1, p. 43-47, 2002. FONSECA, M. J. O.; SOARES, A. G.; FREIRE JUNIOR, M.; ALMEIDA, D. J.; ASCHERI, J. L. R. Effect of extrusion-cooking in total carotenoids content in cream and orange flesh sweet potato cultivars.
Horticultura Brasileira, v. 26, n. 1, p. 112-115, 2008. GICHUKI, S. T.; GICHUKI, M.; ZHANG, D.; HERMANN, M.; SCHMIDT, J.; GLOSSL, J.; BURG, K. Genetic diversity in sweetpotato [Ipomoea batatas (L.) Lam.] in relationship to geographic sources as assessed with RAPD markers. Genetic Resources and Crop Evolution, v. 50, n. 4, p. 429-437, 2003.
GONÇALVES, L. S. A.; RODRIGUES, R.; AMARAL JÚNIOR, A. T.; KARASAWA, M.; SUDRÉ, C. P. Comparison of multivariate statistical algorithms to cluster tomato heirloom accessions. Genetics and Molecular Research, v. 7, n. 4, p. 1289-1297, 2008.
HE, X.; LIU, Q.; ISHIKI, K.; ZHAI, H.; WANG, Y. ISSR analysis of genetic diversity and relationships among sweet potato (Ipomoea batatas) landraces in China. Plant Genetics and Breeding, v. 150, n. 1, p. 35-41, 2007. HE, X.; LIU, Q.; ISHIKI, K.; ZHAI, H.; WANG, Y. Genetic Diversity and genetic relationships among Chinese Sweetpotato landraces revealed by RAPD and AFLP markers.
Breeding Science, v. 56, n. 2, p. 201-207, 2006.
HU, J.; NAKATANI, M.; LALUSIN, A. G.; KURANOUCH, T.; FUJIMURA, T. Genetic Analysis of sweetpotato and wild relatives using inter-simple sequence repeats (ISSRs). Breeding Science, v. 53, n. 4, p. 297-304, 2003.
LAURENTIN, H. Data analysis for molecular characterization of plant genetic resources. Genetic Resources and Crop Evolution, v. 56, n. 2, p. 277-292, 2009.
MANTEL, N. The detection of disease clustering and a generalized regression approach. Cancer Research, v. 27, n. 2, p. 209-220, 1967.
QIANG, L.; QING-CHANG. L.; HONG, Z.; DAI-FU, M.; XIN, W.; XUE-QIN, L.; YU-PING, W. Genetic diversity in main Parents of Sweetpotato in China as revealed by ISSR markers. Acta Agronomica Sinica, v. 34, n. 6, p. 972–977, 2008.
R DEVELOPMENT CORE TEAM. R: a language and environment for statistical computing. Vienna: R Foundation for Statistical Computing, 2009.
RITSCHEL, P. S.; HUÁMAN, Z. Variabilidade morfológica da coleção de germoplasma de batata-doce da Embrapa-Centro Nacional de Pesquisas de Hortaliças. Pesquisa Agropecuária Brasileira, v. 37, n. 4, p. 485-492, 2002.
ROESLER, P. V. S.; GOMES, S. D.; MORO, E.; KUMMER, A. C. B.; CEREDA, M. P. Produção e qualidade de raiz tuberosa de cultivares de batata batata-doce no oeste do Paraná. Acta Scientiarum. Agronomy, v. 30, n. 1, p. 117-122, 2008.
SHARMA, K.; MISHRA, A. K.; MISRA, R. S. A simple and efficient method for extraction of genomic DNA from tropical tuber crops. African Journal of Biotechnology, v. 7, n. 8, p. 1018-1022, 2008.
SOUZA, A. B. Avaliação de cultivares de batata-doce quanto a atributos agronômicos desejáveis. Ciência e Agrotecnologia, v. 24, n. 4, p. 841-845, 2000.
WILLIAMS, J. G. K.; KUBELIK, A. R.; LIVAK, K. J.; RAFALSKI, J. A.; TINGEY, S. V. DNA polymorphisms amplified by arbitrary primers are useful as genetic markers. Nucleic Acids Research, v. 18, n. 22, p. 6531-6535, 1990.
Received on February 24, 2011. Accepted on June 5, 2011.