www.ccarevista.ufc.br ISSN 1806-6690
Determination of the genetic variation in Ajowan (
Carum Copticum
L.)
populations using multivariate statistical techniques
1Determinação da variação genética em populações de Ajowan (
Carum Copticum
L.)
usando técnicas estatísticas multivariadas
Mahdieh Dalkani2, Abbas Hassani3 e Reza Darvishzadeh4*
ABSTRACT -The experiment was conducted at Urmia University, to assess genetic diversity in populations of Iranian Ajwain based on agronomical and morphological characteristics. Ten populations, collected from different regions, were evaluated in a completely randomised design with eight to ten replications. Various agronomical and morphological characteristics were measured, including stem diameter, plant height, number of branches, number of leaves and leaflets, number of umbels, number of umbellules per inflorescence, number of flowers per umbellule with inflorescence, leaf length, average internodal distance, shoot dry matter, one hundred seed weight, number of seeds, biological production, single plant yield, length of ripening period and harvest index. Among the characteristics studied, a high coefficient of variation was observed for the number of seeds (197.58), single plant yield (57.56) and shoot dry matter (56.28). Broad-sense heritability for all of the characteristics studied was moderate to high, and varied from 0.41 to 91% with the exception of the number of branches, length and ripening period, which had low broad-sense heritability. Cluster analysis using Ward’s method classified ten populations of Ajwain into four groups. Principal Component Analysis (PCA), using 18 agronomical and morphological characteristics, indicated that the first two principal components (PCs) with eigenvalues of more than one, accounted for 74.5% of the total variance. The results of the PCA were consistent with those of the cluster analysis. The present study demonstrates that populations of Ajwain from Iran displayed a considerable diversity of agronomical and morphological characteristics that are useful in germplasm management and for utilisation in improvement programs.
Key words: Ajwain. Genetic diversity. Heritability.
RESUMO - O experimento foi conduzido na Universidade de Urmia para avaliar a diversidade genética em populações iranianas de Ajowan, baseada em características agro-morfológicas. Dez populações, coletadas em diferentes regiões, foram avaliadas num delineamento inteiramente casualizado, com oito a dez repetições. Foram avaliadas várias características agro-morfológicas, como o diâmetro do caule, altura da planta, número de ramos, número de folhas e folíolos, número de umbelas, número de umbelas em uma inflorescência, número de flores por umbelas e inflorescência, comprimento da folha, média distância internodal, peso seco da parte aérea, peso de cem sementes, número de sementes, rendimento biológico, rendimento por planta única, duração do período de maturação e índice de colheita,. Entre as características estudadas, um coeficiente de variação alto foi observado para o número de sementes (197,58), rendimento por planta única (57,56) e peso seco da parte aérea (56,28). As herdabilidades de sentido amplo, para todas as características estudadas, foram de moderadas a altas, e variaram de 0,41a 91%, com excepção do número de ramos e das características de comprimento e período de maturação, que teve baixa herdabilidade de sentido amplo. A análise de agrupamento, utilizando o método de Ward, classificou as dez populações de Ajowan em quatro grupos. A análise do componente principal, usando 18 características agro-morfológicas indicou que os primeiros dois componentes principais (PCs), com valores próprios de mais que um, representaram 74,5% da variância total. Os resultados da PCA foram consistentes com os da análise de agrupamento. O presente estudo demonstra que as populações Ajowan do Irã apresentaram uma diversidade de características agro-morfológicas considerável, e que são úteis no manejo de germoplasma e em programas de melhoramento.
Palavras-chave: Ajowan. Diversidade genética. Herdabilidade. *Autor para correspondência
1Recebido para publicação em 02/02/2011; aprovado em 27/02/2012
Part of the Masters Thesis of the first author presented at the Graduate Program in Medicinal Plant Production from the Urmia University, Urmia, Iran
INTRODUCTION
Ajowan (Carum copticum L.), which contains 2n = 18 chromosomes, is a grassy annual plant from the Apiaceae family that grows in the east of India. It has white flowers and small, brownish seeds that are useable in the medicinal industry (ZARGARY, 1988). Ajowan is an aromatic seed spices, and it is generally used as a digestive stimulant or to treat liver disorders. Thymol, which is the major phenolic compound in Ajowan, has been reported to be a germicide, antispasmodic, and antifungal agent (NAGALAKSHMI; SHANKARACHARYA, 2000). P-cimene, -terpinene, -pinene, and -pinene are other components of Ajowan essential oil (MAJNOON HOSSEINI; DAVAZDAH EMAMI, 2007).
Many medicinal and aromatic plants are not cultivated, and wild populations are gathered to meet demands. Because the production of a stable quality and quantity of these plants is important to a growing world market, it is necessary to breed varieties with high yield and quality.
The analysis of genetic diversity in germplasm collections facilitates the reliable classification of accessions and the identification of subsets or core accessions, and this may be used for specific breeding purposes (MOHAMMADI; PRASANNA, 2003). Plant breeders can use data regarding genetic similarity to complement phenotypic information in the development of breeding populations (GREENE; GRITSENKO; VANDEWARK, 2004; NIENHUIS et al., 1993; YUZBASIOGLU; OZGAN; ACIK, 2006). The future of successful breeding programs depends on the availability of genetic variability to increase productivity.
Morphological characterisation is the first step in the description and classification of germplasm collections (SMITH; AI-DOS; WARBURTON, 1991). Morphological characteristics are the strongest determinants of the agronomic value and taxonomic classification of plants. When they are compared with other means, morphological evaluations are direct, inexpensive, and easy. However, morphological estimations are more dependent on the environment. The reliability of these measurements can be improved by the effective control of environmental variation or by the use of experimental repetition over several years. Multivariate analyses can be used to determine how to identify groups of accessions that have desirable traits for breeding, how to form core collections, and how to determine the patterns of variation in germplasm collections (CAMUSSIet al., 1985;
COWEN; FREY, 1987; PEETERS; MARTINELLI, 1989). Multivariate analyses has been used frequently for genetic diversity analysis in many crops, such as vineyard peach (Prunus persica L. Batsch) (NIKOLICet al., 2010), peanut
(Arachis hypogaea L.) (UPADHYAYAet al., 2009), wheat (Triticum spp.) (HAILU et al., 2006), sorghum (Sorgum bicolor L. Moench) (AYANA; BEKELE, 1999), and barley (Hordeum vulgare L.) (CROSS, 1992). This study is the first report regarding the investigation of genetic diversity in Ajowan populations that have been collected from different regions of Iran. These data will help breeders develop high-yielding Ajowan varieties.
MATERIAL AND METHODS
Plant materials and experimental design
Ten Ajowan populations that originated from different regions of Iran (Table 1) were investigated using completely randomised design with eight-ten replications in controlled conditions.The population seeds were sown in a greenhouse in July, 2009 at Urmia University. All of the pots were hand weeded to maintain proper weed control. Data on the following eighteen characters were collected from the plants in each pot: main stem diameter (SD), plant height (PH), number of branches (NB), number of leaves (NL), number of leaflets (NLlet), number of umbels (NU), number of umbellets in an inflorescence (NUI), number of flowers per umblet (NFU), number of flowers in the whole inflorescence (NFWI), leaf length (LL), average internodal length (I), aerial part dry weight (APDW), one-hundred seed weight (HSW), single plant yield (SPY), biological yield (BY), number of seeds (NS), ripening period length (RP) and harvest index (HI). Because the total internodal length corresponds to the plant height, we used the average internodal length per plant as a separate trait that affects plant performance via the branch numbers. The foliage characters were measured in the stage of full bloom, and the traits related to the seeds were recorded after seed harvesting.
Descriptive statistics, such as mean, standard error and coefficient of variation, for each of the 18 studied traits were calculated. The clustering of the genotypes into similarity groups was performed using Ward’s hierarchical algorithm based on the squared Euclidean distances. Ward’s method, which is also called the incremental sum of squares method, uses the within-cluster (squared) distances and the between-cluster (squared) distances (WARD, 1963; WISHART, 1969). Prior to the calculation of the squared Euclidean distance, the data were standardised such that the mean was zero and the variance was one. The pseudo F statistic and the pseudo T2 statistic (JOBSON, 1992)
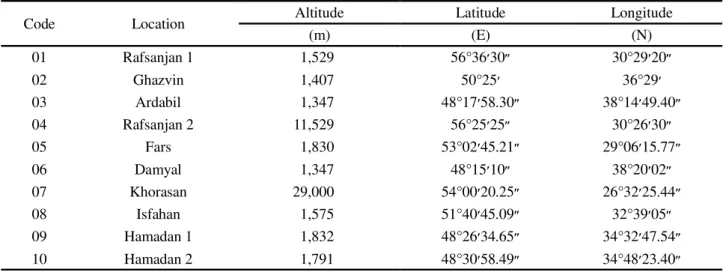
Table 1 - Location of Ajowan populations used in the present study
Code Location Altitude Latitude Longitude
(m) (E) (N)
01 Rafsanjan 1 1,529 56°36 30 30°29 20
02 Ghazvin 1,407 50°25 36°29
03 Ardabil 1,347 48°17 58.30 38°14 49.40
04 Rafsanjan 2 11,529 56°25 25 30°26 30
05 Fars 1,830 53°02 45.21 29°06 15.77
06 Damyal 1,347 48°15 10 38°20 02
07 Khorasan 29,000 54°00 20.25 26°32 25.44
08 Isfahan 1,575 51°40 45.09 32°39 05
09 Hamadan 1 1,832 48°26 34.65 34°32 47.54
10 Hamadan 2 1,791 48°30 58.49 34°48 23.40
Data analysis
(PC) that will explain a maximal amount of variance. These criteria are that each PC explains at least 5% of the variance (WANDER; BOLLERO, 1999), the cumulative variance is at least 75%, and the eigenvalues are greater than one (BREJDAet al., 2000; JEFFERS, 1967). An eigenvalue
of greater than one explains at least as much variance as the variance that is explained by one variable (those on the diagonals of the correction matrix). In other words, the components with an eigenvalue of less than one account for less variance than the original variable (which had a variance of 1); therefore, these components are of little use (TRUXILLO, 2003). When interpreting the principal components, it is often useful to know the correlations of the original variables with the principal components (SWAN; SANDILANDS, 1995). The correlation of variable Xi and the principal component Yj is as follows: rij= a2
ijVar(Yj)/Sij, where Sij is the total variance. The
interpretation of the principal components is based on the finding in which the variables are most strongly correlated with each component.
Genotypic and environmental variances and broad-sense heritabilities were calculated according to Kearsey and Pooni (1996) using the least-square estimates of genetic parameters as follows:
(1)
where, V
g, Ve and Vph are the genotypic, environmental
and phenotypic variance, respectively;MSG andMSE are
the mean square for genotype and error, respectively; and
r is the number of replications. The data processing was performed using Minitab version 14 and SAS version 9.1.
RESULTS AND DISCUSSION
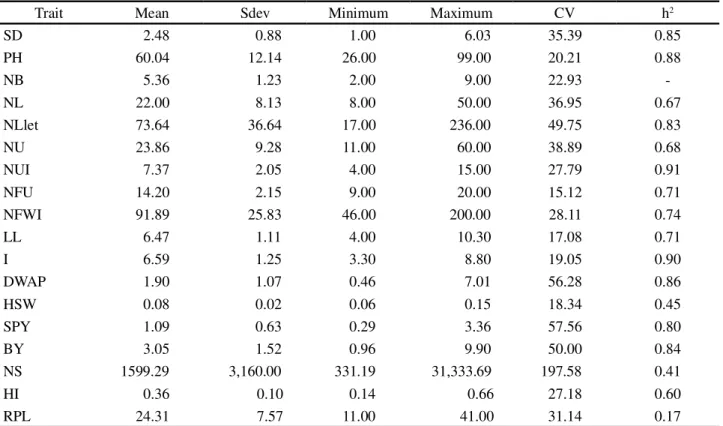
The means, standard deviation, minimum, maximum, coefficient of variation and broad-sense heritabilities estimates for the eighteen studied traits are presented in Table 2. The data from the means reveal the morphological characteristics of the Iranian Ajowan populations (Table 2). The standard deviation shows the amount of variation for each trait among the populations. A higher variation for a character in the breeding materials correlates with a greater ability for its improvement through selection.
To identify the most variant traits among the Iranian Ajowan populations, a coefficient of variation was used that was not dependent on the traits. Among the studied traits, the highest coefficients of variation corresponded to the number of seeds, single plant yield, and aerial parts dry weight. The broad-sense heritabilities for all of the studied traits were moderate to high and varied from 0.41 to 0.91 with the exception of the number of branches and the ripening period length, which had low board sense heritability.
The analysis of the descriptive statistics revealed high genetic variability among the studied Ajowan populations for the studied traits. A descriptive statistical analysis was also used to study genetic variability in some other crops, such as garlic (Allium sativum L.) (PANTHEEet al., 2006), groundnut (Vigna subterranea (L.) Verdc) (NTUNDU
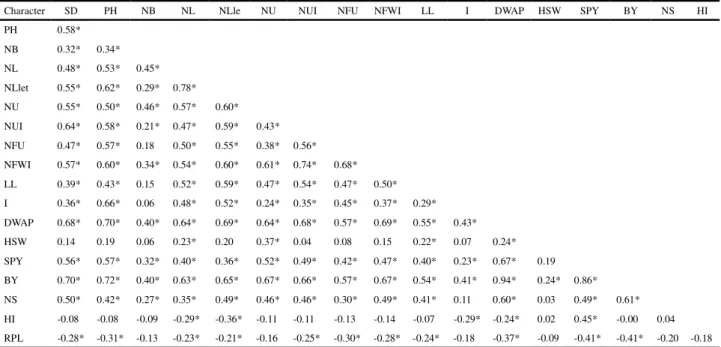
The simple correlation coefficients that were computed between different pairs of characters are presented in Table 3. There were positive and moderately significant linear relationships between most of the studied traits. For example, the number of branches positively and moderately correlated with the number of umbels (r = 0.46;P 0.01). This result is in agreement with the findings of Gurbuz (2001) in coriander and Cosge et al. (2009) in sweet fennel. The plant height and number of umbels were positively and moderately correlated with the number of umbellets. These results are in agreement with the findings of Cosge et al. (2009) with sweet fennel. Significant, positive linear correlations were found between biological yield and plant height and between the number of umbels and the number of umbellets. These results showed that biological yield has a high positive correlation with single plant yield (r = 0.86;
P 0.01). Singh and Mittal (2003) and Cosge et al. (2009) found such results in sweet fennel. However, the harvest index and ripening period length showed negative and moderately significant linear correlations with the studied traits. For instance, the ripening period length had a negative and moderately significant linear
Table 2 - Descriptive statistics of the traits in ten Iranian Ajowan populations
Trait Mean Sdev Minimum Maximum CV h2
SD 2.48 0.88 1.00 6.03 35.39 0.85
PH 60.04 12.14 26.00 99.00 20.21 0.88
NB 5.36 1.23 2.00 9.00 22.93
-NL 22.00 8.13 8.00 50.00 36.95 0.67
NLlet 73.64 36.64 17.00 236.00 49.75 0.83
NU 23.86 9.28 11.00 60.00 38.89 0.68
NUI 7.37 2.05 4.00 15.00 27.79 0.91
NFU 14.20 2.15 9.00 20.00 15.12 0.71
NFWI 91.89 25.83 46.00 200.00 28.11 0.74
LL 6.47 1.11 4.00 10.30 17.08 0.71
I 6.59 1.25 3.30 8.80 19.05 0.90
DWAP 1.90 1.07 0.46 7.01 56.28 0.86
HSW 0.08 0.02 0.06 0.15 18.34 0.45
SPY 1.09 0.63 0.29 3.36 57.56 0.80
BY 3.05 1.52 0.96 9.90 50.00 0.84
NS 1599.29 3,160.00 331.19 31,333.69 197.58 0.41
HI 0.36 0.10 0.14 0.66 27.18 0.60
RPL 24.31 7.57 11.00 41.00 31.14 0.17
SD: stem diameter, PH: plant height, NB: number of branches, NL: number of leaves, Nllet: number of leaflets, NU: number of umbels, NUI: number of umbellets in an inflorescence, NFU: number of flowers per umblet, NFWI: number of flower in the whole inflorescence, LL: leaf length, I: average distance of internodes per plant, DWAP: aerial parts dry weight, HSW: one hundred seed weight, SPY: single plant yield, BY: biological yield, NS: number of seeds, HI: harvest index, RPL: ripening period length, Sdev: standard deviation, CV: phenotypic coefficient of variation, h2: broad-sense heritability
correlation with single plant yield (r = -0.41;P 0.01). The selection for short ripening period length seems to result in an increase in the single plant yield.
Conventional quantitative genetics suggest that trait correlations may be attributable to either pleiotropic effects of single genes or the tight linkage of several genes that individually influence specific traits. The results of correlation studies can be used as an indirect selection to improve seed yield through other characters (DALKANI; DARVISHZADCH; HASSANI, 2011).
The cluster analysis using Ward’s method classified the ten studied Ajowan populations into four groups (Figure 1). The first cluster was composed of two populations including Khorasan and Isfehan; the second was composed of three populations including the RafsanjanI, RafsanjanII and Damyal populations; the third was composed of the Fars population; and the last group was composed of four populations including the Ardabil, Hamadan1, Ghazvin and HamadanII populations.
Table 3 - Correlation matrix among the studied characteristics in the ten Iranian Ajowan populations
Character SD PH NB NL NLle NU NUI NFU NFWI LL I DWAP HSW SPY BY NS HI
PH 0.58*
NB 0.32* 0.34*
NL 0.48* 0.53* 0.45*
NLlet 0.55* 0.62* 0.29* 0.78*
NU 0.55* 0.50* 0.46* 0.57* 0.60*
NUI 0.64* 0.58* 0.21* 0.47* 0.59* 0.43*
NFU 0.47* 0.57* 0.18 0.50* 0.55* 0.38* 0.56*
NFWI 0.57* 0.60* 0.34* 0.54* 0.60* 0.61* 0.74* 0.68*
LL 0.39* 0.43* 0.15 0.52* 0.59* 0.47* 0.54* 0.47* 0.50*
I 0.36* 0.66* 0.06 0.48* 0.52* 0.24* 0.35* 0.45* 0.37* 0.29*
DWAP 0.68* 0.70* 0.40* 0.64* 0.69* 0.64* 0.68* 0.57* 0.69* 0.55* 0.43*
HSW 0.14 0.19 0.06 0.23* 0.20 0.37* 0.04 0.08 0.15 0.22* 0.07 0.24*
SPY 0.56* 0.57* 0.32* 0.40* 0.36* 0.52* 0.49* 0.42* 0.47* 0.40* 0.23* 0.67* 0.19
BY 0.70* 0.72* 0.40* 0.63* 0.65* 0.67* 0.66* 0.57* 0.67* 0.54* 0.41* 0.94* 0.24* 0.86*
NS 0.50* 0.42* 0.27* 0.35* 0.49* 0.46* 0.46* 0.30* 0.49* 0.41* 0.11 0.60* 0.03 0.49* 0.61*
HI -0.08 -0.08 -0.09 -0.29* -0.36* -0.11 -0.11 -0.13 -0.14 -0.07 -0.29* -0.24* 0.02 0.45* -0.00 0.04
RPL -0.28* -0.31* -0.13 -0.23* -0.21* -0.16 -0.25* -0.30* -0.28* -0.24* -0.18 -0.37* -0.09 -0.41* -0.41* -0.20 -0.18
SD: stem diameter, PH: plant height, NB: number of branches, NL: number of leaves, Nllet: number of leaflets, NU: number of ambles, NUI: number of umbellets in an inflorescence, NFU: number of flowers per umblet, NFWI: number of flowers in a whole inflorescence, LL: leaf length, I: average distance of internodes per plant, DWAP: aerial parts dry weight, HSW: one hundred seed weight, SPY: single plant yield, BY: biological yield, NS: number of seeds, HI: harvest index, RPL: ripening period length, *: significant at the 5% probability level
Figure 1 - Ward’s dendrogram of ten Iranian Ajowan populations using squared Euclidean distances
to associate with their geographic origins. Murthy and Arunachalam (1966) showed that genetic drift and selection in different environments can cause greater diversity among genotypes than that caused by geographic distance. Therefore, the selection of parental material for
hybridisation in breeding programs that is simply based on geographic diversity may not be useful. One possible reason for the genetic similarity among germplasms from different regions is that the materials may have originally been introduced from the same region. Crossing between clusters with a maximum inter-cluster distance may result in high heterosis. It has been well documented that crosses that are performed between unrelated (and consequently genetically distant) parents show greater hybrid vigour than crosses that are performed between closely related parents (STUBER, 1994).
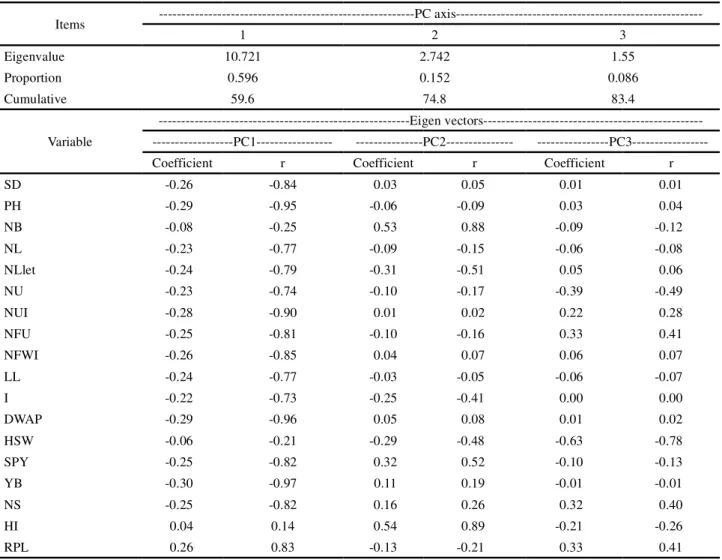
A principal component analysis was used to identify the most significant variables in the data set. The results from the PCA indicated that three principal components have eigenvalues of 10.721, 2.742 and 1.55 (Table 4). The proportion of variance that is explained by the first three PCs is 59.6%, 15.2%, and 8.6%, which satisfied the criteria that were previously described. The cumulative variance explained by 2 PCs is 74.8% (approximately 75%); and the variance that is described by three PCs is 83.4% (TAB. 4). Two principal components are retained because they meet all of the criteria.
associated with biological yield, aerial parts dry weight, number of umbellets in an inflorescence and plant height. The second component (PC2) accounted for 15.2% of the total variation and correlated with the number of branches, number of leaflets, single plant yield and harvest index. The overall observations for the PC analysis for the eighteen agro-morphological traits indicated that most of the agro-morphological trait variations were accounted for by PC1 and PC2. The distribution of the ten Ajowan populations along the first and second principal components that were based on the measured agro-morphological characters is presented in Figure 2. The results of PCA agreed with those of the cluster analysis. These results can now be used by breeders to develop high-yielding Ajowan hybrids.
Figure 2 - Two dimensional plots of the genetic relationships among ten Ajowan populations as revealed by principal component analysis (PCA)
Table 4 - Eigenvalues, proportion of total variability, eigenvectors and correlations between the original variables and the first three principal components (PC) with respect to the ten Ajowan population traits
Items ---PC
axis---1 2 3
Eigenvalue 10.721 2.742 1.55
Proportion 0.596 0.152 0.086
Cumulative 59.6 74.8 83.4
Variable
---Eigen vectors---PC1--- ---PC2---
---PC3---Coefficient r Coefficient r Coefficient r
SD -0.26 -0.84 0.03 0.05 0.01 0.01
PH -0.29 -0.95 -0.06 -0.09 0.03 0.04
NB -0.08 -0.25 0.53 0.88 -0.09 -0.12
NL -0.23 -0.77 -0.09 -0.15 -0.06 -0.08
NLlet -0.24 -0.79 -0.31 -0.51 0.05 0.06
NU -0.23 -0.74 -0.10 -0.17 -0.39 -0.49
NUI -0.28 -0.90 0.01 0.02 0.22 0.28
NFU -0.25 -0.81 -0.10 -0.16 0.33 0.41
NFWI -0.26 -0.85 0.04 0.07 0.06 0.07
LL -0.24 -0.77 -0.03 -0.05 -0.06 -0.07
I -0.22 -0.73 -0.25 -0.41 0.00 0.00
DWAP -0.29 -0.96 0.05 0.08 0.01 0.02
HSW -0.06 -0.21 -0.29 -0.48 -0.63 -0.78
SPY -0.25 -0.82 0.32 0.52 -0.10 -0.13
YB -0.30 -0.97 0.11 0.19 -0.01 -0.01
NS -0.25 -0.82 0.16 0.26 0.32 0.40
HI 0.04 0.14 0.54 0.89 -0.21 -0.26
RPL 0.26 0.83 -0.13 -0.21 0.33 0.41
Multivariate statistical techniques, such as cluster analysis and PCA, which simultaneously analyse multiple measurements for each individual that is under investigation, are widely used in the analysis of genetic diversity; they are used irrespective the type of analysis (morphological, biochemical, or molecular marker-based), and they can subsequently be used in the classification of germplasm collections (MOHAMMADI; PRASANNA, 2003). Multivariate statistical techniques provide effective methods for grouping plant populations that facilitate the management of populations and their utilisation in crop-improvement programs (MOHAMMADI, 2006). Multivariate analyses have been used frequently for genetic diversity analysis in many crops, such as Arachis hypogaea L.
(UPADHYAYA et al., 2009) and Prunus persica L. Batsch (NIKOLICet al., 2010).
CONCLUSION
In conclusion, although it was not uniformly distributed across the regions, high genetic variability was revealed among the studied Ajowan populations. It has been suggested that the selection of parents that are used in hybridisation should be based on genetic diversity rather than geographic diversity. The evaluation of the agro-morphological traits of the Ajowan germplasm revealed a rich source of traits that can be used in its breeding programs.
ACKNOWLEDGEMENTS
The seeds of the populations that were used in the present study were kindly provided by the Research Institute of Forests and Range and the Pakan Seed Company (Iran). We would like to thank the Institute of Biotechnology, Urmia University, Iran, for financial support.
REFERENCES
AYANA, A.; BEKELE, E. Multivariate analysis of morphological variation in sorghum (Sorghum bicolor L. Moench) germplasm from Ethiopia and Eritrea, Genetic Resources and Crop Evolution, v. 46, n. 03, p. 273-284, 1999.
BREJDA, J. I.et al. Identi cation of regional soil quality factors and indicators. I. Central and Southern high plains.Soil Science Society of America Journal, v. 64, n. 06, p. 2115–2124, 2000. CAMUSSI, A. et al. Genetic distances based on quantitative traits.Genetics, v. 111, n. 04, p. 945-962, 1985.
COSGE, B.; IPEK, A.; GURBUZ, B. Some phenotypic selection criteria to improve seed yield and essential oil percentage of sweet fennel (Foeniculum vulgare Mill. var. dulce). Tarim Bilimleri Dergis, v. 15, n. 02, p. 127-133, 2009.
COWEN, N. M.; FREY, K. J. Relationships between three measures of genetic distance and breeding methods in oat (Avena sativa L.).Genome, v. 29, n. 01, p. 97-106, 1987.
CROSS, R. J. A proposed revision of the IBPGR barley descriptor list.Theoretical and Applied Genetics, v. 84, n. 03/04, p. 501-507, 1992.
DALKANI, M.; DARVISHZADEH, R.; HASSANI, A. Correlation and sequential path analysis in Ajowan (Carum copticum L.).Journal of Medicinal Plant Research, v. 05, n. 02, p. 211-216, 2011.
GREENE, S. L.; GRITSENKO, M.; VANDEWARK, G. Relating morphological and RAPD marker variation to collecting site environment in wild population of red clover (Trifolium pratense L.).Genetic Resources and Crop Evolution, v. 51, n. 06, p. 643-653, 2004.
GURBUZ, B. Correlation and path analysis among yield components in winter resistant coriander (Coriandrum sativum L.) lines.Indian Journal of Agricultural Sciences, v. 71, p. 730-732, 2001.
HAILU, F.et al. Multivariate analysis of diversity of tetraploid wheat germplasm from Ethiopia.Genetic Resources and Crop Evolution, v. 54, p. 83-97, 2006.
JEFFERS, J. N. R. Two case studies in the application of principal component analysis.Journal of Applied Statistics, v. 16, n. 03, p. 225-236, 1967.
JOBSON, J. D. Applied multivariate data analysis: volume II: Categorical and Multivariate Methods. New York: Springer-Verlag, USA, 1992.
KEARSEY, M. J.; POONI, H. S. The Genetical Analysis of Quantitative Traits. London: Chapman and Hall, 1996. LOTTI, C.et al. Univariate and multivariate analysis performed on bio-agronomical traits ofCucumis melo L. germplasm.Genetic Resources and Crop Evolution,v. 55, n. 04, p. 511-522, 2008. MAJNOON HOSSEINI, N.; DAVAZDAH EMAMI, S. A.
Cultivation and production of a certain medicinal plants and spices. Publications Tehran University, 2007. 300 p.
MOHAMMADI, S. A. Analysis of molecular data: Genetic diversity and population structure aspects (Key paper). In: IRANIAN CROP PRODUCTION AND BREEDING SCIENCE CONGRESS, 9., p. 96-119, 2006, Iran: Aboureyhan campus, University of Tehran, 2006,
MOHAMMADI, S. A.; PRASANNA, B. M. Analysis of genetic diversity in crop plants-salient statistical tools and considerations.
Crop Science, v. 43, n. 04, p. 1235-1248, 2003.
MURTHY, B. R.; ARUNACHALAM, V. The nature of genetic divergence in relation to breeding system in crop plantsIndian.
length polymorphisms. Journal of the American Society for Horticultural Science, v. 118, p. 298-303, 1993.
NIKOLIC, D. et al. Multivariate analysis of vineyard peach (Prunus persica L. Batsch.) germplasm collection.Euphytica, v. 171, n. 02, p. 227-234, 2010.
NTUNDU, W. H.et al. Morphological diversity of bambara groundnut [Vigna subterranea (L.) Verdc.] landraces in Tanzania.Genetic Resources and Crop Evolution,v. 53, n. 02, p. 367-378, 2006.
PANTHEE, D. et al. Diversity analysis of garlic (Allium sativum L.) germplasms available in Nepal based on morphological characters. Genetic Resources and Crop Evolution, v. 53, n. 01, p. 205-212, 2006.
PEETERS, J. P.; MARTINELLI, J. A. Hierarchical cluster analysis as a tool to manage variation in germplasm collections.Genetic Resources and Crop Evolution, v. 78, n. 0l, p. 42-48, 1989. SINGH, Y.; MITTAL, P. Correlation and path-coefficient analysis in fennel (Foeniculum vulgareMill).Crop Research, v. 25, n. 01, p. 111-115, 2003.
SMITH, S. E.; A1-DOS, A. L.; WARBURTON, M. Morphological and agronomic variation in North African and Arabian alfalfa.
Crop Science, v. 31, n. 05, p. 1159-1163, 1991.
STUBER, C. W. Heterosis in plant breeding.Plant Breed Rev, v. 12, p. 227-251, 1994.
SWAN, A. R. H.; SANDILANDS, M.Introduction to Geological Data Analysis. Blackwell Science: Oxford, 1995. 446 p. TRUXILLO, C.Multivariate Statistical Methods: Practical Research Applications Course Notes. Cary, N.C.: SAS Institute, USA, 2003.
UPADHYAYA, H. D. et al. Phenotypic diversity in cold-tolerant peanut (Arachis hypogaea L.) germplasm.Euphytica, v. 165, n. 02, p. 279-291, 2009.
WANDER, M. M.; BOLLERO, G. A. Soil quality assessment of tillage impacts in Illinois.Soil Science Society American Journal,v. 63, n. 04, p. 961-971, 1999.
WARD, J. H. Hierarchical Grouping to Optimize an Objective Function.Journal of the American Statistical Association. v. 58, p. 236-244, 1963.
WISHART, D. An Algorithm for Hierarchical Classi cations.
Biometrics, v. 25, p. 165-170, 1969.
YUZBASIOGLU, E.; ÖZCAN, S.; ACIK, L. Analysis of genetic relationships among Turkish cultivars and breeding lines of Lens culinatis Mestile using RAPD markers.Genetic Resources and Crop Evolution, v. 53, n. 03, p. 507-514, 2006.