QTL mapping to anthracnose leaf blight
resistance in tropical maize
Cristiane Romanek
1, Rodrigo Rodrigues Matiello
1*, Caroline
de Jesus Coelho
1, Lilian Schafascheck
1, Danilo Fernando
Guimarães Silva
1and José Raulindo Gardingo
1Abstract: The objectives were to map genomic regions associated with quan
-titative trait loci (QTL) to anthracnose leaf blight (ALB) in tropical maize, and to determine the effects of the loci on resistance to the pathogenic fungus Colletotrichum graminicola (Ces.). QTL analysis to ALB was carried out in a population of F2:3 progenies resulting from the cross between the contrasting
lines LR 04-2 and LS 95-1. Seventeen QTL were located by mapping analysis by
composite interval on eight chromosomes. Four QTL mapped on chromosomes 9 (1 QTL) and 10 (3 QTL) were the most stable, detected in at least two ex
-periments, and represented the most part of the phenotypic variation (27.7 to 54.3%) of resistance. The majority of QTL mapped were associated to specific severity evaluations/development stage of maize growth, and may explain the quantitative inheritance of resistance of tropical maize to ALB.
Key words: Disease resistance, Colletotrichum graminicola, composite interval mapping, Zea mays, AUDPC.
Crop Breeding and Applied Biotechnology 17: 390-398, 2017 Brazilian Society of Plant Breeding. Printed in Brazil
http://dx.doi.org/10.1590/1984-70332017v17n4a58 ARTICLE
*Corresponding author:
E-mail: rrmatiel@uepg.br
Received: 28 November 2016 Accepted: 25 May 2017
1 Universidade Estadual de Ponta Grossa,
84.030-900, Ponta Grossa, Brazil INTRODUCTION
Anthracnose leaf blight (ALB), caused by fungus Colletotrichum graminicola (Ces.) G. W. Wils., is present in all regions of maize cultivation, especially in hot and humid environments (Bergstrom and Nicholson 1999). The pathogen can infect different parts of the plant at several growth stages. Stalk rot and ALB are the most important forms of the disease (Badu-Apraku et al. 1987). The presence of ALB or stalk rot limits the high yield potential of susceptible genotypes (Matiello et al. 2013, Rezende et al. 2004). Smith (1976) reported reduction in grain yield caused by ALB ranging from 19 to 28% in maize hybrids and lines, respectively. On the other hand, higher reductions are estimated with stalk rot, which can amount 40% yield losses (Matiello et al. 2013).
QTL mapping to anthracnose leaf blight resistance in tropical maize
391
Crop Breeding and Applied Biotechnology -
17: 390-398, 2017
literature indicates that a few genes with additive and dominant gene action control resistance to ALB (Badu-Apraku et al. 1987). Rezende et al. (2004) reported a major gene as well as genes with minor additive and dominant controlling the resistance.
Studies aiming to know the nature and magnitude of the effects of resistance genes are important to guide the breeding procedures in order to introduce new resistance alleles in susceptible germplasm, and maximize the use of genetic variability in populations under selection (Pozar et al. 2009). Thus, determining the number, the nature of gene action, and the position of QTL in the maize consensus map can significantly contribute to the clarification of the genetic basis of resistance to ALB in tropical maize germplasm. In this sense, the objective of this study was to map and estimate the effects of resistance QTL to ALB in tropical maize germplasm in different environments and evaluation periodsduring the disease life cycle.
MATERIAL AND METHODS Plant material
Inbred lines of tropical maize, belonging to the C. graminicola resistance breeding program of State University of Ponta Grossa, originated from south of Brazil maize landraces, were initially screened for stalk rot and ALB (Prochno et al. 2016). The ALB contrasting inbred lines LR 04-2 (resistant) and LS 95-1 (susceptible) were crossed to obtain the segregating population of F2 generation. Individuals were selfed to generate the F2:3 progenies, which were evaluated for resistance to ALB in three field experiments.
Evaluation of maize resistance to anthracnose leaf blight
F2:3 maize progenies were evaluated in three experiments sown on 01/10/2012, 11/19/2013 and 01/17/2014, at the Farm School “Capão da Onça” (lat 25° 05’40” S, long 50° 03’ 13” W and alt 1017 m asl), Ponta Grossa, PR, Brazil. Treatments consisted of 121 F2:3 progenies plus the parents (LR 04-2 and LS 95-1) and F1 generation, which were used as experimental control. Experiments were carried out in a
randomized block design with three replications. The plot consisted of a 3 m row, spaced 0.90 m between rows, with approximately 15 plants per plot.
The isolated of C. graminicola was given by Dow AgroSciences Ltda. (Jardinópolis, São Paulo), as culture medium discs form with fungus colonies. The multiplication of pathogen was realized in oat-agar culture medium (10 g of oat flour, 2.5 g of agar and 250 mL of distilled water), being maintained at room temperature on the lab bench, until complete sporulation of colonies. For inoculum preparation, 20 mL sterile distilled water were added to Petri dishes containing the sporulated colonies, followed by surface scraping in order to release conidia. The suspension was adjusted to 6 x 10⁵ conidia mL-1 concentration with a Neubauer chamber. A drop of spreader Tween 80® was added to each liter of the conidial suspension. Plants were inoculated twice between the stages V6 and V7, by spraying 7 mL of the spore suspension in the plant whorl, using a knapsack sprayer calibrated at a constant pressure of 35 lbs pol-2, by compressed CO
2.
The evaluation of maize progenies regarding resistance to ALB was carried out from the appearance of the first disease symptoms, at the fifteenth day after the first inoculation. Three severity evaluations were carried out at
VT stage (tasseling), R2 stage (blister), and R3 stage (milk) (Ritchie and Hanway 1989). The characterization of resistance of maize progenies to ALB was carried out by the rating scale (% severity) proposed by Silva et al. (1986), ranging from 1 (highly resistant) to 6 (highly susceptible) (Figure 1). From the means of the scale grades of the three evaluations, was calculated the area under the disease progress curve (AUDPC). Afterwards, was carried out the frequency distribution analysis of maize progenies for AUDPC. The number of phenotypic classes (k) was estimated by the formulak = n , in
which n refers to the total progenies (n = 121). The phenotypic range class (PRC) was determined by PRC = R
k , in which
R is the range of the AUDPC found among the progenies. Phenotypic means of progenies for the 1st, 2nd, 3rd evaluations and for the AUDPC in the respective experiments were used for QTL mapping. To verify the distribution normality was applied Shapiro-Wilk test (SAS Institute 2015).
Molecular markers
Genomic DNA was extracted from leaves of individual plants of the F2 generation, of the inbred lines (LR 04-2 and L
S 95-1), and of the F1 generation (LR 04-2 x LS 95-1), following the protocol of Hoisington et al. (1994). Eighty-eight SSR loci, distributed in 10 maize chromosomes, were amplified in the parental inbred lines in order to select polymorphic loci. SSR loci were selected from the Maize Genetics and Genomics Data Base - MaizeGDB (http://www.maizegdb.org). Polymerase chain reaction (PCR) was prepared in 0.2 mL microcentrifuge tubes containing: 1X buffer InvitrogrenTM; 2.0
mM MgCl2; 0.1 mM dNTP solution (100 mM, Amresco®); 0.2 µM of each forward and reverse primer; 0.75 U TaqDNA polymerase (5 U/µL, InvitrogenTM); and 20 ng DNA template for a total volume of 20 µL. The amplified samples were
stained with 4 µL GelRed 0.1X plus loading buffer (1: 1), and separated by electrophoresis on 2% agarose gel. Of the 88 SSR loci, 29 were used to genotype the mapping population. The 121 individuals of the mapping population (F2) were genotyped for each polymorphic locus with codes. (1) Amplified fragment corresponding to the SSR allele from the resistant line (LR 04-2), (-1) amplified fragment corresponding to the SSR allele from the susceptible line (L
S 95-1) and (0) presence of the two fragments corresponding to the alleles of the parental lines LR 04-2 and LS 95-1.
The amplification methodology of the AFLP marker was performed according to Vos et al. (1995). Initially, it was tested 40 combinations of the primers EcoRI and MseI in order to select those with the best amplification pattern,
higher polymorphism between the parental lines and between the DNA bulks, according to the methodology of bulked segregant analysis (BSA) proposed by Michelmore et al. (1991). Of the 40 primer combinations, 19 were selected for genotyping the mapping population: E32-M48, E32-M49, E32-M50, E32-M51, E32-M52, E32-M53, E32-M59, E32-M60, E35-M50, E35-M56, E40-M50, E40-M51, E40-M51, E40-M60, E42-M50, E42-M51, E42-M60, E44- M51, E44-M56 [such as the primers sequence in Keygene (2004)]. Only the polymorphic combinations of each EcoRI + MseI combination
were genotyped in (1) presence and (0) absence.
Linkage analysis and composite interval mapping (CIM)
SSR and AFLP loci that presented expected Mendelian segregation (undistorted) by Chi-square at 5% were used for the construction of linkage map with the aid of the Mapmaker software version 3.0 (Lander et al. 1987). The linkage group construction was based on command “group” using a LOD of 3.0 (maximum likelihood method) and maximum recombination frequency of θ = 0.20. The recombination frequencies were converted on map distances by Haldane (1919)’s mapping function. After the linkage groups were defined, the markers inside each group were ordered by “order” command with LOD higher than 3.0. To ensure the correct marker order, the “ripple” command was used.
Analyses of the QTL mapping were carried out using the means of the disease severity grades of the three evaluations and of the AUDPC of the 121 F2:3 maize progenies in the three experiments. The location of the QTL was carried out through the analysis by the composite interval mapping (CIM), using the QTL Cartographer® software (Basten et al. 2003). Linkage map was used for the QTL positioning. The QTL position, genetic effect, and phenotypic variation (partial correlation, %) were established at the 3.0 LOD peak.
RESULTS AND DISCUSSION
Resistance of progenies to anthracnose leaf blight
QTL mapping to anthracnose leaf blight resistance in tropical maize
393
Crop Breeding and Applied Biotechnology -
17: 390-398, 2017
LR 04-2 and LS 95-1, regardless of the experimental year (Prochno et al. 2016). The frequency distribution for AUDPC presented a normal distribution by Shapiro-Wilk test at 5% of probability. Also was observed an asymmetric pattern, evidencing a trend of F2:3 progenies to greater resistance to ALB in the three experiments, with higher frequency between the 2nd and 4th classes of AUDPC. In the three experiments, highly resistant maize progenies were found, similarly to the source of resistance LR 04-2 (Figure 2).
Linkage map
Of the 413 polymorphic fragments (SSR and AFLP), only 54% with Mendelian segregation (undistorted) were used in the construction of the linkage map, avoiding errors in the position of marks on map and generate false positive associations (Liu 1998). The 11 SSR loci allowed co-locating AFLP fragments in the maize consensus map by the linkage analysis. Results allowed assigning chromosomic reference to the ten maize linkage clusters by the presence of at least one SSR locus per chromosome (Figure 3). The range of the length of the linkage clusters (107.5 to 244.3 cM) and the total length of the linkage map (1710.1 cM) are in agreement with other genetic maps of tropical maize (Mangolin et al. 2004). The linkage map of Castiglioni et al. (1999) demonstrated greater coverage of the genome, with 2057 cM, and with markers distributed every 6.6 cM. This result can be attributed to the greater number of individuals genotyped (229 families), enabling larger gametes sampling, and consequently greater probability in the detection of recombination events. The mean distance between the markers obtained in the present study was 11.4 cM, which shows good coverage of the genome analyzed in the segregating population (LR 04-2 x LS 95-1).
QTL mapping
The composite interval mapping (CIM) allowed the mapping of a large number of genomic regions (17 QTL) associated with resistance to ALB. In some intervals, coincident QTL were mapped for the different forms of disease quantification, as well as between the evaluation environments (Table 1). The absence of coincident QTL in the different evaluation environments characterizes the occurrence of QTL x environment interactions, since the mapped QTL at a given interval cannot be expressed in other evaluation environment. Higher accuracy of QTL effects by the CIM is expected for several evaluation environments, since the phenotypic values of progenies in these environments are simultaneously taken into consideration, enabling the quantification of the QTL x environment interactions (Jiang and Zeng 1995).
There are few published studies on QTL mapping to ALB in maize. On the other hand, there are several studies on stalk rot; however, they are not conclusive. The literature shows wide divergence in the number of genes that control resistance to stalk rot in maize. Carson and Hooker (1982) mapped genes or gene units on chromosomes 1, 4, 6 and 8 using the reciprocal translocation technique. However, Jung et al. (1994), by using the molecular marker RFLP, identified only one genomic region located on chromosome 4 with strong association to a QTL responsible for over 50% of the phenotypic variation in resistance to anthracnose.
In recent years, several studies have been carried out aimed at identifying genomic regions associated with pathogen
Cr
op Br
eeding and Applied Biot
echnology -
17: 390-398, 2017
omanek e
t al.
QTL
Number Chr Markers Interval/Position (cM) E1 E21 ExperimentE3 AUDPC E1 2E2 ExperimentE3 AUDPC E1 3E2 ExperimentE3 AUDPC
1 1 E32M48_308 E42M50_174 LOD 31.3 15.3
177.9 189.4 R2 (%) 90.6 89.7
a - 0.55 - 0.55
2 2 E35M56_680 E35M56_112 LOD 31.6
0.0 14.1 R2 (%) 94.1
a 0.52
3 3 E42M51_162 E42M50_76 LOD 18.4
0.0 7.6 R2 (%) 90.6
a 0.55
4 3 E32M48_167 E32M59_104 LOD 11.5
51.0 61.4 R2 (%) 75.0
a 0.49
5 4 E35M60_87 E32M60_185 LOD 10.8 10.7
0.0 10.4 R2 (%) 70.3 71.7
a 0.41 0.35
6 4 E32M52_73 E44M51_84 LOD 21.6
15.3 34.8 R2 (%) 90.6
a 0.07
7 4 Umc1511 E32M53_434 LOD 32.3
88.1 119.3 R2 (%) 90.6
a 0.55
8 4 E32M53_434 E44M51_135 LOD 24.8
119.3 137.7 R2 (%) 90.4
a 0.06
9 5 E32M48_532 E32M50_139 LOD 7.3
242.0 244.3 R2 (%) 61.8
a - 0.50
10 8 E35M60_80 E32M50_100 LOD 15.0 17.2 8.2
0.0 23.9 R2 (%) 72.6 74.8 67.5
a - 0.45 - 0.50 - 0.44
11 8 E32M60_94 E32M50_248 LOD 43.1 8.0 5.6 29.8 8.8 4.5 8.8
57.3 74.1 R2 (%) 94.0 72.5 52.2 90.6 69.1 23.4 50.9
a 0.52 0.46 15.79 0.55 0.46 1.60 22.64
12 8 E35M60_86 Phi015 LOD 36.5
85.5 107.5 R2 (%) 87.5
a - 0.49
13 9 E32M48_562 E32M48_97 LOD 2.8 2.9 6.2 3.9 2.8 6.1 7.7
126.4 157.7 R2 (%) 18.0 27.7 32.8 33.8 33.0 34.0 33.8
a - 0.90 - 19.90 - 0.92 - 20.68 - 0.91 - 1.35 - 26.79
14 9 E32M51_314 E35M56_174 LOD 5.8 6.24
179.1 201.1 R2 (%) 32.8 37.8
a 0.92 28.0
15 10 E32M49_698 E32M59_207 LOD 39.7 3.9 5.5 5.6 4.9 7.0 11.1
28.3 58.7 R2 (%) 94.1 30.8 39.4 41.5 34.9 41.4 50.8
a 0.52 0.85 19.0 19.7 0.85 1.45 23.18
16 10 E32M50_118 E44M56_81 LOD 2.6 3.9 3.7 3.6 9.8
85.4 109.1 R2 (%) 29.6 35.0 33.0 33.1 52.1
a - 0.86 - 20.2 - 20.61 - 0.89 - 24.01
17 10 E32M59_76 Umc1084 LOD 45.1 18.5 7.3 33.4 7.7 18.36 6.0 9.6
161.6 191.7 R2 (%) 94.1 90.0 48.3 90.6 49.1 89.7 35.3 54.3
QTL mapping to anthracnose leaf blight resistance in tropical maize
395
Crop Breeding and Applied Biotechnology -
17: 390-398, 2017
resistance alleles in agricultural species (Wisser et al. 2006). For McMullen and Simcox (1995), loci that determine disease resistance are not randomly distributed in the genome, but in the form of clusters. Often the same chromosomal segments have been associated with resistance to multiple pathogens in maize. For instance, on chromosome 3, in bins 3.04 and 3.05, QTL were mapped for resistance: to Puccinia sorghi, Cercospora zea-maydis, Cochliobolus heterostrophus,and Exserohilum turcicum (Wisser et al. 2006). This fact suggests that phytochemical compounds which stimulate resistance to different diseases can be produced by the same QTL, although it is possible the existence of QTL specific for a given pathosystem in maize (McMullen and Simcox 1995).
Prior knowledge on different QTL that have already been mapped in the 10 maize chromosomes/bin (chromosome splitting) enables establishing possible relations between the QTL to ALB mapped in this work. Thus, the QTL 1 of Chr 1 can be analyzed in relation to the position of the interval of the marker Bnlg1007, located in the bin 1.02 (Table 1 and Figure 3). The distance between the interval to the marker Bnlg1007 is between 109 cM and 120.5 cM, which is approximately six bins, since one bin corresponds to approximately 20 cM (McMullen and Simcox 1995). Thus, the QTL would be located near the bin 1.08, which is a region where QTL to stalk rot caused by Giberella zeae (Pé et al. 1993) and Cochliobolus heterostrophus (Balint-Kurti and Carson 2006) had already been mapped.
The position of the QTL mapped on chromosome 2 (QTL 2), can be related to the locus Bnlg125 (bin 2.02). The distance between the interval and the Bnlg125 is between 68.7 cM and 82.8 cM, corresponding to approximately four bins, and thus it is possible that this QTL is near the bin 2.06 (Table 1). In this region, QTL have been mapped for important foliar diseases, such as Exserohilum turcicum (Welz et al. 1999a) and Cercospora zeae-maydis (Lehmensiek et al. 2001). On Chr 3 two QTL (QTL 3 and 4) were mapped on 2nd evaluation at 2nd experiment explaining from 75 to 90.6% of phenotypic variation (Table 1).
Four QTL were mapped on Chr 4 (intervals E35M60_87 – E32M60_185, E32M52_73 – E44M51_84, Umc1511 – E32M53_434, and E32M53_434 – E44M51_135), which demonstrated specificity to severity evaluation or experiments (Table 1). To infer the approximate position of the QTL 6, was taken into account the position of this interval in relation to the locus Umc1511 (bin 4.05). The markers of this interval are at 72.8 and 53.3 cM, representing approximately three to four bins. According to these relations, this QTL may be located near the bin 4.01/4.02. In this chromosome, QTL to stalk rot caused by Giberella zeae was mapped in bin 4.01 (Pé et al. 1993), and by Colletotrichum graminicola next to bin 4.08 (Jung et al. 1994, Broglie et al. 2011), as well as to foliar lesions caused by Phaeosphaeria maydis (Moreira et al. 2009) and Cercospora zeae-maydis (Lehmensiek et al. 2001). In addition, the QTL 7 is possibly next to bins 4.05 or 4.06, which are genomic regions known for QTL to Cercospora leaf spot (Bubeck et al. 1993) and northern leaf blight in maize (Welz et al. 1999b).
The CIM analysis mapped a QTL on Chr 5 on markers interval E32M48_532 – E32M50_139, which explain 61.8% of phenotypic variance of resistance to ALB only on 2nd evaluation at 2nd experiment (Table 1). On Chr 8 were mapped three QTL. From these, the QTL 11 was the most stable, being mapped at the three experiments, responsible for the major part of resistance (23.4 to 94.0%) (Table 1 and Figure 3). This QTL is located at a distance of 33.4 cM to 50.2 cM for the Phi015 microsatellite locus (8.03), close to the bins 8.05/8.06. The region of Chr 8 that comprises these bins is known to be associated with QTL and resistance genes to various pathogens in maize. QTL in this region were mapped in different populations for resistance to Exserohilum turcicum (Welz et al. 1999a, b, Zwonitzer et al. 2010), Cochliobolus heterostrophus (Balint-Kurti et al. 2008), Cercospora zeae-maydis (Bubeck et al. 1993), Puccinia sorghi (Brown et al. 2001, Kerns et al. 1999), Ustilago maydis (Lüebberstedt et al. 1998), and to aflatoxin accumulation in maize ears caused by Aspergillus flavus (Paul et al. 2003).
From two QTL mapped on Chr 9, the QTL 13 was the most important for resistance in all study environments, presenting significant additive effect to reduce the disease severity (- 0.90 to -26.79). These QTL is located at a mean distance of 47.5 cM from the Phi065 marker (9.03) (Table 1 and Figure 3). Thus, this QTL would be located around the bins 9.05/9.06. In this bin, it was mapped QTL for Exserohilum turcicum (Brown et al. 2001), and in the regions 9.03/9.04, it was mapped QTL for Cochliobolus heterostrophus (Zwonitzer et al. 2010).
most stable, because was associated to resistance in 8 from 12 evaluations (considering the three experiments). Since there are no reports of other QTL in the region, possibly the resistance locus of bin 10.07 is specific to ALB in maize. Additionally, in this chromosome, it was detected other resistance loci, such as in bin 10.05/10.06 to common rust (Lüebberstedt et al. 1998), to Cercospora leaf spot (Bubeck et al. 1993), and to stalk rot caused by Giberella zea in 10.05 (Pè et al. 1993). Other QTL (16) was mapped on this chromosome, responsible from 29.6 to 52.1% of ALB resistance, highlighted with negative additive effect.
In order to use efficiently a scheme of selection assisted by molecular markers in a breeding program, it is necessary to have markers strongly associated with the QTL of interest, which is a pronounced effect on the phenotypic expression, and stable for the evaluation environments. In this study, it was mapped four stable QTL for the different evaluation
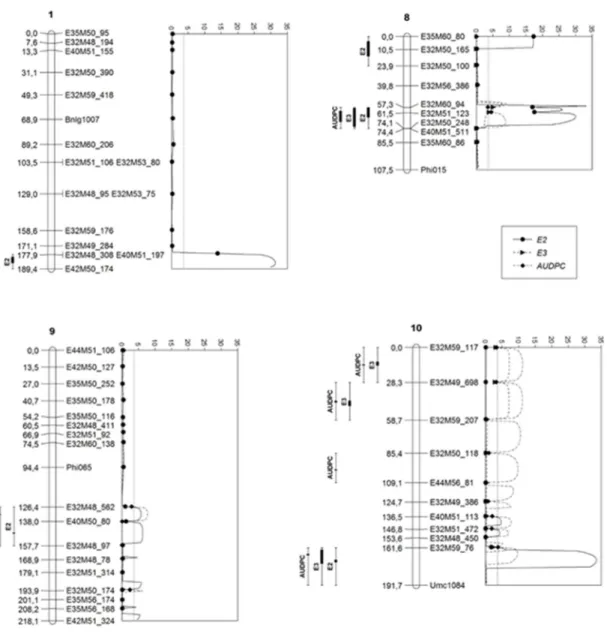
Figure 3. LOD profiles and 1-LOD and 2-LOD support intervals for E2 (2nd evaluation), E3 (3rd evaluation) and AUDPC (area under
QTL mapping to anthracnose leaf blight resistance in tropical maize
397
Crop Breeding and Applied Biotechnology -
17: 390-398, 2017
environments for AUDPC on Chr 9 and 10 (Table 1 and Figure 3). These QTL may be strong candidates for assisted selection schemes for resistance to ALB in tropical maize germplasm. Tropical maize populations have broad genetic basis compared with those of temperate climate zones. Besides, tropical areas are more likely to undergo environmental stress than temperate areas (Ribaut et al. 1997). Thus, QTL mapping in tropical genotypes enabled identifying new genomic regions and resistance alleles, which are possibly not yet known to the scientific community. In Brazil, this is the first report of quantitative inheritance to ALB resistance from tropical maize germplasm. Possibly the wide genetic base of this germplasm would explain the large number of QTL for resistance to ALB (Prochno et al. 2016).
Interactions of QTL x severity evaluations can be explained by climatic differences of the 1st and 3rd experiment in relation to the 2nd field experiment. High relative humidity / temperature conditions and higher concentration of inoculum of C. graminicola in the experimental areas of the 1st and 3rd experiments enabled the CIM analysis to the most same QTL to ALB resistance in both experiments. Although the AUDPC use is more efficient in relation to specific quantifications of the disease, its application in breeding programs is too restrictive by difficulty of performing several disease evaluations (at least three) in the field (Lopes et al. 2011). Thus, the identification of the ideal time for severity evaluation, which enables to adequately represent the reactions of different genotypes during the development of the epidemy could be the better strategy for selecting genotypes with high genetic resistance to ALB in this pathosystem. Our results demonstrated that the ALB evaluation from R2 (Blister) stage on second growing season at South of Brazil, enabled the better genetic resistance discrimination between individuals of segregating population (LR 04-2 x LS 95-1), being confirmed by similarity of results from QTL mapped for AUDPC in relation to observed for 2nd evaluation. Thus, to improve the efficiency on selection of ALB resistant genotypes by South of Brazil maize breeding programs we recommend at least one evaluation at R2 stage in segregating populations inoculated with C. graminicola.
ACKNOWLEDGEMENTS
Thanks are due to the Conselho Nacional de Desenvolvimento Científico e Tecnológico (CNPq) for the Research Productivity Grant to the corresponding author.
REFERENCES
Badu-Apraku B, Gracen VE and Bergstrom GC (1987) A major gene for
resistance to anthracnose leaf blight in maize. Plant Breeding 98:
194-199.
Balint-Kurti Balint-Kurti PJ, ZwonitzerJC, Pè ME, Pea G, Lee M and Cardinal
AJ (2008) Identification of quantitative trait loci for resistance to southern leaf blight and days to anthesis in two maize recombinant inbred line populations. Phytopathology 98: 315-320.
Balint-Kurti PJ and Carson ML (2006) Analysis of quantitative trait loci for
resistance to southern leaf blight in juvenile maize. Phytopathology 96: 221-225.
Basten CJ, Weir BS and Zeng BZ (2003) QTL cartographer: version 1.17.
North Carolina University, Raleigh, 187p.
Bergstrom GC and Nicholson RL (1999) The biology of corn anthracnose.
Plant Disease 83: 596-608.
Broglie KE, Butler KH, Butruille MG, Conceiçao AS, Frey TJ, Hawk JA, Jaqueth JS, Jones ES, Multani DS and Wolters PJCC (2011) Method for identifying maize plants with Rcg1 gene conferring resistance to Colletotrichum infection. US Patent 8062847 B2. Date 29/11/2011.
Brown AF, Juvik JA and JK Pataky (2001) Quantitative trait loci in sweet
corn associated with partial resistance to Stewart’s wilt, northern corn leaf blight, and common rust. Phytopathology 91: 293-300.
Bubeck DM, Yue YG, Xiang ZX, Stromberg EL and Rufener GK (1993) Quantitative trait loci controlling resistance to gray leaf spot in maize.
Crop Science 33: 838-847.
Carson ML and Hooker AL (1982) Reciprocal translocation testcross analysis of genes for anthracnose stalk rot resistance in a corn inbred
line. Phytopathology 72: 175-177.
Castiglioni P, Ajmone-Marsan P, van Wijk R and Motto M (1999) AFLP markers in a molecular linkage map of maize: codominant scoring and linkage group distribution. Theoretical and Applied Genetics 99: 425-431.
Coêlho RMS, Silva HP, Brunelli KR and Camargo LEA (2001) Controle genético da antracnose foliar em milho. Fitopatologia Brasileira 26: 640-643.
Haldane JBS (1919) The combination of linkage values, and calculation of distance between the loci of linked factors. Journal of Genetics 8: 299-309.
Hoisington D, Khairallah M and Leon DG (1994) Laboratory protocols:
CIMMYT applied molecular genetics laboratory. 3rd edn, CIMMYT,
Mexico, 102p.
Jiang C and Zeng Z (1995) Multiple trait analysis of genetics mapping for quantitative trait loci. Genetics 140: 1111-1127.
of anthracnose stalk rot genes in maize. Theoretical and Applied
Genetics 89: 413-418.
Kerns MR, Dudley JW and Rufener GK (1999) QTL for resistance to common rust and smut in maize. Maydica 44: 37-45.
Keygene NV (2004) Nomenclature of AFLP primer enzyme combinations.
Available at <http://wheatpwusdagov/ggpages/keygeneAFLPshtml>.
Accessed on Apr 3, 201.
Lander ES, Green P, Abrahamson J, Barlow A, Daly MJ, Lincoln SE and Newburg L (1987) Mapmaker: an interactive computer package for constructing primary genetic linkage maps of experimental and natural populations. Genomics 1: 174-181.
Lehmensiek A, Esterhuizen AM, van Staden D, Nelson SW and Retief AE (2001) Genetic mapping of gray leaf spot (GLS) resistance genes in
maize. Theoretical and Applied Genetics 103: 797-803.
Liu HB (1998) Statistical genomics, linkage, mapping and QTL analysis.
CRC, Boca Raton, 611p.
Lopes MTG, Vieira MLC, Lopes R, Brunelli K, Matiello RR, Silva HP and Camargo LEA (2011) Progeny evaluation for resistance to
Phaeosphaeria leaf spot in tropical maize. Canadian Journal of Plant
Pathology 33: 49-53.
Lüebberstedt T, Klein D and Melchinger AE (1998) Comparative QTL
mapping of resistance to Ustilago maydis across four populations
of European flint-maize. Theoretical and Applied Genetics 97: 1321-1330.
Mangolin CA, Souza Jr CL, Garcia AAF, Garcia AF, Sibov ST and Souza AP (2004) Mapping QTLs for kernel oil content in a tropical maize population. Euphytica 137: 251-259.
Matiello RR, Lopes MTG, Brunelli KR and Camargo LEA (2013) Comparison of yield damages of tropical maize hybrids caused by anthracnose stalk rot. Tropical Plant Pathology 38: 128-132.
McMullen MD and Simcox KD (1995) Genomic organization of disease and insect resistance genes in maize. Molecular Plant Microbe 8:
811-815.
Michelmore RW, Paran I and Kesseli RV (1991) Identification of markers linked to disease resistance genes by bulked segregant analysis: a rapid method to detect markers in specific genomic regions using segregating populations. Proceedings of the National Academy of
Science USA 88: 9828-9832.
Moreira JUV, Bento DAV, Souza AP and Souza Jr CL (2009) QTL mapping for reaction to Phaeosphaeria leaf spot in a tropical maize population.
Theoretical and Applied Genetics 119: 1361-1369.
Paul C, Naidoo G, Forbes A, Mikkilineni V, White D and Rocheford T (2003)
Quantitative trait loci for low aflatoxin production in two related maize populations. Theoretical and Applied Genetics 107: 263-270.
Pè ME, Gianfranceschi L, Taramino G, Tarchini R, Angelini P, Dani M and
Binelli G (1993) Mapping quantitative trait loci (QTL) for resistance to
Gibberella zeae infection in maize. Molecular Genetics 241: 11-16.
Pozar G, Butruille D, Silva HD, McCuddin ZP and Penna JC (2009) Mapping and validation of quantitative trait loci for resistance to Cercospora zeae-maydis infection in tropical maize (Zea mays L). Theoretical and
Applied Genetics 118: 553-564.
Prochno HC, Coelho CJ, Romanek C, Silva DFG, Tasior D, Oliveira EAT, Gardingo JR and Matiello RR (2016) Genetic resistance of maize
inbred lines to anthracnose leaf blight. Crop Breeding and Applied
Biotechnology 16: 55-61.
Rezende VF, Vencovsky R, Enrique F and Camargo LEA (2004) Mixed inheritance model for resistance to anthracnose leaf blight in maize.
Crop Breeding and Applied Biotechnology 4: 115-122.
Ribaut JM, Jiang C and Gonzalez DL (1997) Identification of quantitative
trait loci under drought condition in tropical maize 2 Yield components and marker-assisted selection strategies. Theoretical
and Applied Genetics 94: 887-896.
Ritchie S and Hanway JJ (1989) How a corn plant develops Iowa State
University of Science and Technology/Cooperative Extension
Service Available at <https://s10litemsuedu/res/msu/botonl/b_ online/library/maize/wwwagiastateedu/departments/agronomy/ corngrowshtml> Accessed on Jan 14, 2014.
SAS Institute (2015) SAS user’s guide: version 9.4. SAS Institute Inc., Cary, 234p.
Silva HP, Pereira AOP, Miranda Filho JB and Balmer E (1986) Inheritance
of resistance to foliar anthracnose (Colletotrichum graminicola) in corn. Fitopatologia Brasileira 3: 30-37.
Smith DR (1976) Yield reduction in dent corn caused by Colletotrichum graminicola. Plant Disease 60: 967-970.
Vos P, Hogers R, Bleeker M, Reijans M, van Lee T, Hornes M and Frijters A (1995) AFLP: a new technique for DNA fingerprinting. Nucleic Acids
Research 23: 4407-4414.
Welz HG, Schechert AW and Geiger HH (1999a) Dynamic gene action at QTLs for resistance to Setosphaeria turcica in maize. Theoretical and
Applied Genetics 98: 1036-1045.
Welz HG, Xia XC, Bassetti P, Melchinger AE and Lübberstedt T (1999b) QTLs for resistance to Setosphaeria turcica in an early maturing Dent x
Flint maize population. Theoretical and Applied Genetics 99: 649-65. Wisser RJ, Balint-Kurti PJ and Nelson RJ (2006) The genetic architecture
of disease resistance in maize: a synthesis of published studies.
Phytopathology 96: 120-129.
Zwonitzer JC, Coles ND, Krakowsky MD, Arellano C, Holland JB and