ISSN 1678-0345 (Print) ISSN 1679-9216 (Online)
Application of Molecular Markers on Genetic Improvement and
Reproduction in the Post-Genomic Era: Emerging Biotechnologies
and Perspectives in Livestock
José Fernando Garcia1 & Yuri Tani Utsunomiya1
ABSTRACT
Background: New challenges are rising in the animal protein market, and one of the main world challenges is to produce more in shorter time, with better quality and in a sustainable way. Brazil is the largest beef exporter in volume hence the factors affecting the beef meat chain are of major concern in country´s economy. An emerging class of biotechnological approaches, the molecular markers, is bringing new perspectives to face these challenges, particularly after the publication of the first complete livestock genome (bovine), which has triggered a massive initiative to put in practice the benefits of the so called the Post-Genomic Era.
Review: This article aimed at showing the directions and insights in the application of molecular markers on livestock genetic improvement and reproduction as well at organizing the progress so far, pointing some perspectives of these emerging technologies in Brazilian ruminant production context. An overview on the nature of the main molecular markers explored in ruminant production is provided, which describes the molecular bases and detection approaches available for microsatellites (STR) and single nucleotide polymorphisms (SNP). A topic is dedicated to review the history of association studies between markers and important trait variation in livestock, showing the timeline starting on quantitative trait loci (QTL) identification using STR markers and ending in high resolution SNP panels to proceed whole genome scans for phenotype/genotype association. Also the article organizes this information to reveal how QTL prospection using STR could open ground to the feasibility of marker-assisted selection and why this approach is quickly being replaced by studies involving the application of genome-wide association using SNP research in a new concept called genomic selection.
Conclusion: The world’s scientific community is dedicating effort and resources to apply SNP information in livestock selection through the development of high density panels for genomic association studies, connecting molecular genetic data with phenotypes of economic interest. Once generated, this information can be used to take decisions in genetic improvement programs by selecting animals with the assistance of molecular markers.
Keywords: beef cattle, livestock, molecular markers, SNP, marker-assisted selection, genomic selection.
I. INTRODUCTION: LIVESTOCK AND BIOTECHNOLOGY
II. NATURE OF MOLECULAR MARKERS
III. MOLECULAR MARKERS AS SUPPORTING TECHNOLOGY FOR RUMINANT
REPRODUCTION AND GENETIC IMPROVEMENT
QTL PROSPECTION
MARKER-ASSISTED SELECTION AND GENOMIC SELECTION
IV. CONCLUSIONS
I. INTRODUCTION: LIVESTOCK AND BIOTECHNOLOGY
Nutrition, genetic improvement and health/welfare form the triad that composes the animal production arena [18] (Figure 1). With the constant and exponential growth of human population, demand for products of animal origin becomes increasingly larger. The new world order is to produce more in shorter time, with better quality and in a sustainable way [21]. However, like any other activity, animal production has its limitations and new challenges arise constantly.
Brazil occupies a prominent position in international meat industry including sheep, goat and most notably cattle beef. The world population of cattle, sheep and goat were estimated in 2008 at 1.35, 1.08 and 0.86 billion heads respectively and for Brazil at 175.44, 16.50 and 9.50 million heads respectively [20].
Accord ing to data from the Brazilian Beef Exporter Industry Association - ABIEC [2], the beef industry represents the largest share of Brazilian agribusiness, generating more than U$ 28 billion per year and creating about 7.5 million jobs. In this context, Brazil is the largest meat exporter in volume, with approximately 1.24 million ton exported in 2009. According to FAO [20] some 13 million ton of small ruminant meat were produced in the world in 2008, of which 5 million are from goat and 8 million from sheep industry, having Australia and New Zealand as the main producers. Brazilian contribution is still very small in this scenario, with a production of 73,000 ton of sheep meat and 29,400 ton of goat meat in the same year, totalizing 108,700 ton.
Figure 1. Livestock triad (Health/Welfare, Genetic Improvement and Nutrition).
estrous cycle control by hormone treatments, superovulation, embryo transfer and in vitro embryo production are landmarks in the progress of animal breeding [3]. According to Garcia [24], sexing of embryos, differential gene expression studies, identification of quantitative trait loci and molecular markers, are integral parts of the portfolio of technologies currently available to boost genetic improvement in breeding programs. Among these technologies, the category that has recently become the most fashionable in the production of ruminants in the last two years deals with the so-called molecular markers [8,24,64,67], gaining renewed strength after the decoding of the first complete livestock genome (bovine) [62].
Given these considerations, this paper aims to outline the application of molecular markers in the production chain of ruminant meat, demonstrating practical examples on how this emerging technology can add feasible and efficient solutions to the production process in the current Brazilian context, especially in a post-genomic scenario.
II. NATURE OF MOLECULAR MARKERS
Genetic markers are heritable physical entities capable of differentiating unambiguously two or more individuals from each other. They are divided into: (1) morphological markers, which include visual identification of phenotypes and those that require measurement, (2) biochemical markers, polymorphic molecules of polypeptide nature, represented mainly by isoenzymes, (3) and DNA markers, nucleotide sequences at specific loci on chromosomes that exhibit polymorphism in a population [14]. Both DNA and biochemical markers are called molecular markers, but the later denomination is currently attributed to those directly derived from nucleic acids.
Vignal and co-authors [67] propose two classifications for the molecular markers of historical importance in animal production: one based on their biochemical nature, and other according to the nature of the alleles. In the first classification, the markers are divided into: (1) insertions and deletions (Indels), (2) single nucleotide polymorphism (SNP), and (3) non-coding variable number of tandem repeats (VNTR). In the second, they are grouped into: (1) biallelic dominant, (2) biallelic co-dominant, and (3) multiallelic co-dominant. Considering this in a practical way, there are only two types of markers exploited on a large scale in the production of ruminant today: VNTRs, best represented by microsatellites, and SNPs.
Microsatellites are short sequences from 1 to 7 nucleotides that are repeated in tandem, but limited to 100 repetitions [13]. For this reason, the microsatellites are also called Short Tandem Repeats, or STR [32]. These markers show high polymorphism (they are multiallelic), co-dominance, ease of detection by Polymerase Chain Reaction (PCR), Mendelian inheritance, ease of allelic determination and even distribution throughout the genome of most of eukaryotic organisms [50]. The applications of this type of marker in animal production are numerous, ranging from prospection of quantitative trait loci (QTL) to paternity tests [67].
Genotyping of STR is initially performed by the amplification of the query region by PCR, followed by the separation of resulting DNA fragments by electrophoresis. Produced DNA fragments of different sizes generate bands or peaks in electrophoresis according to the number of allele repeat units [43].
The other class of molecular marker of importance in ruminant production is the SNP. These are variations at specific locations in a genome, which are defined by only one nucleotide [7]. This difference of a single base needs to be found in more than 1% of the population to be considered a true SNP. Thus, SNP does not include polymorphisms by deletions or insertions. There are two categories of single nucleotide polymorphism: (1) transitions, which are the replacement of one nucleotide by other from the same group of nitrogenous base (purine-purine / pyrimidine-pyrimidine) and (2) transversions, which occur less frequently and are variations of purine-pyrimidine or pyrimidine-purine [7,8].
Amplified Fragment Length Polymorphism - AFLP [68] and Restriction Fragment Length Polymorphism - RFLP [19] have single nucleotide polymorphism in their molecular basis, and today are no longer considered markers per se, but rather methods of SNP prospection. These approaches have had historical importance, however these methods are laborious and limited, which is leading to the discontinuation of their use [8].
There are several SNP identification methodologies described in literature, such as primer extension, hybridization, ligation, enzymatic cleavage, mass spectrometry and signal detection based on fluorescence and chemiluminescence [41]. One of the most successful methods in SNP searching is the DNA sequencing of PCR products using the Sanger sequencing method, targeting a specific region of the genome and comparing the results with a reference animal sequence [8,54].
Efforts to identify SNP in domestic animals, especially in ruminants, have gained scene in recent years. Van Tassell and colleagues [66] contributed with the identification of approximately 23,000 SNPs in the bovine species, among animals of seven different beef breeds and individuals of different Holstein lines. The prospection of SNP markers has been facilitated after the release of the bovine genome, from a taurine Hereford female [62]. The project was the first devoted to livestock and allowed the generation of large SNP studies such as the Bovine HapMap Consortium, that has analyzed 37,470 SNPs in 497 animals of 19 breeds with different biology and geographical distribution, including taurine, indicine and their crosses [63].
Similar approach has been observed in the Sheep HapMap Consortium [38]. Although there is no reference genome of a real animal of this species, the project re-sequenced 2,644 loci previously known from a virtual genome. They have identified 6,021 SNPs, of which 1,536 were included in a panel for genotyping in 403 animals of 23 domestic breeds and 10 wildlife animals.
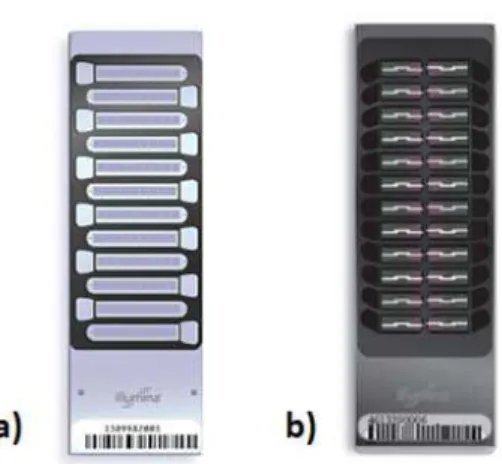
New approaches for SNP genotyping have achieved popularity in the current scenario. The latest technology generation makes use of microarrays based on oligonucleotides printed on glass slides, so called ‘SNP chips’, which evolved from classical Southern blotting technology. Each “chip” is composed of tens of thousands of microscopic spots containing trace amounts of specific DNA probes. The hybridization of a target sequence with the probe is detected and quantified by fluorescence or chemiluminescence. These technologies enable the analysis of tens of thousands of SNP in a single assay, reducing costs of data generation from $ 0.10 to $ 0.001 per genotyped SNP [8]. The company Illumina ® has developed in collaboration with USDA ARS, University of Missouri and University of Alberta, the BovineSNP50 BeadChip (Figure 2), a microarray containing about 54,000 SNPs evenly spaced throughout the bovine genome, selected from various sources of literature, with the possibility of genotyping up to 24 samples in parallel [36].
Figure 2. BovineSNP50 BeadChip, Illumina®. The pictures a) and b) represent the v1 (12 samples in parallel - 2008) and the v2 platforms (24 samples in parallel - 2010), respectively. Adapted from Illumina [36].
since the samples are handled only once and (3) reliability of data analysis, because of the high automation and high levels of redundancy (the same SNP locus can be genotyped more than 10 times in the same assay), leading to genotyping error scores lower than 0.01%. These features made feasible the generation of molecular data for the study of mapping in days instead of months or even years as in the case of STR.
After this summary on the main existent molecular markers at present and the approaches available for their detection, the following topics intend to demonstrate some of the applications of these emerging technologies in the production of ruminants, pointing out the perspectives of their use in genetic improvement and reproduction in the context of the Brazilian cattle meat chain.
III. MOLECULAR MARKERS AS SUPPORTING TECHNOLOGY FOR RUMINANT
REPRODUCTION AND GENETIC IMPROVEMENT
Qtl prospection
The traditional animal selection relies on the use of phenotypic, pedigree and progeny tests data to elect the best parents. However the identification of genes involved in the expression of phenotypes of economic interest has been the goal of modern selection [72].
The detection of genes related to characteristics of economic interest is not simple, since most of the targeted phenotypes have a quantitative character, with continuous and normal distribution, and are controlled by several genes, which suffer high environmental influence [26]. To explain the observed genetic variation in these characteristics, Fischer (1918) apud Hayes [23] proposed the “Infinitesimal Model”, in which the characteristics are determined by an infinite number of non-associated loci containing additive effect. However, in bovine species for instance, there are about 22,000 genes distributed in 30 pairs of chromosomes [62], configuring a finite number of genetic material. Thus, refining this idea, Hayes & Goddard [31] postulate that there are few genes that exert great influence in a quantitative trait, while there are several genes that bring small additive contribution to it.
Two strategies were designed and applied to identify the variation at molecular level controlling these characteristics: (1) the candidate gene approach and (2) QTL mapping. The first approach was relative successful in the exploration of variation in known genes, although in most cases the genes involved are unknown [28]. The second approach had better success, and is described next.
QTL mapping is based on the identification of chromosomal regions associated with economic important phenotypic variation [4]. Thus, neutral molecular markers (those located in non-coding regions), such as STR for instance, are used in association studies between allelic variants of theses markers and phenotypic variation, once the genes involved in the trait of interest are unknown [28].
For this type of analysis, it is necessary to use large herds, consisting of a well structured pedigree with a large progeny or half-sib families. To illustrate, we can consider the example of a bull with a large progeny, in which all animals are genotyped for a hypothetical STR marker locus. For this marker, the bull has the genotype A and B. The progeny may have been segregated then into two groups, one receiving the A allele and one that received the allele B. If there is a significant difference between the two groups in a given phenotype, this may be evidence that there is a QTL linked to this marker [28].
An important consideration is if the marker is or isn’t in Linkage Disequilibrium (LD) with the QTL. This idea refers to the distance between the marker and the true gene. The closer the marker is to the gene, the lower is the recombination rate between them, because when there is an occurrence of crossing over it is likely that both loci are transferred in a single block. Hence the allelic and genotypic frequencies are not in Hardy-Weinberg equilibrium. In other words, there is a non-random association between marker locus and gene [28]. Linkage maps, genomic charts that organize STR markers or known genes and locate them on the chromosomes by calculation of recombination rate, have been developed for various domestic species, including cattle [5,47,40,35], sheep [11] and goat [65], aiming at turning researches with QTL mapping easier.
From the 90s of the last century, with the development of various linkage maps, several research groups worldwide initiated studies aiming at identifying QTL in ruminants. These studies contributed to elucidate the genetic mechanisms involved in the manifestation of the phenotype of interest, especially for traits difficult or expensive to be measured, such as those that control the reproductive performance [42], meat quality and carcass composition [9]. Several QTL were detected in livestock, particularly in cattle. Polineni and colleagues [52] published a database with data mined from the bovine QTL literature and provided it in a friendly genomic context, approaching loci associated with genetic diseases, growth rate, resistance to parasites and reproduction. Other authors dedicated the meta-analysis approach in order to create dense single chromosomes QTL linkage maps, constructed from literature review and corrected for problems of identification and location of markers [70,72].
Large amount of QTL of interest in meat production were identified along the cattle chromosomes, for example, on chromosome 4 [49], 5 [1], 6 [26,49,60], 7 [60], 9 [37,60], 10, 20 and 21 [60] and 14 [26,39,49,75].
As QTL mapping approach localizes a chromosomic region containing a gene that affects a quantitative trait (via STR marker), it brings the possibility of identifying this gene, which makes it feasible to prospect functional polymorphisms (SNPs), returning to the candidate gene approach in a direct way. Hansen [27] has reviewed the main identified genes related to carcass quality in cattle, which encode the proteins: (1) myostatin, (2) calpain, (3) calpastatin and (4) leptin.
Along with the polymorphisms related to phenotypes of direct economic interest, other types of genomic association are also important in the production of meat, like markers linked to health and reproduction aspects. In this scenario, the identification of QTL has been explored with great interest for: (1) host resistance to parasitic diseases [12,15,25] and (2) tolerance to environmental changes, such as water and food scarcity and heat [30,51]. Although the scientific community has devoted their work to the exploration of STR linked to QTL intensively for just over a decade, the identification of increasing numbers of single nucleotide polymorphisms in livestock species of interest brought new directions to the genomic association studies.
With the addition of SNP markers in genomic association studies, it was possible to put into practice a new idea: the Genome-wide association study or Genome-wide scan, which seeks correlations between genotypes and phenotypes by applying densely arranged SNP panels distributed throughout the genome, with markers spaced at orders less than 10 cM [33]. These studies are interesting due to the fact they cover the whole genome with small intervals among markers, QTL detection is simplified by the ease of SNP genotyping and by ensuring that all genes are in LD with at least one marker of the panel [29].
The next topic will address the strategies of organization of the genomic association information for usage in breeding programs.
Marker-assisted selection and genomic selection
Selection is the primary tool on improvement of domestic animals, which consists of choosing individuals that will be used as parents. This practice aims at increasing the favorable gene frequency in the offspring, resulting in change in the average phenotype of the next generation [46].
Marker-Assisted Selection (MAS) consists in genotyping known trait-associated markers and combining this information with phenotypic measurements [28]. The classical markers selected for this type of approach were STR, and the data used to support this analysis was mined from literature about their association with QTLs [61]. Therefore, MAS is an indirect process because selection occurs by means of molecular markers linked to genes of interest, and not through the gene itself. Figure 3 provides an illustration of the information evolution leading to the feasibility of MAS.
The selection method employed in MAS is the Best Linear Unbiased Prediction (BLUP), matrix linear mixed model in which the prediction of multiple genetic values (random effects) is performed, adjusting the data concurrently for the fixed effects (environment) and unequal number of subclasses [34].
Figure 3. Flowchart of molecular markers development for use in MAS. Adapted from Collard & Mackill [10].
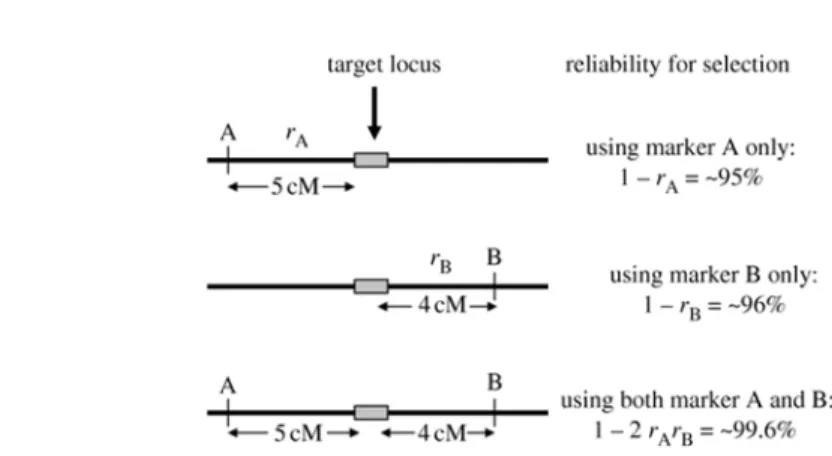
Figure 4. Selection reliability using one and/or two flanking markers. The symbol r represents the rate of recombination between the marker and the target locus. When used together, markers A and B add more reliability to the selection (~ 99.6%) than when used separated Adapted from Tanksley (1983) apud Collard & Mackill [10].
MAS brings the perspective of reducing drastically livestock management costs through early identification of animals with production potential just by sampling a biological specimen and genotyping its DNA shortly after birth, decreasing drastically the time to wait to assess their genetic value, today only when the animal reaches the productive age [17]. However, despite the theoretical improvements of this system, Webb [69] reports that MAS has high costs, phenotypic losses related to non-analyzed characteristics and inconsistency of the effects of markers on phenotypic expression, arguing that selection methods with morphological markers have already proven their efficiency (EPD estimation), while MAS in this format is doubtful.
Due to the use of STR information associated to QTL available restricted to those existing in scientific literature, MAS employs sparse genetic map data with markers spaced in orders of up to 2 Mb. Thus, the prediction of genetic value is compromised by the possibility of incorporating markers distant from QTL and in LE, comprising only a portion of the additive genetic variance [49], which reduces the efficiency of selection and compromises the full application of this technology [59].
Despite the expectation of greater efficiency in MAS when compared to purely phenotypic selection, Whittaker and co-authors [74] show through a simulation study that the additional genetic gain offered by MAS in the context described above decreases rapidly after successive cycles of selection, making it even less efficient than phenotypic selection in the long term.
More recently, several projects dedicated to the identification of SNP in cattle brought a new opportunity to incorporate the technology of molecular markers into animal selection efficiently: the Genomic Selection (GS) approach. This model, proposed by Meuwissen and collaborators [48], uses dense maps of markers (on the order of 1 cM) covering the entire genome, ensuring that all genes are in LD with at least one marker.
Meuwissen and co-authors [48] compared three methods to estimate the effect of all genes simultaneously: BLUP, Bayesian estimation and least squares method. They show that the highest correlation between the estimated and true genetic value occurred in Bayesian estimation (rTBV;EBV = 0.848). However, despite BLUP having lesser correlation (rTBV;EBV = 0.723), Blasco [6] argues that the Bayesian estimation has several difficulties related to computer analysis, indicating that BLUP still presents the most convenient analysis to GS.
The first reports of GS efficiency in a practical situation were published by USDA researchers in 2008, using dairy cattle as example [55]. The work explored a five years retrospective database with real EPD values from sires used in artificial insemination program. The genomic prediction was performed and GEPD and phenotypic evaluation of the progeny can be found on Table 1. These results show a clear indication of the superiority of genomic prediction when compared with pedigree information alone, although progeny test has superior accuracy when compared with the former. This indicates that replacement of progeny test is not possible, but it also points out that GPED associated with progeny tests can be a powerful tool to increase selection efficiency.
Table 1. USDA estimated accuracies for published genetic evaluations by traits. Adapted from Sattler [55].
Trait Pedigree Information Only Genomic Prediction
Progeny Test
Milk 35% 53% 77%
Productive Life 26% 35% 58%
Somatic Cell Score 31% 45% 76%
Daughter Pregancy Rate 27% 35% 56%
Udder Depth 21% 48% 82%
Net Merit 16% 34% 62%
Another interesting data from the same study can be seen in Table 2, in which genomic prediction was performed in four bull calves considered genetically equal by pedigree information. In this case, animal 4 could be selected as the best calve to enter the genetic improvement program.
Table 2. USDA genomic prediction results for a group of four bull calves. PA = Parent Average, GenPA = Genomic Prediction Average, SCS = Somatic Cell Score, PL = Productive Life, DPR = Daughter Pregnancy Rate, NM$ = Net Merit. Adapted from Sattler [55].
PA Milk PA Protein PA SCS PA PL PA DPR PA Type PA NM$
1,187 42 2.74 4.5 0.1 3.50 599
Calf GenPA GenPA GenPA GenPA GenPA GenPA GenPA
Milk Protein SCS PL DPR Type NM$
1 766 23 2.70 2.3 -0.2 3.30 370
2 1,265 35 2.79 4.4 -0.3 4.20 526
3 1,521 49 3.07 2.1 -0.5 3.60 507
4 1,241 52 2.68 4.9 0.7 3.40 682
IV. CONCLUSIONS
Livestock production closes the first decade of the new millennium facing tough challenges. The evolution of molecular markers knowledge in the last two decades brought new perspectives for ruminant production. The identification, characterization and application of markers developed from time consuming, laborious and costly processes to quick, easy and cheap procedures. It is possible to notice a world trend to apply SNP markers, especially after the conclusion of the bovine genome project with several big transnational pharmaceutical companies starting in this market. The way to go now is the composition of high density panels for searching new genomic associations that could make Genomic Selection feasible not only in dairy but in beef cattle as well as in other ruminant species (sheep, goat and water buffalo).
Brazil has a primary role in the global meat market, especially for being the largest beef exporter in volume. However, it is observed that commercial initiatives applying molecular markers in cattle have been taken mainly by US and European based companies (such as Pfizer, Merial and Intervet-Schering Plough), which naturally tends to use taurine information since this is the major cattle biotype in North America and Europe. This involves capturing technologies and/or information that do not always fit to the local situation, leading to reduced efficiency on its application. Thus, it is expected from the Brazilian scientific community to work in the development of scientific research and innovation projects on molecular markers mainly for indicine type cattle and other important species. Although still discrete, actions are already noticeable, and the trend seems to be the extension of a network of researchers concerned with the issue.
It is expected that in the next years molecular markers firm definitely its contribution to beef livestock production in Brazil and become no longer faced as a theme for the future, or an emerging biotechnology, but rather an approach as fluent as the phenotypic selection or artificial insemination that have changed the livestock sector in the country in the past 30 years.
REFERENCES
1 Abe T., Saburi J., Hasebe H., Nakagawa T., Kawamura T., Saito K., Nade T., Misumi S., Okumura T., Kuchida K., Hayashi T., Nakane S., Mitsuhasi T., Nirasawa K., Sugimoto Y. & Kobayashi E. 2008. Bovine quantitative trait loci analysis for growth, carcass, and meat quality traits in an F2 population from a cross between Japanese Black and Limousin. Journal of Animal Science. 86: 2821-2832.
2 ABIEC – Associação Brasileira das Indústrias Exportadoras de Carne. 2010. Estatísticas de exportação de carne bovina por ano. Available In: <http://www.abiec.com.br/41_exportacao_ano.asp>. Accessed on 05/2010.
3 Basrur P.K. & King W.A. 2005. Genetic then and now: breeding the best and biotechnology. Revue scientifique et technique. 24(1): 31-49.
4 Biase F.H., Garnero A.D.V., Bezerra L.A.F., Rosa A.J.M., Lobo R.B. & Martelli L. 2005. Analysis of restriction fragment length polymorphism in the kappa-casein gene related to weight expected progeny difference in Nellore cattle. Genetics and Molecular Biology. 28: 84-87.
5 Bishop M.D., Kappes S.M., Keele J.W., Stone R.T., Sunden S.L., Hawkins G.A., Toldo S.S., Fries R., Grosz M.D., Yoo J. & Beattie C.W. 1994. A genetic linkage map for cattle. Genetics. 136: 619-39.
6 Blasco A. 2001. The Bayesian controversy in animal breeding. Journal of Animal Science. 79: 2023-2046.
7 Brookes A.J. 1999. The essence of SNPs. Gene. 234: 177-186.
8 Caetano A.R. 2009. Marcadores SNP: Conceitos básicos, aplicações no manejo e no melhoramento animal e perspectivas para o futuro. Revista Brasileira de Zootecnia. 38: 64-71.
9 Casas E., Keele J.W., Shackelford S.D., Koohmaraie M. & Stone R.T. 2004. Identification of quantitative trait loci for growth and carcass composition in cattle. Animal Genetics. 35: 2–6.
10 Collard B.C.Y. & Mackill D.J. 2007. Marker assisted selection: an approach for precision plant breeding in the twenty-first century. Philosophical Transactions of the Royal Society B. 363: 557-572.
11 Crawford A.M., Dodds K.G., Ede A.J., Pierson C.A., Montgomery G.W., Garmomway H.G., Beattie A.E., Davies K., Maddox J.F., Kappes S.W., Stone R.T., Nguyen T.C., Penty J.M., Lord E.A., Broom J.E., Buitkamp J., Schwaiger W., Epplen J.T., Matthew P., Matthew M.E., Hulme D.J., Beh K.J., McGraw R.A. & Beattie C.W. 1995. An autosomal genetic linkage map of the sheep genome. Genetics. 140(2): 703-724.
12 Crawford A.M., Paterson K.A., Dodds K.G., Diez Tascon C., Williamson P.A., Roberts Thomson M., Bisset S.A., Beattie A.E., Greer G.J., Green R.S., Wheeler R., Shaw R.J., Knowler K. & McEwan J.C. 2006. Discovery of quantitative trait loci for resistance to parasitic nematode infection in sheep: I. Analysis of outcross pedigrees. BMC Genomics. 7(178): 1-10.
14 Dantas A.C.M. & Nodari R.O. 2002. Marcadores genéticos. Universidade Federal de Santa Catarina: Centro de Ciências Agrárias. 21p. [Source: <http://www.lfdgv.ufsc.br/MARCADORESMOLECULARES2.pdf >].
15 Davies G., Stear M.J., Benothman M., Abuagob O., Kerr A., Mitchell S., Bishop S.C. 2006. Quantitative trait loci associated with parasitic infection in Scottish blackface sheep. Heredity. 96(3): 252-258.
16 Dekkers J.C.M. 2004. Commercial application of marker- and gene-assisted selection in livestock: Strategies and lessons. Journal of Dairy Science. 82: 313-328.
17 Dodgson J.B., Cheng H. H. & Okimoto R. 1997. DNA marker technology: A revolution in animal genetics. Poultry Science. 76: 1108-1114.
18 Domingues P.F. 2008. Sanidade Animal no Brasil e o Desenvolvimento da Agropecuária. Revista Internacional em Língua Portuguesa. 21: 93-105.
19 Donis-Keller H., Green P. & Helms C. 1987. A genetic linkage map of the human genome. Cell. 51(2): 319-337.
20 FAO- Food and Agriculture Organization of the United Nations. FAO Statistics Division: FAOSTAT. 2009. Available in: <http:// faostat.fao.org/>. Accessed on 05/2010.
21 FAO- Food and Agriculture Organization of the United Nations. 2010. The state of food and agriculture 2009: livestock in the balance. FAO/Eletronic Publishing Policy and Support Branch. 166p. [Source: <http://www.fao.org/docrep/012/i0680e/ i0680e00.htm>].
22 Fernando R.L. & Grossman M. 1989. Marker assisted selection using best linear unbiased prediction. Genetic Selection Evolution. 21(4): 467-477.
23 Fischer R.A. 1918. The correlation between relatives: the supposition of mendelain inheritance. Transactions of the royal society of Edinburgh. 59: 399. apud 28 Hayes B.J. 2007. QTL mapping, MAS, and genomic selection. Ames, Iowa State University. Available in: <http://www.ans.iastate.edu/section/abg/shortcourse/ notes.pdf>. Accessed on 05/2010.
24 Garcia J.F. 2007. Geração de conhecimento científico e desenvolvimento biotecnológico pelo emprego de métodos analíticos derivados do metabolismo dos ácidos nucléicos. Dissertação (Livre-docência) – Universidade Estadual Paulista ‘Júlio de Mesquita Filho’ (UNESP), Campus de Araçatuba.
25 Gutiérrez-Gil B., Pérez J., Alvarez L., Martínez-Valladares M., de la Fuente L.F., Bayón Y., Meana A., San Primitivo F., Rojo-Vázquez F.A. & Arranz J.J. 2009. Quantitative trait loci for resistance to trichostrongylid infection in Spanish Churra sheep. Genetic Selection Evolution. 41(46): 10p.
26 Gutiérrez-Gil B.; Wiener P., Nute G.R., Burton D., Gill J.L., Wood J.D. & Williams J.L. 2008. Detection of quantitative trait loci for meat quality traits in cattle. Animal Genetics. 39: 51-61.
27 Hansen G.R. 2004. Genetic selection using genetic markers. Beef Cattle Short Course. Available in: <http://animal.ufl.edu/extension/ beef/shortcourse/2004/ GHansen.pdf>. Accessed on 05/2010.
28 Hayes B.J. 2007. QTL mapping, MAS, and genomic selection. Ames, Iowa State University. Available in: <http://www.ans.iastate.edu/ section/abg/shortcourse/ notes.pdf>. Accessed on 05/2010.
29 Hayes B.J., Bowman P.J., Chamberlain A.J. & Goddard M.E. 2009. Invited review: Genomic selection in dairy cattle: progress and challenges. Journal of Dairy Science. 92(2): 433-443.
30 Hayes B.J., Bowman P.J., Chamberlain A.J., Savin K., Van Tassell C.P., Sonstegard T.S. & Goddard M.E. 2009. A validated genome wide association study to breed cattle adapted to an environment altered by climate change. PLOS ONE. 4(8): 8p.
31 Hayes B.J. & Goddard M.E. 2001. The distribution of the effects of genes affecting quantitative traits in livestock. Genetics Selection Evolution. 33(3): 209-229.
32 Heaton M.P., Harhay G.P., Bennett G.L., Stone R.T., Grosse W.M., Casas E., Keele J.W., Smith T.P.L., Chitko-Mackown C.G. & Laegreid W.W. 2002. Selection and use of SNP markers for animal identification and paternity analysis in U.S. beef cattle. Mammalian Genome. 13: 272-281.
33 Hiekkalinna T. & Talikota S. 2005. Genome-wide scan with SNPs. Research Seminars on Data Analysis for Bioinformatics Seminar 2005. Available in: <http://www.cs.helsinki.fi/u/ skaski/bioinf_semin05/notes_lect07.pdf>. Accessed on 05/2010.
34 Henderson C.R. 1984. Aplications of linear models in animal breeding. Guelph: University of Guelph, 462p. apud 28 Hayes B.J. 2007. QTL mapping, MAS, and genomic selection. Ames, Iowa State University. Available in: <http://www.ans.iastate.edu/section/abg/ shortcourse/ notes.pdf>. Accessed on 05/2010.
35 Ihara N., Takasuga A., Mizoshita K., Takeda H., Sugimoto M., Mizoguchi Y., Hirano T., Itoh T., Watanabe T., Reed K.M., Snelling W.M., Kappes S.M., Beattie C.W., Bennett G.L. & Sugimoto Y. 2004. Comprehensive Genetic Map of the Cattle Genome Based on 3802 Microsatellites. Genome Research. 14: 1987–1998.
36 Illumina. 2010. BovineSNP50 genotyping BeadChip. Illumina, Inc., 370-2007-029: 1-4. 2010. Available in: <http://www.illumina.com/ Documents/products/datasheets/ datasheet_bovine_snp5O.pdf>. Accessed on 05/2010.
37 Imai K., Matsughige T., Watanabe T., Sugimoto Y. & Ihara N. 2007. Mapping of quantitative trait locus for beef marbling on bovine chromosome 9 in purebred Japanese black cattle. Animal Biotechnology. 18: 75-80.
38 International Sheep Genomics Consortium. 2009. A genome wide survey of SNP variation reveals the genetic structure of sheep breeds. PLOS ONE. 4(3): 13p.
40 Kappes S.M., Keele J.W., Stone R.T., Mcgraw R.A., Sonstegard T.S., Smith T.P., Lopez-Corrales N.L. & Beattie C.W. 1997. A second-generation linkage map of the bovine genome. Genome Research. 7: 235-249.
41 Kim S. & Misra A. 2007. SNP genotyping: Technologies and biomedical applications. Annual Review of Biomedical Engineering. 9: 289-320.
42 Kirkpatrick B.W., Byla B.M. & Gregory K.E. 2000. Mapping quantitative trait loci for bovine ovulation rate. Mammalian Genome. 11: 136-139.
43 Koreth J., O’Leary J.J. & McGee, J.O’D. 1996. Microsatellites and PCR genomic analysis. Journal of Pathology. 178: 239-248.
44 Li W.H. & Sadler L.A. 1991. Low nucleotide diversity in man. Genetics. 129(2): 513-523.
45 Lopes P.S., Torres R.A. & Pires A.V. 2005. Genética quantitativa. In: Lopes P.S. Teoria do melhoramento animal. Belo Horizonte: FEPMVZ-Editora, 118p.
46 Lopes P.S., Torres R.A. & Pires A.V. 2005. Seleção. In: Lopes P.S. Teoria do melhoramento animal. Belo Horizonte: FEPMVZ-Editora, 118p.
47 Ma R.Z., Beever J.E., Da Y., Green C.A., Russ I., Park C., Heyen D.W., Everts R.E., Fisher S.R., Overton K.M., Teale A.J., Kemp S.J., Hines H.C., Guérin G. & Lewin H.A. 1996. A male linkage map of the cattle (Bos taurus) genome. Journal of Heredity. 87(4): 261-271.
48 Meuwissen T.H.E., Hayes B.J. & Goddard M.E. 2001. Prediction of total genetic value using genome-wide dense marker maps. Genetics. 157(4): 1819-1829.
49 Mizoguchi Y., Watanabe T., Fujinaka K., Iwamoto E. & Sugimoto Y. 2006. Mapping of quantitative trait loci for carcass traits in a Japanese Black (Wagyu) cattle population. Animal Genetics. 37: 51-54.
50 Okada A. & Tamate H.B. 2000. Pedigree analysis of the Sika Deer (Cervus nippon) using microsatellite markers. Zoological Science. 17: 335-340.
51 Olson T.A., Lucena C., Chase C.C. Jr. & Hammond A.C. 2003. Evidence of a major gene influencing hair length and heat tolerance in Bos taurus cattle. Journal of Animal Science. 81: 80-90.
52 Polineni P., Aragonda P., Xavier S.R., Furuta R. & Adelson D.L. 2006. The bovine QTL viewer: a web accessible database of bovine Quantitative Trait Loci. BMC Bioinformatics. 7: 7p.
53 Rumph J.M. 2005. Expected progeny differences. In: National Beef Cattle Evaluation Consortium. 2005. Beef sire selection manual. [Source: <http://www.nbcec.org/>].
54 Sanger F., Nicklen S. & Coulson A.R. 1977. DNA sequencing with chain-terminating inhibitors. Proceedings of the National Academy of Sciences. 74(12): 5463-5467.
55 Sattler C. 2008. Genomic prediction: turning DNA testing into a powerful selection tool. Select Sires. [Source: <http://www.selectsires.com/ dairy/genomics_prediction.aspx>]
56 Scalco A.R. & Machado J.G.C.F. 2009. Cenário atual da gestão da qualidade na cadeia produtiva da carne bovina: estudo de caso. Informações Econômicas. 39(8): 66-80.
57 Seaton G., Haley C.S., Knott S.A., Kearsey M. & Vissecher P.M. 2002. QTL Express: mapping quantitative loci in simple and complex pedigrees. Bioinformatics. 18(2): 339-340.
58 da Silva M. V. G. Uso da seleção genômica do melhoramento genético de bonivos. In: Anais do II Simpósio de Biologia Molecular Aplicada à Produção Animal. São Carlos: Embrapa Pecuária Sudeste. p. 35-48.
59 Smith C. & Simpson S.P. 1986. The use of genetic polymorphisms in livestock improvement. Journal of Animal Breeding Genetics. 103: 205-217 apud Fernando R.L.; Grossman M. 1989. Marker assisted selection using best linear unbiased prediction. Genetic Selection Evolution. 21(4): 467-477.
60 Takasuga A., Watanabe T., Mizoguchi Y., Hirano T., Ihara N., Takano A., Yokouchi K., Fujikawa A., Chiba K., Kobayashi N., Tatsuda K., Oe T., Furukawa-Kuroiwa M., Nishimura-Abe A., Fujita T., Inoue K., Mizoshita K., Ogino A. & Sugimoto Y. 2007.
Identification of bovine QTL for growth and carcass traits in Japanese Black cattle by replication and identical-by-descent mapping. Mammalian Genome. 18: 125-136.
61 Thaler Neto A. 2000. Situação atual e perspectivas da utilização da genética molecular no melhoramento de bovinos leiteiros. In: Anais do III Simpósio Nacional de Melhoramento Animal. Belo Horizonte: FEPMVZ. p.293-294.
62 The Bovine Genome Sequencing and Analysis Consortium, Elsik C.G., Tellam R.L. & Worley K.C. 2009. The genome sequence of taurine cattle: a window to ruminant biology and evolution. Science. 324: 522-528.
63 The Bovine HapMap Consortium. 2009. Genome-Wide survey of SNP variation uncovers the genetic structure of cattle breeds. Science. 324: 528-532.
64 Van Eenennaam A. 2005. DNA-Based technologies. In: National Beef Cattle Evaluation Consortium. Beef sire selection manual. [Source: <http://www.nbcec.org/>].
65 Vaiman D., Schibler L., Bourgeois F., Oustry A., Amigues Y. & Cribiu E.P. 1996. A genetic linkage map of the male goat genome. Genetics. 144(1): 279-305.
www.ufrgs.br/favet/revista
Supl 1
67 Vignal A., Milan D., San Cristobal M.E. & Eggen A. 2002. A review on SNP and other types of molecular markers and their use in animal genetics. Genetics Selection Evolution. 34: 275-305.
68 Vos P., Hogers R., Bleeker M., Reijans M., Van de Lee T., Hornes M., Frijers A., Pot J., Peleman J., Kuiper M. & Zabeau M. 1995.
AFLP: A new technique for DNA fingerprinting. Nucleic Acids Research. 23(21): 4407-4414.
69 Webb J. 2000. New opportunities for genetic change in pigs. Advances in pork production. 11: 83-93
70 Weikard R., Goldammer T., Womack J.E. & Kuehn C. 2007. Forward to a detailed sequence map of bovine chromosome 6. Cytogenetic Genome Research. 116: 72-79.
71 Welsh J. & McCleland, M. 1990. Fingerprinting genomes using PCR with arbitrary primers. Nucleic Acids Research. 18(24): 7213-7218.
72 Wibowo T.A., Gaskins C.T., Newberry R.C., Thorgaard G.H., Michal J.J. & Jiang Z. 2008. Genome assembly anchored QTL map of bovine chromosome 14. International Journal of Biological Sciences. 4: 406-414.
73 Williams J.C.G., Kubelik A.R., Livak K.J., Rafalski J.A. & Tingey S.V. 1990. DNA polymorphisms amplified by arbitrary primers are useful as genetic markers. Nucleic Acids Research. 18(22): 6531-6535.
74 Whittaker J.C., Curnow R.N., Haley C.S. & Thompson R. 1995. Using marker-maps in marker-assisted selection. Genetic Research. 66: 255-265.
75 Wu X.L., Macneil M.D., De S., Xiao Q.J., Michal J.J., Gaskins C.T., Reeves J.J., Busboom J.R., Wright Jr. R.W. & Jiang Z. 2005.

![Figure 3. Flowchart of molecular markers development for use in MAS. Adapted from Collard & Mackill [10].](https://thumb-eu.123doks.com/thumbv2/123dok_br/15760154.128214/10.892.242.581.339.770/figure-flowchart-molecular-markers-development-adapted-collard-mackill.webp)
![Table 1. USDA estimated accuracies for published genetic evaluations by traits. Adapted from Sattler [55].](https://thumb-eu.123doks.com/thumbv2/123dok_br/15760154.128214/12.892.86.813.422.625/table-estimated-accuracies-published-genetic-evaluations-adapted-sattler.webp)
