A significant longshore transport divergence zone at the
Northeastern Brazilian coast: implications on
coastal Quaternary evolution
ABÍLIO C.S.P. BITTENCOURT1, LOUIS MARTIN2, JOSÉ M.L. DOMINGUEZ1, IRACEMA R. SILVA3 and DAIANA L. SOUSA4
1Laboratório de Estudos Costeiros, CPGG, Instituto de Geociências/UFBA, 40210-340 Salvador, BA, Brasil 2CNPq/IRD (ORSTOM), International Convention, Project AIMPACT, 40210-340 Salvador, BA, Brasil 3Curso de Pós-Graduação em Geologia/Instituto de Geociências/UFBA, 40210-340 Salvador, BA, Brasil 4Curso de Graduação em Geologia/ Instituto de Geociências/UFBA, 40210-340 Salvador, BA, Brasil
Manuscript received on May 29, 2001; accepted for publication on February 26, 2002; contributed byLouis Martin*
ABSTRACT
By using the mean directions of the wave-fronts approaching the Brazilian northeastern coastal stretch comprised between the localities of Real river (Sergipe State) and Galinhos (Rio Grande do Norte State) – coincident with those of the main winds occurring in the area – and their periods, we have defined a wave climate model based on the construction of refraction diagrams. The resulting model of sediment transport, as obtained by numerical modelling from the refraction diagrams, taking into consideration the angle of approach and waves heights along the 10-m isobath, was capable of reproducing the patterns of sediment dispersion provided by geomorphic indicators of the longshore drift. All this coastal region, approximately 900 km in length, is characterized by a significant divergence zone in the direction of net longshore drift of sediments, the potential intensity of which increases considerably in value, in almost its entire length, continuously toward downdrift, which might explain the greater or lesser long term susceptibility to erosion, during the Quaternary, along the coastal stretch studied.
Key words:littoral drift, wave refraction, numerical modelling, coastal Quaternary evolution, Northeastern Brazilian coast.
INTRODUCTION
The Brazilian coastal stretch located between Real river and Galinhos, extends approximately 900 km (Fig. 1), and may be divided into three sectors with very distinct physiographic features (Dominguez 1995, Dominguez and Bittencourt 1996, Martin et al. 1998):
Sector I – From Real river to Coruripe point –
Char-Correspondence to: Abilio C.S.P. Bittencourt E-mail: abilio@cpgg.ufba.br
*Foreign Member of Academia Brasileira de Ciências
acterized by the existence of wide terraces with well-developed beach-ridges, from Holocene to Pleis-tocene ages, reaching some kilometers in width.
Sector II – From Coruripe point to Guaju – Charac-terized by weakly developed beach-ridge terraces. In this sector, the Holocene terraces have width av-eraging hundreds of meters, rarely reaching more than 1 km. The Pleistocene terraces are preserved only in the reentrances of the shoreline.
beach-ridge terraces are virtually absent. Extensive dune fields of Pleistocene (fixed by vegetation) and Holocene (still active) characterize this sector. The entire coastal stretch is almost continu-ously bordered by tablelands 10 to 40 km in width and 10 to 100 m in height. Fossil sea cliffs in these tablelands mark the contact between the hinterland and the Quaternary plains. These tablelands are made up of poorly consolidated continental sedi-ments of Miocene-Pliocene age (Barreiras Group – Mabesoone et al. 1972, Bigarella 1975). At several stretches within Sector II and, mainly in Sector III, the coastline exhibits active sea cliffs carved in these tablelands.
Dominguez (1995), Dominguez and Bitten-court (1996) and Martin et al. (1998), based on the knowledge of the Quaternary coastal evolution of the region, have qualitatively evaluated the suscep-tibility to erosion of this coastal stretch. They have shown that the present coastal erosion phenomenon is not related to a possible sea level rise in response to an overall increase in the earth’s temperature. In-stead, it is intrinsically related to the sediment bud-get in the coastal zone. As regards to the sediment budget, these authors have shown that these coastal sectors exhibit, since the Pleistocene, the following long term trends:
Sector I – tendency of progradation of the coastline, characterized by a positive sediment budget. Sector II – tendency of equilibrium or incipi-ent progradation, characterized by a null or slightly positive sediment budget.
Sector III – tendency of equilibrium or erosional retreat, characterized by a null or slightly negative sediment budget.
As the studied coastal stretch is entirely located with-in the trade wwith-inds belt, the waves generated by these winds, of extremely constant velocity and direction, exerts a strong influence on the coastal processes (Dominguez et al. 1992). Martin et al. (1998), based on a detailed analysis of the atmospheric cir-culation system, presented a conceptual model for
the wave regime affecting the study area. From this model they concluded that (Fig. 1): a) from the boundary between Alagoas and Pernambuco states to the south limit of the area there is a net north to south longshore drift; b) from the boundary between Alagoas and Pernambuco states to Touros there is a net south to north longshore drift; c) from Touros to the extreme west of the area there is a net east to west longshore drift. There should be mentioned that such directions had already been previously conjec-tured by Silvester (1968) based on his study of the net longshore drift directions of sediment along the world’s coastal regions. Martin et al. (1998) call at-tention to the fact that the divergence in the direction of the net longshore drift of sediments should make this coastal stretch very susceptible to erosion.
The continental shelf of the coastal stretch (Fig. 1) is relatively flat, presenting small irregularities, mainly in Sector I. In general, it has a greater width in front of Sector II, and is narrow in Sectors I and III, except at the northern portion of Sector III, where it becomes wider. The average height of the tides in this region increases gradually, from 1.8 m at Ara-caju to 3.0 m at Macau, a village located at 53 km west of Galinhos (Fig. 1) (DHN 1999). The tides are semidiurnal.
The aim of the present work is to evaluate the role of the longshore drift of sediments on the coastal quaternary evolution, based on the construction of a Wave Climate Model for the study area.
WAVE CLIMATE MODEL
20
20 40
80
80
40
Natal
Real River
Guaju Galinhos
Touros
Pirambu
Japaratinga
São Francisco River
Coruripe Point
Vaza-Barris River Aracaju
SECTOR III
SECTOR II
SECTOR I
11°00'
37°00' 35°00'W
7°00'
9°00' 5°00'S
Bathymetric contours in meters.
40º 36º
8º
16º
40
ATLAN T
IC
O
C E
A
N
SE
AL
PE
PB
RN
0 50 100 km
Fig. 1 – Physiographic features of the continental shelf of the Brazilian northeast region between Galinhos and Real river. Also shown the location of the different sectors discussed in the text. The following states are depicted in the figure: SE – Sergipe, AL – Alagoas, PE – Pernambuco, PB – Paraíba and RN – Rio Grande do Norte.
by the Brazilian Navy, at an approximate scale of 1:300,000. The waves were not propagated in wa-ters depths less than 10 m, that is the limit for
nau-tical charts. The following wave-front directions were considered for the refraction diagrams: NE
7°00'
9°00'
0 50 100 km
0 50 100 km
5°00'S 5°00'S
11°00' 11°00'
37°00' 35°00'W
bo
b b
b b
b bo bobo
bo
b
b
b bo
bo
bo
b
b
b
bo
bo bo
33º
50º 62º 59º 57º X
XI XII XIII
VI VII VIII IX
I II
III IV
V
22º 26º 21º
48º 62º 76º 81º
A B C D
28º
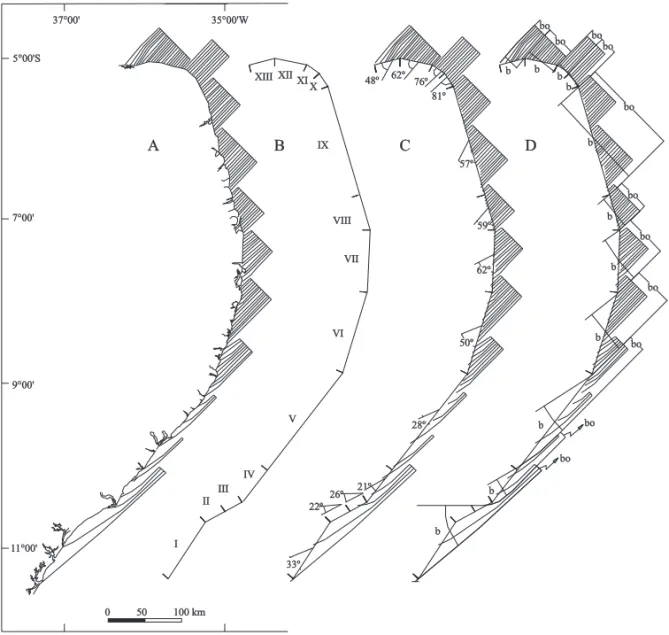
Fig. 2 – A – Refraction diagram for waves with a 5 sec period, arising from the NE(N45◦). B – Different segments in which the coastline has been rectilinearized. C – Incidence angles formed by waves from NE in relation to the rectilinearized coastal segments. D – Measurements of b and bofor estimating the height of waves along the rectilinearized coastal segments.
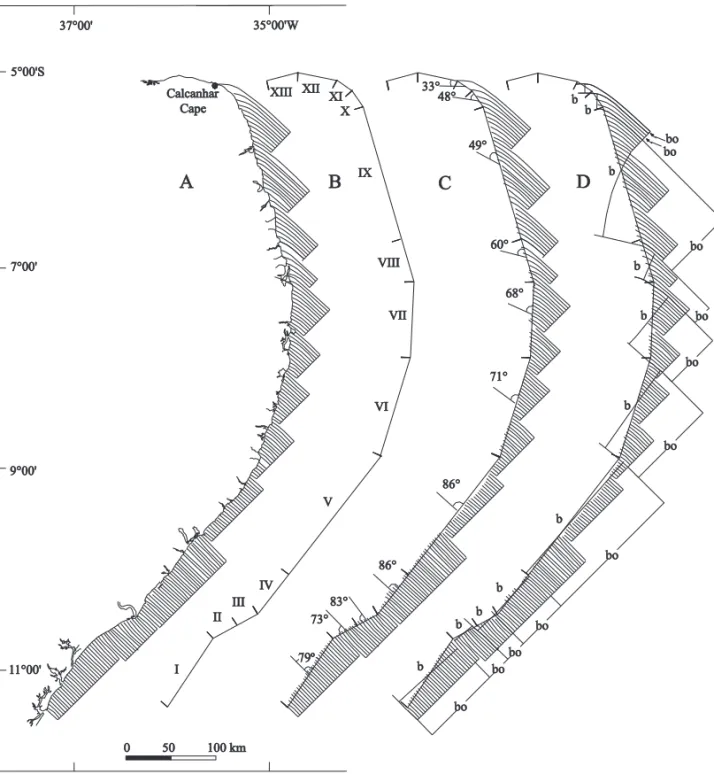
directions correspond to the main wind directions occurring along the studied coastal region (DHN 1993). We also considered the most significant peri-ods and wave heights associated to these directions (US Navy 1978): period of 5 sec, and height of 1.0 m for the NE and E directions, and period of 6.5 sec and height of 1.5 m for the SE and S directions.
In general, it is observed that the NE (Fig. 2), E (Fig. 3) and SE (Fig. 4) wave-fronts practically reach the entire studied coastal stretch. The excep-tion is a small part in the north area, at west of Cal-canhar Cape, in relation to the SE (Fig. 4) waves.
Calcanhar Cape
61º 43º
61º 55º
72º 78º 53º
32º 3º
VI VII VIII
I II
III IV
V IX X XII XIII
A
B
C
D
A
B
C
D
bo
São Francisco São Francisco
River
XI
bo
bo b
b b
b bo
bo
bo b
b
bo b
b bo
bo
bo bo
bo b
b b
b
87º 74º 68º
62º 7°00'
9°00'
0 50 100 km 0 50 100 km 5°00'S
11°00'
Fig. 3 – A – Refraction diagram for waves with a 5 sec period, arising from the E(N90◦). B – Different segments in which the
coastline has been rectilinearized. C – Incidence angles formed by waves from E in relation to the rectilinearized coastal segments. D – Measurements of b and bofor estimating the height of waves along the rectilinearized coastal segments.
POTENTIAL INTENSITY AND DIRECTION OF THE NET LONGSHORE DRIFT
The potential intensity of the longshore drift of sed-iments was determined taking into account that: a) the wave energy is directly proportional to the square of its height (Davies 1972) and b) the intensity of the longshore drift is proportional to the angle with
7°00'
9°00'
0 50 100 km
0 50 100 km
5°00'S
11°00'
37°00' 35°00'W
X XI XII XIII
VI VII VIII IX
I II
III IV
V Calcanhar
Cape
79º 79º
bo b
b
b bo
bo
bo
bo
bo
bo
bo bo
bo
A
B
C
D
73°
68°
71°
83° 86°
86° 60° 49° 48° 33°
b b
b b
b
b b
b
bo
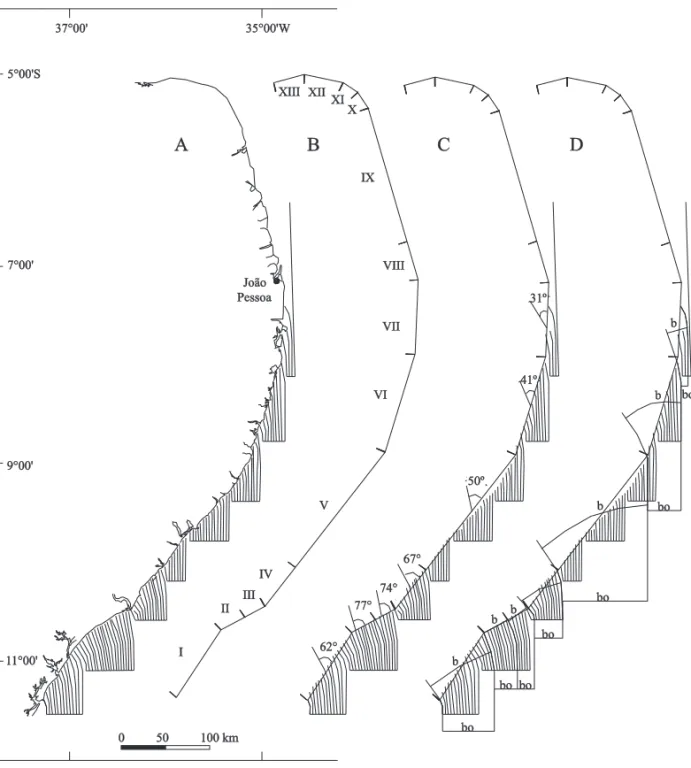
Fig. 4 – A – Refraction diagram for waves with a 6.5 sec period, arising from the SE(N135◦). B – Different segments in which the
coastline has been rectilinearized. C – Incidence angles formed by waves from SE in relation to the rectilinearized coastal segments. D – Measurements of b and bofor estimating the height of waves along the rectilinearized coastal segments.
height along the 10 m isobath. The wave height was estimated using the equation H=H0(b/bo)1/2 (Bas-com 1954), where the subscript zero designates deep water conditions, and b is the distance between two orthogonals to the wave-fronts. The studied coast-line has been divided into 13 segments. Each of these segments has been approximated by a straight
lim-50º 41º
31º João
Pessoa
I II
III IV
V VI
VII VIII IX X XI XII XIII
7°00' 7°00'
9°00' 9°00'
0 50 100 km
0 50 100 km
5°00'S 5°00'S
11°00'
A
B
C
D
74° 77°
62°
bo bo bo
bo bo 67°
b b
b
bo
bo
b b
b
Fig. 5 – A – Refraction diagram for waves with a 6.5 sec period, arising from the S(N180◦). B – Different segments in which the
coastline has been rectilinearized. C – Incidence angles formed by waves from S in relation to the rectilinearized coastal segments. D – Measurements of b and bofor estimating the height of waves along the rectilinearized coastal segments.
its of the beam of orthogonals incidental upon each segment, or, rarely, when this was not possible, en-compassing contiguous segments (for example, seg-ments I, II and III, Fig. 2). Thus, an average value of the wave height was obtained for the considered coastal stretch. The angleαbetween each segment and a given wave-front was that prevailing between the wave-rays incidental upon the segment, as
mea-sured directly in the refraction diagram (Figs. 2 to 5). Subsequently, the value obtained for the intensity of the drift was multiplied by the percentage of the an-nual frequency of the wind direction (DHN 1993) to which the considered wave-front is associated.
with the direction and potential intensity of the net longshore drift. In the coastal stretches presenting seasonally opposite drift directions, the net long-shore drift direction has been defined taking into account the predominant direction, given by the dif-ference of intensities between opposite longshore drifts. For example, in segment I, the sum of the in-tensities of the north to south drifts was 1912, while the value obtained for the sum of the drift intensities in the opposite direction was 1605 (Table I). Thus, the net longshore drift direction obtained was north to south with a potential intensity in the value of 307 (Table I).
Figure 6 shows that the studied coastal region is characterized by presenting a significant diver-gence in the direction of the net sediments long-shore drift, the nodal point of which is located in the neighborhood of Japaratinga, quite near the location foreseen by Martin et al. (1998). The geomorphic indicators along the coastline, as observed on var-ious published maps and aerial photographs (e.g., direction of migration of sand spits) (Bittencourt et al. 1983, Barbosa et al. 1986a,b, Dominguez et al. 1990, MMA/UFRJ/FUJB/LAGET 1996) indicate a general pattern of sediment dispersion that are es-sentially similar to those computed in the present work. As for the potential intensity of the net long-shore drift, one observes that it, from the nodal point, presents the following behavior. To the north, during almost the entirety of the coastal stretch, it increases continuously, from a value of 2052 (Segment VI) up to 4360 (Segment X), passing next to decrease, also continuously, up to a value of 794 (Segment XIII) (Fig. 6). To the south, the potential of the net long-shore drift also increases continuously, from a value of 724 (Segment V) up to 3556 (Segment II), and next abruptly decrease to 307 (Segment I) (Fig. 6).
DISCUSSION AND CONCLUSIONS
The patterns of sediment dispersion defined in the present work confirms the conceptual model of Mar-tin et al. (1998), identifying a remarkable diver-gence in the direction of the net longshore drift, with
the nodal point near the locality of Japaratinga (Fig. 6). Such pattern is confirmed by the geomorphical indicators of the longshore drift. Most significant in it is the fact that the potential intensity of the net sediments longshore drift increases considerably in a continuous manner both northwards and south-wards, from Japaratinga. This fact implies an in-creasing sediment deficit in the downdrift direction, a situation that can explain, as will be discussed be-low, the characterization made by Dominguez and Bittencourt (1996) and Martin et al. (1998) in re-lation to the susceptibility to erosion of the studied coastal stretch.
Potential intensity of the net longshore drift for each rectilinearized coastal segment (see Figure 6)
Segment Origin of the Wave height along Angle of incidence Main longshore wave front the coastline (H)* (α) drift component
N45◦ 0.4 33◦ N–S
I N90◦ 1.0 61◦ N–S
N135◦ 1.5 79◦ S–N
N180◦ 1.3 62◦ S–N
N45◦ 0.4 22◦ N–S
II N90◦ 0.9 43◦ N–S
N135◦ 1.5 73◦ N–S
N180◦ 1.4 77◦ S–N
N45◦ 0.4 26◦ N–S
III N90◦ 1.0 62◦ N–S
N135◦ 1.5 83◦ N–S
N180◦ 1.3 74◦ S–N
N45◦ 0.6 21◦ N–S
IV N90◦ 1.0 61◦ N–S
N135◦ 1.5 86◦ S–N
N180◦ 1.2 67◦ S–N
N45◦ 0.8 28◦ N–S
V N90◦ 1.0 55◦ N–S
N135◦ 1.5 86◦ S–N
N180◦ 1.3 50◦ S–N
N45◦ 1.0 50◦ N–S
VI N90◦ 1.0 72◦ N–S
N135◦ 1.5 71◦ S–N
N180◦ 1.2 41◦ S–N
N45◦ 1.0 62◦ N–S
VII N90◦ 1.0 87◦ N–S
N135◦ 1.4 68◦ S–N
N180◦ 0.9 34◦ S–N
N45◦ 1.0 59◦ N–S
VIII N90◦ 1.0 78◦ S–N
N135◦ 1.3 60◦ S–N
N180◦ NI – –
N45◦ 1.0 57◦ N–S
IX N90◦ 1.0 74◦ S–N
N135◦ 1.2 49◦ S–N
N180◦ NI – –
N45◦ 1.0 81◦ N–S
X N90◦ 1.0 68◦ S–N
N135◦ 1.2 48◦ S–N
N180◦ NI – –
N45◦ 1.0 76◦ S–N
XI N90◦ 1.0 53◦ S–N
N135◦ 0.8 33◦ S–N
N180◦ NI – –
XII N45◦ 1.0 62◦ E–W
N90◦ 0.8 32◦ E–W
XIII N45◦ 0.9 48◦ E–W
TABLE I ( continuation )
Segment Intensity of the longshore Percentage of the Drift intensity multiplied Intensity of the drift per unit of area annual incidence by the percentage of the dominant drift minus X=senα·cosα·H2×(100) of the waves annual incidence the secondary drift
(net longshore drift)
7 18 126
I 38 47 1786 N → S
42 30 1260 307
69 5 345
5 18 90
II 38 47 1786 N → S
63 30 1890 3556
42 5 210
6 18 108
III 41 47 1927 N → S
26 30 780 2590
45 5 225
13 18 234
IV 42 47 1974 N → S
15 30 450 1493
53 5 265
23 5 115
V 46 42 1932 N → S
15 45 675 724
81 8 648
44 5 220
VI 29 42 1218 S → N
66 45 2970 2052
65 8 520
37 5 185
VII 5 42 210 S → N
72 45 3240 3117
34 8 272
42 5 210
VIII 20 42 840 S → N
68 45 3060 3690
– 8 –
45 5 225
IX 26 42 1092 S → N
75 45 3375 4242
– – –
16 5 80
X 35 42 1470 S → N
66 45 2970 4360
– – –
23 5 115
XI 47 42 1974 S → N
29 45 1305 3394
– – –
XII 41 13 533 E → W
27 87 2349 2882
XIII 41 13 533 E → W
3 87 261 794
0 50 100 km São Francisco
Galinhos
Touros
Japaratinga
Pirambu River
7°00'
9°00' 5°00'S
11°00' 2882
794
3394
4360
4242
3690
3117
2052
724
1493
2590
3556
307
SECTOR III
SECTOR II
SECTOR I
III III
IV
V
VI VII VIII IX X XI XII XIII
Fig. 6 – Directions of the net longshore drift computed in the present work for each rectilinearized segment. The numbers at the arrow side are the potential intensity of the net longshore drift (See Table I).
be related to the circumstance that both are coastal stretches from where the sediments are being con-tinuously removed by the action of the longshore drift, without a significant contributions of the rivers
po-Barreiras Group
Pleistocene beach-ridges terraces
Holocene beach-ridges terraces
Wetlands
10 km
Vaza Barris River
Real River
N
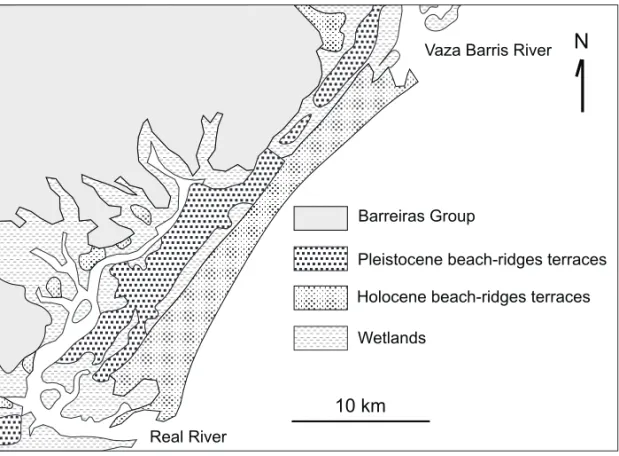
Fig. 7 – Simplified geological map of the coastal plain between Real and Vaza-Barris rivers illus-trating the persistence of the sediment dispersion and accumulation patterns during the Quaternary Period (After Dominguez et al. 1992).
tentially in the downdrift direction in almost all its extension and always with values much higher than in Sector II (Fig. 6). Such behavior is observed from its south limit as far as the locality of Touros, where the intensity of the net longshore drift starts to decrease towards as far as Galinhos (Fig. 6). In Sector II, the intensity of the net longshore drift in-creases near their north and south extremes (Fig. 6). These facts can explain the existence of many more coastal stretches presenting active sea-cliffs in the Barreiras Group in Sector III than in Sector II. An-other factor contributing to the fact that beach-ridge terraces are virtually absent in Sector III, is the de-velopment of large fields of dunes along this coastal stretch (Dominguez and Bittencourt 1996, Martin et al. 1998), fed by the beach face sediments. As for the long term tendency to erosional retreat or equi-librium in the coastal stretch between Touros and Galinhos, despite the intensity of the net longshore drift be decreasing considerably (Fig. 6), one should
tides and winds, have prevented the accumulation of sediments during the Quaternary between Touros and Galinhos.
Because of the remarkable stability observed in the high pressure cell of the South Atlantic, trade winds generated in this cell are expected to show a remarkable persistence during the Quaternary (Dominguez et al. 1992). Consequently, these au-thors conclude to be logical to expect that the pat-terns of sediment dispersion along the coastal stretch analyzed herein have maintained themselves also persistent during the Quaternary. In this sense, using the paleogeographic reconstructions obtained in dif-ferent coastal plains along the Brazilian East-North-east coast, Dominguez et al. (1992) have shown that, in general, such patterns remained the same since the Pleistocene. In relation to the studied coastal stretch a significant example may be observed in the coastal plain of beach-ridges terraces between the Real and Vaza-Barris rivers, in Sector I (Figs. 1 and 7). In this region, there may be clearly seen that the geom-etry of the Pleistocene beach-ridge terraces display a remarkable correspondence with those of Holocene beach-ridges terraces and with the present coastline. As considered by Dominguez et al. (1992), although other regions of the world present evidences of this persistence in the dispersion patterns (e.g. Cape Kennedy, NE of Florida, delta of the Apalachicola river, NW of Florida), this phenomenon is accentu-ated along Brazil’s East-Northeast coastline because of its location in relation to the trade winds belt.
Finally, it should be emphasized that there are other coastal regions in the world characterized by large zones of divergence in the direction of the net longshore drift of sediments, such as the south coast-line of Africa, east of the United States and west of Australia, for example (Silvester 1968). However, as far as we know, the tendency to a potential in-tensity of the net longshore drift of sediments, in a zone of divergence with such a dimension (900 km), increasing in almost its entire extension con-tinuously in value toward downdrift, seems to us to
ACKNOWLEDGMENTS
A.C.S.P. Bittencourt, J.M.L. Dominguez and D.L. Sousa thank CNPq (Brazilian National Research Council), the first two for their Research Productiv-ity Fellowship, and the third for his Scientific Ini-tiation Scholarship. This research was financed by CNPq (Process no 521185-95-5) and by the Inter-national Convention CNPq/IRD (Orstom), Project AIMPACT.
RESUMO
Utilizando-se as direções médias das principais
frentes-de-onda que se aproximam do trecho costeiro do nordeste
brasileiro compreendido entre as localidades de Rio Real
(Sergipe) e Galinhos (Rio Grande do Norte) – coincidentes
com aquelas dos principais ventos que ocorrem na área –
e de seus períodos, nós definimos um modelo de clima de
ondas baseado na construção de diagramas de refração.
O modelo resultante de transporte de sedimentos, obtido
por modelagem numérica feita a partir dos diagramas de
refração, considerando o ângulo de aproximação e a altura
das ondas ao longo da isóbata de 10m, foi capaz de
repro-duzir os padrões de dispersão de sedimentos fornecidos
pelos indicadores geomórficos de deriva litorânea. Toda
essa região costeira, com cerca de 900km de extensão,
caracteriza-se por se constituir em uma grande zona de
divergência no sentido da deriva litorânea efetiva dos
se-dimentos, cuja intensidade potencial aumenta
considera-velmente de valor, por quase toda a sua extensão, de uma
maneira contínua, no sentido de sotamar. Este fato
im-plica em um défict crescente de sedimentos no sentido de
sotamar, o que pode explicar a maior ou menor
suscetibi-lidade, de longa duração, para a erosão ao longo do trecho
costeiro aqui estudado, durante o Quaternário.
Palavras-chave:deriva litorânea, refração de onda, mo-delagem numérica, evolução do Quaternário costeiro,
cos-ta do Nordeste brasileiro.
REFERENCES
contribuição ao 1◦Seminário sobre as ondas e marés. Arraial do Cabo – RJ. 1◦Seminário sobre ondas e marés. Instituto de Estudos do Mar Almirante Paulo Moreira – Ministério da Marinha, p. 31-33.
Barbosa LM, Bittencourt ACSP, Dominguez JML and Martin L.1986a. The Quaternary coastal de-posits of the State ofAlagoas: influence of the relative sea-level changes. In: J. Rabassa(Ed.), Quaternary of South America and Antarctica Peninsula, Vol. 4. Balkema, Rotterdam, p. 269-290.
Barbosa LM, Bittencourt ACSP, Dominguez JML and Martin L.1986b. Mapa Geológico do Quater-nário Costeiro do Estado de Alagoas (jointly pub-lished with the Mapa Geológico do Estado de Ala-goas, 1:250.000). DNPM. Série Mapas e Cartas de Síntese, 2, Seção Geológica No2, Recife, Brazil.
Bascom WJ.1954. The control of stream outlets by wave refraction. J Geol 62: 600-605.
Bigarella JJ.1975. The Barreiras Group in northeastern Brazil. An Acad Bras Cienc 47: 365-393.
Bittencourt ACSP, Dominguez JML, Martin L and Ferreira YA. 1982. Dados preliminares sobre a evolução do delta do Rio São Francisco (SE/AL) du-rante o Quaternário: influência das variações do nível do mar. In: IV Simpósio do Quaternário. Rio de Janeiro, Brazil, p. 49-68.
Bittencourt ACSP, Martin L, Dominguez JML and Ferreira YA.1983. Mapa Geológico do Quater-nário Costeiro do Estado de Sergipe (jointly pub-lished with the Mapa Geológico do Estado de Ser-gipe, 1:250.000). DNPM, Brazil.
CERC (Coastal Engineering Research Center).
1984. Shore Protection Manual. U.S. Army Corps of Engineers. Washington, D.C. V. I, 597p.; V. II, 603p.
Davies JL.1972. Geographical variation in coastal de-velopment. Longman Inc New York, 204p.
Davis RA and Hayes MO.1984. What is a wave domi-nated coast? Mar Geol 60: 313-329.
DHN (Diretoria de Hidrogafia e Navegação).1993. Atlas de Cartas-Piloto. Oceano Atlântico, de Trinda-de ao Rio da Prata, 13p.
DHN (Diretoria de Hidrogafia e Navegação).1999. Tábuas das Marés, 194p.
Dominguez JML.1995. Shoreline erosion in NE Brazil: a coastal evolution approach to assess short and long
term causes. In: 1st SEPM Congress on Sedimen-tary Geology. Florida, Congress Program and Ab-stracts: 47.
Dominguez JML and Bittencourt ACSP.1996. Re-gional Assessment of Long-term Trends of Coastal Erosion in Northeastern Brazil. An Acad Bras Cienc 68: 355-371.
Dominguez JML, Bittencourt ACSP, Leão ZMAN and Azevedo AEG.1990. Geologia do Quaternário Costeiro do Estado de Pernambuco. Rev Bras Geo-cienc 20: 208-215.
Dominguez JML, Bittencourt ACSP and Martin L.
1992. Controls on Quaternary coastal evolution of the east-northeastern coast of Brazill: roles of sea-levels history, trade winds and climate. Sed Geol 80: 213-232.
Kokot RR.1997. Littoral drift, evolution and manage-ment in Punta Médanos, Argentina. J Coastal Res 13: 192-197.
Komar PD.1976. Beach processes and sedimentation. Prentice Hall, New Jersey, 429p.
Mabesoone JM, Campos e Silva A and Beurlen K.
1972. Estratigrafia e origem do Grupo Barreiras em Pernambuco, Paraíba e Rio Grande do Norte. Rev Bras Geocienc 2: 173-188.
Martin L, Dominguez JML and Bittencourt ACSP.
1998. Climatic control of coastal erosion during a sea-level fall episode. An Acad Bras Cienc 70: 249-266.
MMA/UFRJ/FUJB/LAGET.1996. Macrodiagnóstico da Zona Costeira do Brasil na Escala da União. Brasília: Programa Nacional do Meio Ambiente, 280p.
Silvester R.1968. Sediment transport long-term net movement. In: The Encyclopedia of Geomor-phology, (Ed.) R. W. Fairbridge. Reinhold Book Corp. p. 958-989.
Testa V and Bosence DWJ.1999. Physical and biolog-ical controls on the formation of carbonate and sili-ciclastic bedforms on the north-east Brazilian shelf. Sed 46: 279-301.
US Navy.1978. Marine Climatic Atlas of the World, V. IV, South Atlantic Ocean. Washington DC 325p.