Repositório ISCTE-IUL
Deposited in Repositório ISCTE-IUL:2017-12-21
Deposited version:
Post-print
Peer-review status of attached file:
Peer-reviewed
Citation for published item:
Jalali, S. M., Moro, S., Mahmoudi, M. R., Ghaffary, K. A., Maleki, M. & Alidoostan, A. (2017). A comparative analysis of classifiers in cancer prediction using multiple data mining techniques. International Journal of Business Intelligence and Systems Engineering. 1 (2), 166-178
Further information on publisher's website:
10.1504/IJBISE.2017.10009655
Publisher's copyright statement:
This is the peer reviewed version of the following article: Jalali, S. M., Moro, S., Mahmoudi, M. R., Ghaffary, K. A., Maleki, M. & Alidoostan, A. (2017). A comparative analysis of classifiers in cancer prediction using multiple data mining techniques. International Journal of Business Intelligence and Systems Engineering. 1 (2), 166-178, which has been published in final form at
https://dx.doi.org/10.1504/IJBISE.2017.10009655. This article may be used for non-commercial purposes in accordance with the Publisher's Terms and Conditions for self-archiving.
Use policy
Creative Commons CC BY 4.0
The full-text may be used and/or reproduced, and given to third parties in any format or medium, without prior permission or charge, for personal research or study, educational, or not-for-profit purposes provided that:
• a full bibliographic reference is made to the original source • a link is made to the metadata record in the Repository • the full-text is not changed in any way
The full-text must not be sold in any format or medium without the formal permission of the copyright holders.
Serviços de Informação e Documentação, Instituto Universitário de Lisboa (ISCTE-IUL) Av. das Forças Armadas, Edifício II, 1649-026 Lisboa Portugal
Phone: +(351) 217 903 024 | e-mail: [email protected] https://repositorio.iscte-iul.pt
1
A Comparative Analysis of Classifiers in Cancer
Prediction Using Multiple Data Mining Techniques
Seyed Mohammad Jafar Jalali * Corresponding Author [email protected]
Department of Information Technology, Allameh Tabataba’i University, Tehran, Iran Sérgio Moro
Instituto Universitário de Lisboa (ISCTE-IUL), ISTAR-IUL, Lisboa, Portugal & ALGORITMI Research Centre, University of Minho, Guimarães, Portugal
Mohammad Reza Mahmoudi [email protected]
Department of Statistics, Fasa University, Fasa, Iran
Keramat Allah Ghaffary
Department of Computer Engineering, Fasa University, Fasa, Iran
Mohsen Maleki [email protected]
Department of Statistics, Shiraz University, Shiraz, Iran Aref Alidoostan
Department of Information Technology, Islamic Azad University of Science and Research of Fars, Shiraz, Iran
Abstract
In recent years, application of data mining methods in health industry has received increased attention from both health professionals and scholars. This paper presents a data mining framework for detecting breast cancer based on real data from one of Iran hospitals by applying association rules and the most commonly used classifiers. The former were adopted for reducing the size of datasets, while the latter were chosen for cancer prediction. A k-fold cross validation procedure was included for evaluating the performance of the proposed classifiers. Among the six classifiers used in this paper, support vector machine achieved the best results, with an
2
accuracy of 93%. It is worth mentioning that the approach proposed can be applied for detecting other diseases as well.
Keywords: Cancer prediction, data mining, classifiers, association rules
1. Introduction
Data mining or knowledge discovery in databases can be defined as the process for discovering the hidden patterns from amounts of data. Data mining can be applied in various industries such as healthcare (Brahami, Atmani et al. 2013), risk detection (Koyuncugil and Ozgulbas 2012) and fraud detection (Akhilomen 2013). In recent years, data mining has received much attention of health scholars and professionals. Some benefits of data mining in health industries include providing fast and practical solutions to the patients at a lower cost, detection of illness caused and recommending the medical treatment methods, and building drug recommendation systems. Large amounts of complex and vast data about disease diagnosis records are generated by health centres which are difficult to analyse, although that analysis is in demand for retrieving important information that may help health professionals in their future decision making. Data mining can be introduced as a way for overcoming these difficulties through three common methods: classification, clustering and association rules.
In today’s world, cancer is recognized as a common disease and it is still the main cause of death in the world. In the United States, cancer is the second cause of death and maintenance costs for cancer patients is estimated around 263.3 billion dollars per year (Yeh, Chang et al. 2009). Breast cancer is the most commonly diagnosed cancer in women worldwide, with over approximately one million new cancer cases diagnosed per year. It is estimated that breast cancer will kill approximately 500,000 women annually (Strand, Tverdal et al. 2005). However, due to the development of medicine technology and improved treatment, which leads to early diagnosis, it can be observed a decline of breast cancer mortality over the last decade, with the survival rate increasing as technology evolves. Notwithstanding, detecting a-priori cancer situations is a mandatory problem to be solved in order to assure adequate medical interventions, as the sooner the cancer is detected, the higher are the probabilities of overcoming the disease. Previously mentioned premises justify further developing an effective and efficient prediction model to diagnose breast cancer disease as early as possible. Thus, it is essential to provide a framework for early diagnosis of breast cancer. In this research, a two-stage framework including association rules and different machine learning techniques is proposed, with its accuracy being evaluated on a real breast cancer dataset. In the first stage, a feature selection procedure occurs for reducing the number of attributes on the breast cancer dataset through association rules which leads to omit the unnecessary data and considered as new input for the next stage. Finally, in the second stage, we employ a comparative analysis of machine learning classifiers on these inputs to determine which classifier can predict the breast cancer performance regarding their accuracy, sensitivity and specificity.
The remainder of this paper is organized as follows. Section 2 provides the reader with the background on breast cancer research, an overview of data mining, applications of data mining in
3
the health industry and breast cancer, and previously published relevant literature. In Section 3, we explain in detail the proposed data mining framework and further describe the steps of gathering data, using classifiers and the k-fold cross-validation procedure. In Section 4, the results are discussed. The paper concludes with Section 5 where we summarize findings, highlight the study limitations and describe further research directions.
2. Literature Review
In the past decade, in light of dramatic developments in analytical medicine tools for automated data collection, exponentially increasing amounts of data have been generated and stored in clinical datasets each year. Thus, traditional data management and analysis technologies are not capable of processing such huge loads of data. This is where new techniques such as data mining (DM) come into play (Shmueli, Patel et al. 2016). DM is an area of computer science encompassing a variety of multidimensional analysis techniques, statistical or pattern recognition methods and machine learning algorithms (Kourou, Exarchos et al. 2015). Technically, DM can be defined as the process of finding and extracting patterns of knowledge as well as identifying relationships within a large amount of data from several perspectives to produce actionable knowledge. Typically, descriptive and predictive analyses are two types of DM. Descriptive analysis is about unveiling information from data, while predictive analysis is focused in computing predictions based on existing data (Shmueli, Patel et al. 2016). In theory, DM is a formal process which is generally performed in six steps as follows: domain understanding, data understanding, data preparation, modelling, evaluation, and deployment. DM is often also used as a synonymous of the modelling step, for it is when the pattern discovery occurs.
DM can virtually be applied to any. One common application for DM is in customer related tasks such as targeting (Moro, Cortez, & Rita, 2014) and customer relationship management (CRM) (Hosseini, Maleki et al. 2010), for enabling to find patterns and analyse large quantities of customer data to discover useful relationships for predicting future behaviour of customers. Furthermore, in recent years, DM applications have already provided benefits in several areas of medical industry such as diagnosis, prognosis and treatment (Bellazzi and Zupan 2008). Also, many medical centres are taking advantage from DM techniques to identify patterns and predict the behaviour of their patients (Bellazzi and Zupan 2008). As an example, (Rodger, 2016) attempted to predict traumatic brain injury survival rates through data mining.
Applying DM and knowledge discovery techniques in databases of breast cancer disease have been at the core of several previously published studies (Rhodes, Yu et al. 2004, Delen, Walker et al. 2005, Anunciaçao, Gomes et al. 2010, Sarvestani, Safavi et al. 2010, Lavanya and Rani 2012, Takada, Fujimoto et al. 2016). (Chou, Lee et al. 2004) have used the techniques of artificial neural network and multivariate adaptive regression for classifying a database of breast cancer. Additionally, (Jerez-Aragonés, Gómez-Ruiz et al. 2003) predicted the clinical outcome of patients after breast cancer surgery using a combined method of classifiers including neural network and decision trees. (Şahan, Polat et al. 2007) proposed a hybrid method for fuzzy-artificial immune system and k-nearest neighbour algorithm for breast cancer diagnosis. In the study of (Übeyli 2007), the author implemented an automated diagnostic system for detection of breast cancer using different classifiers, for instance, multilayer perceptron neural network,
4
combined neural network , probabilistic neural network , recurrent neural network , and support vector machine (SVM), which were applied to a breast cancer database and the results of the classifiers were compared. (Karabatak and Ince 2009) proposed an automatic diagnosis system for detecting breast cancer based on association rules and neural network which classified the attributes of breast cancer data with a high accuracy. (Karabatak 2015) has used a machine learning technique called naïve Bayesian to detect breast cancer.
(Adam, Qu et al. 2002) surveyed the detection of prostate cancer in patients by building a decision tree. For the feature selection, they have utilized peak detection method implemented in the Ciphergen SELDI(r) software, selecting nine highest peaks as features. They have achieved the following performance metrics through this approach: 96% of accuracy, 83% of sensitivity and 97% of specificity. Another study has been conducted by (Poon and Johnson 2001) in which they aimed at discriminating hepatocellular carcinoma from liver cancer. They identified two hundred and fifty significant features by applying the feature selection method of significance analysis of microarrays (SAM). Also, they have examined liver cancer dataset with a developed neural network algorithm trained by weighted back-propagation and feed-forward type, composed of three layers: one input layer, and seven nodes in the hidden layer with one output layer. They correctly classified 18 out of 20 chronic liver disease cases, translated by a specificity of 90% and 35 out of 38 hepatocellular carcinoma cases. (Qu, Adam et al. 2002) have used the same method of (Poon and Johnson 2001) for feature selection and applied a boosted decision-tree classifier for detection of prostate cancer. They had reported a specificity of 94.3% and a sensitivity of 91.1%.
Identifying ovarian cancer using classifier algorithms has also been studied by different scholars. After applying genetic algorithm for the purpose of feature selection, they applied self-organization clustering analysis in the learning process. They have achieved the following results: 100% of sensitivity and 95% of specificity, which are remarkable results. The same procedure has been examined by (Petricoin, Ornstein et al. 2002) for the identification and detection of prostate cancer. They have classified patients with prostate cancer resulting in a 95% of sensitivity within a confidence interval of 82-99%; and also classified 177 out of 228 patients that had benign conditions with 78% of specificity and a confidence interval of 72-83%.
In the study conducted by (Li, Zhang et al. 2002), the authors applied the unified maximum separability analysis on their dataset. They have also experienced a 93% of sensitivity and a 91% of specificity. Prostate cancer has been analysed using several classifier algorithms. (Cazares, Adam et al. 2002) have adopted logistic regression classifier on the prostate cancer dataset and achieved a sensitivity of 93% and a specificity of 94%. Another study in which the authors performed for detection of liver cancer is the one by (Poon, Yip et al. 2003). They applied a hierarchical clustering algorithm to identify liver disease. Also, the features were selected through a hierarchical clustering analysis. However, they did not report metrics on sensitivity, specificity, or accuracy.
By reviewing existing literature, there is a lack of studies which classify breast cancer through various machine learning techniques and compare their results. It is also worthwhile to mention that in the previous literatures, scholars have not been particularly focused on the process of feature selection through association rules technique. Nevertheless, feature selection is a highly
5
relevant task, essential to successfully modelling a problem (Moro, Cortez, & Rita, 2016). By applying association rules, a realistic feature selection occurs, which leads to better modelling performance (Sánchez, Vila et al. 2009) as a result of reducing the size of dataset. Thus in this study, different machine learning techniques such as decision tree, support vector machine, k-nearest neighbour, naïve Bayes, random forest and neural network have been applied to a breast cancer dataset after applying the association rules algorithm for dataset size reduction. Finally the results of each classifier have been compared, with the best classifier chosen for a more accurate cancer prediction.
3. Research Methodology 3.1. Data set
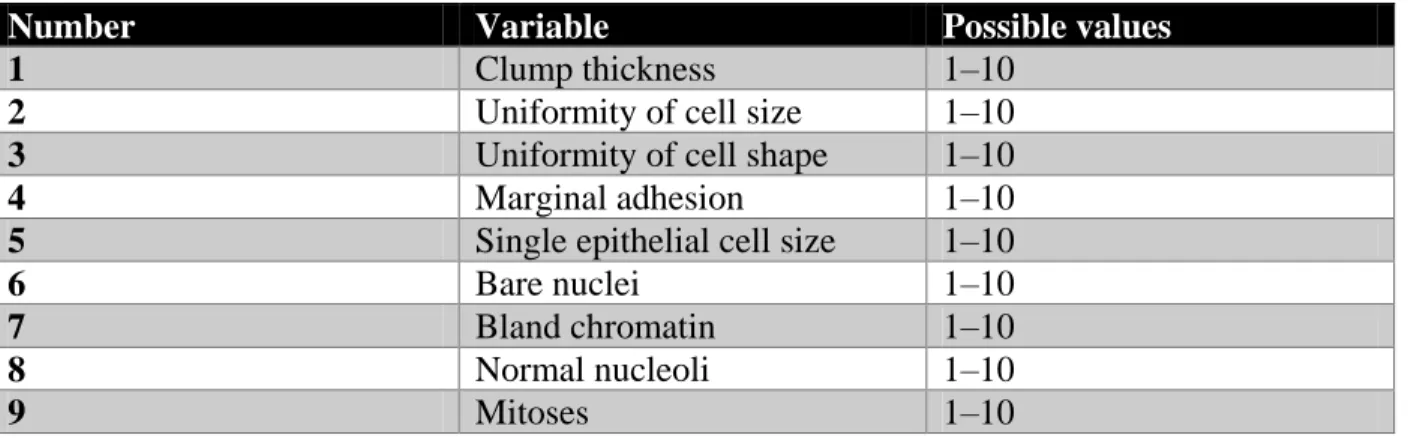
In October 2015, a breast cancer dataset has been compiled from Neyriz hospital located at the city of Neyriz in Fars, a province of Iran. Data was gathered for the previous six months, and we have chosen the breast cancer features which have also been used in another breast cancer studies such as Clump thickness, Uniformity of cell size, Uniformity of cell shape, Marginal adhesion, Single epithelial cell size, Bare nuclei, Bland chromatin, Normal nucleoli and Mitoses. The dataset contained a total of 844 records corresponding to an equivalent number of patients, and nine features. The features are shown in Table 1 are in the grade of 1–10, with 10 being the highest amount state. In this dataset, 281 records are facing with malignant cancer and 563 records are facing with benign cancer.
Table 1 - Dataset structure
Number Variable Possible values
1 Clump thickness 1–10
2 Uniformity of cell size 1–10
3 Uniformity of cell shape 1–10
4 Marginal adhesion 1–10
5 Single epithelial cell size 1–10
6 Bare nuclei 1–10
7 Bland chromatin 1–10
8 Normal nucleoli 1–10
9 Mitoses 1–10
Table 2reports participants’ demographic information. As Table 2indicates, 563 healthy persons (65.5%), and 281 persons (34.5%) with the disease participated in this study.
Table 2 - Demographic information of the participants in the study Frequency Percent Valid Percent Cumulative
Percent
Healthy 563 65.5 65.5 65.5
6
Frequency Percent Valid Percent Cumulative Percent
Healthy 563 65.5 65.5 65.5
Ill 281 34.5 34.5 100.0
Total 844 100.0 100.0
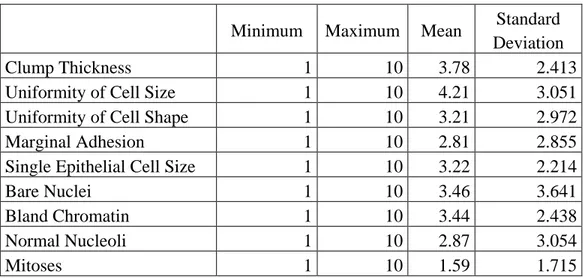
Also, Table 3 concerns the descriptive statistics of other research variables which represented minimum, maximum, mean and standard deviation.
Table 3 - Descriptive statistics of research variables
Minimum Maximum Mean Standard Deviation
Clump Thickness 1 10 3.78 2.413
Uniformity of Cell Size 1 10 4.21 3.051
Uniformity of Cell Shape 1 10 3.21 2.972
Marginal Adhesion 1 10 2.81 2.855
Single Epithelial Cell Size 1 10 3.22 2.214
Bare Nuclei 1 10 3.46 3.641
Bland Chromatin 1 10 3.44 2.438
Normal Nucleoli 1 10 2.87 3.054
Mitoses 1 10 1.59 1.715
3.2. Research Framework
The framework applied in this research is shown in Figure 1. As it can be seen, it is designed in two stages, each encompassing three steps. The first stage is dedicated to applying association rules’ algorithm denominated “apriori”. After reducing the number of input features, stage two begins. In this stage, six classifiers have been applied, with the results of all of them being validated through a k-fold cross-validation scheme.
Figure 1 - Steps of Research 3.3. Association rules Breast cancer data set Preparation Applying Association Rule Mining Preparing the Reduced Data set Applying Six Classifiers K-Fold Cross Validation Analysis and Discussion
7
Considering some of the input instances contain noise, it is not feasible to include all records (844) as input for building the model, as noise tents to increase errors in the classification process. Furthermore, due to a large number of features, high computational power is required for encompassing all the information hidden in the features during classification. Thus, the feature selection procedure proposed in this study is based on association rules, which are considered a viable data mining approach for selecting the most significant features among those that best characterize the presence of breast cancer. By applying association rules, the algorithm attempts to remove noisy and redundant features from the dataset, choosing the minimal and appropriate subset of features to perform an efficient classification and extract the best patterns for breast cancer detection.
Association rules can be defined as the process of finding valuable associations and/or relationships among amounts of data. Through this technique, it is possible to quantify the value of each feature by evaluating its frequency within the dataset, thus allowing to capture all possible rules that explain the presence of some features according to the presence of another features (Nahar, Imam et al. 2013). The most practical association rules algorithm in solving the problems of data mining is called “apriori” (Rao and Gupta 2012).The pseudo-code of apriori algorithm is illustrated in Figure 2.
Figure 2- Structure of Apriori Algorithm
“Apriori” first scans the transaction D in order to count the support of each item “i”, and determines the set of large 1-itemsets. Then, iterations are performed for each of the computation of the set of 2-itemsets, 3-itemsets, and so on in order to find out which overlapping and simultaneous sets of items have come together in one occurrence throughout the dataset. After applying “apriori” algorithm in the breast cancer dataset, the most relevant features have been selected and the redundant data have been omitted from the dataset. According to the features in breast cancer dataset described in Table 1, tow variables named as Marginal adhesion and Bare nuclei have been considered as the noise data and have been removed accordingly during the feature selection process. Thus, a new subset consisting of seven features has been provided for solving the problem of classification. These variables are Clump thickness, Uniformity of cell
8
size, Uniformity of cell shape, Single epithelial cell size, Bland chromatin, Normal nucleoli and Mitoses.
3.4. Machine Learning Classifiers
In this stage, different machine learning classifier approaches have been adopted to achieve the highest possible performance. To predict whether a person’s tumour is considered as malign or benign, six predictive algorithms were chosen, namely: decision tree (DT), support vector machine (SVM), k-nearest neighbour (KNN), naïve Bayes (NB), random forest (RF) and neural network (NN). For the experiments, the R statistical environment was chosen, as it provides an open source scripting language specifically designed for data analysis.
K-fold cross-validation has been used for evaluating the performance of each algorithm. The performance of the six classifiers was assessed through standard metrics, computed using the values obtained from a confusion matrix, namely: (TN), true positives (TP), false positives (FP), and false negatives (FN). Accuracy (ACC) of a classifier is defined as the percentage of target and non-target features which have been correctly predicted:
Sensitivity (SN) of a classifier is defined as the percentage of target features which have been predicted correctly:
Specificity (SP) of a classifier is defined as the percentage of non-target features that were correctly predicted:
Precision or positive predictive value (PPV) is as follows:
Likewise, negative predictive value (NPV) appears as follows:
Finally, the classifier that had the highest accuracy among six classifiers was selected as the best predictor. The validation of the performance among the six classifiers is summarized in Table 4.
Table 4 – Validation Values for Six Classifiers Classification
Algorithm Accuracy Sensitivity Specificity
Positive predictive
Negative predictive
9 value value Decision Tree .7803 .7933 .7847 .7923 .7706 Support vector Machine .9372 .9332 .9226 .9342 .9233 K-Nearest Neighbour .8773 .9152 .8374 82.77 .9218 Naïve Bayes .7721 .8420 .7152 .7662 .8021 Random Forest .9121 .9327 .8872 .9099 .9233 Neural network .9233 .9361 .9194 .9253 .9223 4. Discussion
According to the results of the classification models, the classifiers were evaluated based on performance metrics including accuracy, sensitivity, and specificity. As it can be observed, Table 4 demonstrates the results of classifier algorithms in a tabular format, with the results being achieved using 8-fold cross-validation for each classifier. Support vector machine classifier achieved a classification accuracy of 0.9372 with a sensitivity of 0.9332 and a specificity of 0.9226, implying it performs better than all the remaining six classifiers. The neural network classifier attained an accuracy of 0.9233 with a sensitivity of 0.9361 and a specificity of 0.9194, meaning it ranks second behind SVM as the most accurate algorithm. On the opposite, naïve Bayes classifier model is the weakest, with an accuracy of 0.7721, sensitivity of 0.8420 and specificity of 0.7152.
It should be noted that sensitivity factor is considered as an effective method for extracting the cause and effect relationship between the inputs and outputs of a classifier algorithm and has been implemented in this study to attend some insight into the decision features used for the classification algorithm. As the SVM achieved the highest performance, it was chosen for extracting the relevance of each individual feature. The results show that Clump Thickness is the most relevant feature when modelling breast cancer, implying it influences more in detecting this disease. Second, Normali nucleoli appears also as a relevant feature, followed by the Uniformity of cell shape and the Uniformity of cell size. The two latter are known to be good indicators for the presence of cancer, including breast cancer, thus its emergence from the sensitivity analysis brings no novelty. Nevertheless, the two most relevant features, along with the fact that it is the combined model that works together toward predicting cancer, with all features playing a role, can be seen as a relevant contribution in terms of modelling breast cancer.
10
Figure 3- Sensitivity analysis of features
5. Conclusion
This study offers a complete procedure for building a system able to predict breast cancer. The solution proposed includes a feature selection procedure based on association rules, specifically, the well-known “apriori” algorithm. Since selecting the right features is considered a key step toward a tuned model, a lot of effort was devoted to this stage. It should be stated that the problem itself is characterized by a set of features all related to cellular level, thus some of them have inter-relationships, as it was unveiled by our process. Specifically, two features were discarded, with the remaining seven being included for building a tuned model.
Given the high relevance of the problem at hands, we chose to include six modelling algorithms which have proven effectively in past studies, with the most recent performing better for our case, namely the neural network and the support vector machine. To assure a proper validation procedure, we adopted a k-fold cross-validation scheme, with eight folds. As the support vector machine achieved an accuracy of 93.7% in predicting the malign cases, it was chosen for unveiling through a sensitivity analysis how each feature contributes for modelling breast cancer. Also, it should be stated that the value and contribution of this study lies on using real data from patients, which is usually not directly available to researchers, as it may pose confidentiality issues, considering it is personal data. Nevertheless, none of the patients were identified, only the tissue samples provided the features for our experiments.
Notwithstanding, the major limitation of this study is considering data from a specific hospital in a specific location in Iran. Thus, future research may include adopting a similar experimental procedure in data obtained from other locations around the world and compare the results with the ones exhibited within this manuscript. On the technical side, other methods could be
0 0.1 0.2 0.3 0.4 0.5 0.6 0.7 0.8 0.9
11
employed in the feature selection procedure, such as mutual information, to assure that the features discarded through the association rule’s results are indeed the proper ones.
References
Adam, B.-L., et al. (2002). "Serum protein fingerprinting coupled with a pattern-matching algorithm distinguishes prostate cancer from benign prostate hyperplasia and healthy men." Cancer Research 62(13): 3609-3614.
Akhilomen, J. (2013). Data mining application for cyber credit-card fraud detection system. Industrial Conference on Data Mining, Springer.
Anunciaçao, O., et al. (2010). A data mining approach for the detection of high-risk breast cancer groups. Advances in Bioinformatics, Springer: 43-51.
Bellazzi, R. and B. Zupan (2008). "Predictive data mining in clinical medicine: current issues and guidelines." International journal of medical informatics 77(2): 81-97.
Brahami, M., et al. (2013). "Dynamic knowledge mapping guided by data mining: application on healthcare." Journal of Information Processing Systems 9(1): 1-30.
Cazares, L. H., et al. (2002). "Normal, benign, preneoplastic, and malignant prostate cells have distinct protein expression profiles resolved by surface enhanced laser desorption/ionization mass spectrometry." Clinical Cancer Research 8(8): 2541-2552.
Chou, S.-M., et al. (2004). "Mining the breast cancer pattern using artificial neural networks and multivariate adaptive regression splines." Expert Systems with Applications 27(1): 133-142.
Delen, D., et al. (2005). "Predicting breast cancer survivability: a comparison of three data mining methods." Artificial intelligence in medicine 34(2): 113-127.
Hosseini, S. M. S., et al. (2010). "Cluster analysis using data mining approach to develop CRM methodology to assess the customer loyalty." Expert Systems with Applications 37(7): 5259-5264.
Jerez-Aragonés, J. M., et al. (2003). "A combined neural network and decision trees model for prognosis of breast cancer relapse." Artificial intelligence in medicine 27(1): 45-63.
Karabatak, M. (2015). "A new classifier for breast cancer detection based on Naïve Bayesian." Measurement 72: 32-36.
Karabatak, M. and M. C. Ince (2009). "An expert system for detection of breast cancer based on association rules and neural network." Expert Systems with Applications 36(2): 3465-3469.
Kourou, K., et al. (2015). "Machine learning applications in cancer prognosis and prediction." Computational and structural biotechnology journal 13: 8-17.
Koyuncugil, A. S. and N. Ozgulbas (2012). "Financial early warning system model and data mining application for risk detection." Expert Systems with Applications 39(6): 6238-6253.
Lavanya, D. and K. U. Rani (2012). "Ensemble decision tree classifier for breast cancer data." International Journal of Information Technology Convergence and Services 2(1): 17.
Li, J., et al. (2002). "Proteomics and bioinformatics approaches for identification of serum biomarkers to detect breast cancer." Clinical chemistry 48(8): 1296-1304.
Moro, S., Cortez, P., & Rita, P. (2014). A data-driven approach to predict the success of bank telemarketing. Decision Support Systems, 62: 22-31.
Moro, S., Cortez, P., & Rita, P. (2016). A framework for increasing the value of predictive data-driven models by enriching problem domain characterization with novel features. Neural Computing and Applications, 1-9.
12
Nahar, J., et al. (2013). "Association rule mining to detect factors which contribute to heart disease in males and females." Expert Systems with Applications 40(4): 1086-1093.
Petricoin, E. F., et al. (2002). "Serum proteomic patterns for detection of prostate cancer." Journal of the National Cancer Institute 94(20): 1576-1578.
Poon, T. C. and P. J. Johnson (2001). "Proteome analysis and its impact on the discovery of serological tumor markers." Clinica chimica acta 313(1): 231-239.
Poon, T. C., et al. (2003). "Comprehensive proteomic profiling identifies serum proteomic signatures for detection of hepatocellular carcinoma and its subtypes." Clinical chemistry 49(5): 752-760.
Qu, Y., et al. (2002). "Boosted decision tree analysis of surface-enhanced laser desorption/ionization mass spectral serum profiles discriminates prostate cancer from noncancer patients." Clinical chemistry 48(10): 1835-1843.
Rao, S. and P. Gupta (2012). "Implementing Improved Algorithm Over APRIORI Data Mining Association Rule Algorithm 1."
Rodger, J. A. (2015). Discovery of medical Big Data analytics: improving the prediction of traumatic brain injury survival rates by data mining Patient Informatics Processing Software Hybrid Hadoop Hive. Informatics in Medicine Unlocked, 1, 17-26.
Rhodes, D. R., et al. (2004). "ONCOMINE: a cancer microarray database and integrated data-mining platform." Neoplasia 6(1): 1-6.
Şahan, S., et al. (2007). "A new hybrid method based on fuzzy-artificial immune system and k-nn algorithm for breast cancer diagnosis." Computers in Biology and Medicine 37(3): 415-423.
Sánchez, D., et al. (2009). "Association rules applied to credit card fraud detection." Expert Systems with Applications 36(2): 3630-3640.
Sarvestani, A. S., et al. (2010). Predicting Breast Cancer Survivability using data mining techniques. Software Technology and Engineering (ICSTE), 2010 2nd International Conference on, IEEE.
Shmueli, G., et al. (2016). Data Mining for Business Analytics: Concepts, Techniques, and Applications in XLMiner, John Wiley & Sons.
Strand, B. H., et al. (2005). "Is birth history the key to highly educated women's higher breast cancer mortality? A follow‐up study of 500,000 women aged 35–54." International journal of cancer 117(6): 1002-1006.
Takada, M., et al. (2016). "Inverse Association between Sodium Channel-Blocking Antiepileptic Drug Use and Cancer: Data Mining of Spontaneous Reporting and Claims Databases." International journal of medical sciences 13(1): 48.
Übeyli, E. D. (2007). "Implementing automated diagnostic systems for breast cancer detection." Expert Systems with Applications 33(4): 1054-1062.
Yeh, W.-C., et al. (2009). "A new hybrid approach for mining breast cancer pattern using discrete particle swarm optimization and statistical method." Expert Systems with Applications 36(4): 8204-8211.