Candidate Genes
Related with
Development Time
Variation in
Drosophila
americana and D.
novamexicana
José Pedro Taveira Gomes da Silva Barbosa
Cell and Molecular Biology Master’s Degree Dissertation
Presented to Faculty of Science, University of Porto
2017
M
S
c
FCUP 2017 C a nd ida te G e ne s R e la te d w it h D e v e lop m e nt Tim e V a ri a tion in D ro s op hil a a me ri c a na a nd D . no v a me x ic a na J o s é Pe d ro T a v e ir a G o m e s d a S ilv a B a rb o s a 2.º CICLOCandidate Genes
Related with
Development Time
Variation in
Drosophila
americana and D.
novamexicana
José Pedro Taveira Gomes da Silva
Barbosa
Cell and Molecular Biology Master’s Degree
Science Department, FCUP2017
Advisor
Jorge Manuel de Sousa Basto Vieira Main researcher at IBMC
jbvieira@ibmc.up.pt
Coadvisor
Cristina Alexandra Gonçalves Paula Vieira Auxiliary researcher at IBMC
cgvieira@ibmc.up.pt
Institute Address
IBMC – Instituto Biologia Molecular e Celular Edifício i3s - Rua Alfredo Allen nº 208 4200-135 Porto, Portugal
Todas as correções determinadas pelo júri, e só essas, foram efetuadas. O Presidente do Júri,
Declaração
Eu, José Pedro Taveira Gomes da Silva Barbosa, aluno com o número 201502150, inscrito no mestrado de Biologia Celular e Molecular no presente ano lectivo de 2016/2017, declaro por minha honra que sou o autor da totalidade do texto apresentado, não aprento texto plagiado, e tomei conhecimento das consequências de uma situação de plágio. Porto, 29 de Setembro de 2017
ix
Acknowledgments
The present work was elaborated and performed in the Phenotypic Evolution labs of
the i3s building, as part of the dissertation thesis of the Cell and Molecular Biology
Master’s Degree, part of the Faculty of Sciences of the University of Porto. To whom I
directed my acknowledgment and thanks. My sincere thanks to the contributions of many
individuals without whom this work wouldn’t be possible.
To FCUP, i3s, IBMC and FCT for the opportunity given to perform this work, the
facilities and conditions provided.
To Jorge Vieira and Cristina Vieira, my advisor and co advisor, for taking the chance
with an unknown student to work on one of their many interesting projects, to whom I
thank the vote of confidence, the adquired experience and the valuable knowledge
obtained.
To my lab mates, Vanessa, Rodrigo, Sara and Pedro for the shared experiences, the
knowledge sharing and the good welcoming in the group.
To my mom, dad and sisters, to whom I thank the possibility of providing for my
education, in my master’s degree, and the support given in all stages of my life.
To my grandmothers for the support and interested shown in this last 2 years.
To my friends and collegues, Necati, Rui, Marina, Sara, Carolina, Lissa, Eliana,
Miguel, Cláudio for the support given, the shared moments of friendships, the shared
experiences, and for the many years ahead.
To every person who has in someway contributed to this present project, my sincere
thanks.
xi
Abstract
Development time differences can have an impact on the organism and its history. In Drosophila there is an association between development time, lifespan and adult size. Drosophila is an ideal model for development studies since genomic data is available for many species, including D.
americana and D. novamexicana, furthermore, developmental time can be easily phenotyped as
here performed, it is important to understand the molecular basis of development time differences. A bioinformatics search for candidate genes was performed, focusing on genes with signs of positive selection, according to the bpositive database, furthermore, location on Muller’s element C was also considered, since an association between this chromosomal arm and developmental time [1] was seen reported in association with development processes and/or signaling pathways. Six candidate genes were chosen (Sin3A, sm, CG3209, yki, hpo, and Act79B). The strains used (D. americana strain W11; D. americana strain SF12; D. novamexicana strain 15010-1031.00,
here on mentioned as NOVA00), belong to the virilis group of species, a group with special interest because of the wide range of phenotypic differences found between closely related species. The expression of the candidate genes was studied using RT-PCR under 12 different conditions of development time and days of life. For Sin3A, sm, CG3209, hpo, and yki there are no significant differences in expression between flies with different development times at the same day of life, and for flies at different days of life with the same development time. For Act79B there are no significant differences between the flies with different development times at the same day of life. There is, however, a significant difference in gene expression between flies at different days of life and the same development time (the expression of Act79B decreases with age). Taking into account the findings for Act79B gene expression for different development times at the same day of life we can argue that it is not unexpected that the candidate genes are not showing differences in expression in flies with different development times, as Act79B expression levels suggests that there isn’t an ontogenetic development difference in flies with different development times at 4 and 8 days of adult life. It is unclear what causes a fly to have different days of development (15-16-17), since none of the selected genes could explain the difference between development times. Moreover, according to our findings, we hypothesize that development time variations and ontogenetic development of adult in Drosophila are not correlated.
KEY-WORDS: D. americana; D. novamexicana; Development Time; Positive Selection; Gene
xiii
Resumo
Em Drosophila, existe uma associação entre tempo de desenvolvimento, longevidade e tamanho dos adultos. Drosophila é um modelo ideal para estudos de desenvolvimento, uma vez que informações genómicas estão disponíveis para a maior parte das espécies, incluindo D. americana e D. novamexicana, e o tempo de desenvolvimento pode ser facilmente fenotipado, é importante entender quais as bases moleculares que explicam as diferenças no tempo de desenvolvimento. A pesquisa bioinformática de genes candidatos focou-se na procura de genes com sinais de seleção positiva, de acordo com a base de dados bpositive, para além da presença no elemento Muller C, uma vez que existe uma associação entre este braço cromosomal e o tempo de desenvolvimento [1], relevando associação com outros processos relacionados com o desenvolvimento e/ou vias de sinalização. Seis genes foram escolhidos (Sin3A, sm, CG3209, yki, hpo, e Act79B). As estirpes estudadas (W11 de D. americana; SF12 de D. americana e 15010-1031.00 de D. novamexicana,
daqui em diante mencionada como NOVA00), pertencem ao grupo de espécies virilis, um grupo com especial interesse devido à ampla variação fenotípica presente entre espécies proximamente relacionadas. A expressão destes genes foi estudada através de RT-PCR em 12 condições diferentes de tempo de desenvolvimento e dias de vida. Para Sin3A, sm, CG3209, hpo, e yki, não há diferenças significativas de expressão entre moscas com diferentes tempos de desenvolvimento no mesmo dia de vida e para moscas com diferentes dias de vida com o mesmo tempo de desenvolvimento. Act79B, não apresenta diferenças significativas de expressão em moscas com diferentes tempos de desenvolvimento no mesmo dia de vida. No entanto, existe uma diferença significativa na expressão de Act79B em moscas em dias diferentes de vida com o mesmo tempo de desenvolvimento (a expressão de Act79B decresce com a idade). Considerando os resultados para a expressão de Act79B em moscas com diferentes tempos de desenvolvimento e no mesmo dia de via, podemos sugerir que não é inesperado que os genes candidatos não mostrem diferenças de expressão em moscas com diferente tempo de desenvolvimento, uma vez que os níves de expressão de Act79B sugerem que não existe uma diferença no desenvolvimento ontogenético em moscas com maior tempo de desenvolvimento aos 4 e 8 dias de vida adulta. É questionável o que causa Drosophila a ter diferentes tempos de desenvolvimento (15-16-17), uma vez que nenhum dos genes selecionados pôde explicar estas diferenças. De acordo com os nossos resultados, sugerimos que a variação no tempo de desenvolvimento e o desenvolvimento ontogenético de adultos em Drosophila não estão correlacionados.
PALAVRAS-CHAVE: D. americana; D. novamexicana; Tempo de Desenvolvimento; Seleção
xv
Index
Acknowledgments ... ix Abstract ... xi Resumo... xiii Index ... xvIndex of Figures ... xvii
Index of Tables ... xix
List of Abbreviations ... xxi
I.1. Introduction ... 1
I.1. Project Presentation and Objectives ... 1
I.2. The Known Potential of Drosophila as a Model Organism in Biological Studies ... 3
I.3. The Drosophila Genus ... 4
I.3.1. The Importance of the Drosophila Genomes Sequencing Project and its Results ... 4
I.3.2. The Genus Main Characteristics... 7
I.4. The virilis Group of Species ... 9
I.4.1. virilis Group Main Characteristics ... 9
I.4.2. Phylogenetic Relationships in the virilis Genus ... 10
I.4.3. D. virilis ... 10
I.4.4. D. virilis and D. americana Relationship ... 11
I.4.5. D. americana ... 11
I.4.6. D. novamexicana and D. americana Relationship ... 12
I.5. Evolution in the Drosophila Genus ... 15
I.5.1. Overall Evolution ... 15
I.5.2. GO Terms Evolution ... 16
I.5.3. Categories Enriched with Genes Showing Signatures of Adaptive Evolution ... 17
I.5.4. The Evolution of Different Genomic Elements ... 19
I.5.5. Positive Selection ... 20
I.6.Development Studies in Drosophila ... 21
II. Material and Methods ... 25
II.1. Bioinformatic Search of Candidate Genes and the bpositive Database ... 25
xvi
II.3. Experimental Setup ... 26
II.4. RNA Extraction ... 27
II.5. DNA Digestion ... 28
II.6. Assaying DNA Contamination ... 28
II.7. Assaying RNA Integrity... 29
II.8. cDNA Synthesis ... 29
II.9. RT-PCR... 29
II.10. Primers Used for RT-PCR... 30
II.11. Electrophoresis Gels ... 31
III. Results ... 33
III.1. Selection of Candidate Genes ... 33
III.2. The Candidate Genes ... 39
III.2.1. Sin3A ... 39
III.2.2. sm (smooth) ... 40
III.2.3. CG3209 (GPAT4) ... 40
III.2.4. yki (yorkie) ... 41
III.2.5. hpo (hippo) ... 41
III.2.6. Act79B (Actin 79B) ... 43
III.3. Candidate Genes Expression ... 45
IV. Discussion ... 49
IV.1. Bioinformatic analysis of Candidate Genes ... 49
IV.1. Muller’s Element C ... 49
IV.2. Signs of positive selection ... 50
IV.2. Candidate Genes Expression ... 50
V. Conclusion ... 55
VI. References ... 57
xvii
Index of Figures
Figure 1 – Phylogram of the 12 sequenced species of Drosophila, derived using pairwise genomic mutation distances and the neighbor-joining method (adapted from [25]) ... 4 Figure 2 - Number of gene models in 12 Drosophila genomes that fall into one of the five mentioned homology classes (adapted from [25], see for further details). ... 5 Figure 3 - Syntenic Relationships of the Chromosomal Arms of the Drosophila Species (adapted from flybase.org [6]) ... 8 Figure 4 - Geographical location of D. americana, found east of the Rocky Mountains, a major mountain range in western North America (adapted from [90]) ... 12 Figure 5 - Geographical location of D. novamexicana, found in sparse populations confined to the southwestern desert of the United States, around Arizona and New Mexico (adapted from [90]) ... 13 Figure 6 - Pigmentation differences in the virilis group of Drosophila. Estimated divergence times [47] are shown on the scale at the bottom (MY=million years) (adapted from [95]) ... 13 Figure 7 - Patterns of constraint and positive selection among GO terms: a, biological process GO terms; b, cellular component GO terms; and c, molecular function GO term. Distribution of average ω per gene is shown and the negative log10 of the probability of positive selection for the selected genes (adapted from [25]). ... 16 Figure 8 - Model for hippo signalling pathway. The proteins (Ex) and (Mer) act upstream of the (hpo) kinase, which in turn activates the (Wts) kinase with help from the (Sav) adaptor protein.
Warts, together with its cofactor, Mats, suppresses the activity of the transcriptional coactivator yki. yki drives the expression of the downstream target genes bantam, cyclin E, diap1, ex, and mer. The expression of these effector genes is correlated with cell growth, cell-cycle progression,
and cell death. (adapted from [215]) ... 42 Figure 9a - Sin3A W11 ΔCT values per condition;Bars display t-test results for the comparisons made ... 46 Figure 9b - Sin3A SF12 ΔCT values per condition; Bars display t-test results for the comparisons made ... 46 Figure 9c - Sin3A NOVA00 ΔCT values per condition; Bars display t-test results for the comparisons made... 46 Figure 10a - sm W11 ΔCT values per condition; Bars display t-test results for the comparisons made ... 46 Figure 10b - sm SF12 ΔCT values per condition; Bars display t-test results for the comparisons made ... 46
xviii Figure 10c - sm NOVA00 ΔCT values per condition; Bars display t-test results for the comparisons made... 46 Figure 11a – CG3209 W11 ΔCT values per condition; Bars display t-test results for the comparisons made... 46 Figure 11b – CG3209 SF12 ΔCT values per condition; Bars display t-test results for the comparisons made... 46 Figure 11c – CG3209 NOVA00 ΔCT values per condition; Bars display t-test results for the comparisons made ... 46 Figure 12a - yki W11 ΔCT values per condition; Bars display t-test results for the comparisons made ... 47 Figure 12b - yki SF12 ΔCT values per condition; Bars display t-test results for the comparisons made ... 47 Figure 12c - yki NOVA00 ΔCT values per condition; Bars display t-test results for the comparisons made ... 47 Figure 13a - hpo W11 ΔCT values per condition; Bars display t-test results for the comparisons made ... 47 Figure 13b - hpo SF12 ΔCT values per condition; Bars display t-test results for the comparisons made ... 47 Figure 13c - hpo NOVA00 ΔCT values per condition; Bars display t-test results for the comparisons made ... 47 Figure 14a – Act79B W11 ΔCT values per condition; Bars display t-test results for the comparisons made ... 47 Figure 14b – Act79B SF12 ΔCT values per condition; Bars display t-test results for the comparisons made ... 47 Figure 14c – Act79B NOVA00 ΔCT values per condition; Bars display t-test results for the comparisons made ... 47
xix
Index of Tables
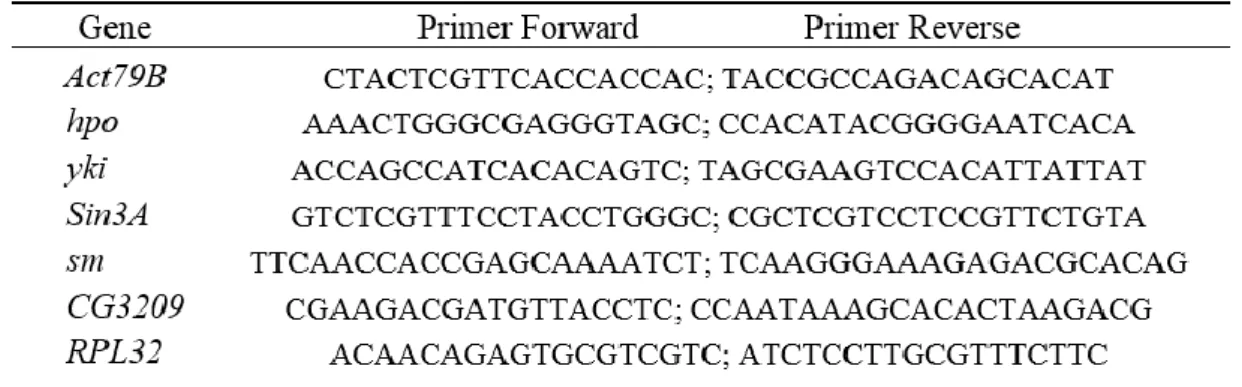
Table 1 - A summary of annotated features across all 12 sequenced genomes (adapted from [25]) ... 6 Table 2 - Sequence of primers forward and reverse for the 6 candidate genes and the reference gene (RPL32). Primer sequence (5'→3') ... 31 Table 3 - Number of D. melanogaster genes in each one of the selected GO Terms, by GO TERM; the number of genes associated with a chromosomal arm; number of genes located on chromosome 2R; number of these 2R genes that are analyzed according to bpositive; number of these analyzed genes in 2R that show signs of positive selection according to bpositive (P+). Lastly, the ratio between genes showing positive selection located on chromosome 2R and total of genes on the GO Term list... 35 Table 4 - Positively selected genes from GO:0032502-“developmental process” on chromosome 2R of D. melanogaster ... 35 Table 5 - Positively selected genes from GO:0048856-“anatomical structure development” on chromosome 2R of D. melanogaster ... 36 Table 6 - Positively selected genes from GO:0009888-“tissue development” on chromosome 2R of D. melanogaster ... 36 Table 7 - Positively selected genes from GO:0035220-“wing disc development” on chromosome 2R of D. melanogaster ... 36 Table 8 - Positively selected genes from GO:0009790-“embryo development” on chromosome 2R of D. melanogaster ... 36 Table 9 - Positively selected genes from GO:0048589-“developmental growth” on chromosome 2R of D. melanogaster ... 36 Table 10 - Positively selected genes from GO:0008340-“determination of adult lifespan” on chromosome 2R of D. melanogaster ... 37 Table 11 - Positively selected genes from GO:0035075-“response to ecdysone” on chromosome 2R of D. melanogaster ... 37 Table 12 - Positively selected genes from GO:0032868-“response to insulin” on chromosome 2R of D. melanogaster ... 37 Table 13 - Results of t-test per strain, per comparison and per gene studied. Highlights show significant results. ... 48
xxi
List of Abbreviations
ΔCT Variation of cycle threshold
AS Abdominal Size BDBM
CDS CRT
BLAST Database Manager coding sequences
Chill-Coma Recovery Time
CT DT
Cycle Threshold Development Time
Egfr Epidermal growth factor receptor GO Gene Ontology
Grs Gustatory Receptors GST Glutathione S-Transferase
LS LifeSpan miRNA microRNA
mtDNA mitochondrial DNA My Million Years ncRNA non-coding RNA
Ors Olfactory Receptors P450 cytochrome P450 RNAi
RQI RT
RNA interference RNA quality indicator Room Temperature
snRNA small nuclear RNA TAE Tm tRNA Tris-Acetate-EDTA melting temperature transfer RNA
1
I. Introduction
I.1. Project Presentation and Objectives
Development time differences can have an impact on the organism and its history, being widely associated with adaptation of species. Moreover, developmental time shows an association with lifespan and adult size among other traits [1]. Thus, it is important to understand the molecular basis of development time differences. One of the approaches to address this question is to search for genes that show variation at the amino acid level and that might affect the phenotypic differences observed in terms of developmental time. Another one is to compare the gene expression of candidate genes in individuals showing different developmental times. The model organism Drosophila is an ideal model for such studies since genomic data is available for many species, they are easy to maintain, and developmental time can be easily phenotyped.
Development has been well studied in Drosophila species and several studies show that for development time the type of food is one of the biggest modifiers of the phenotype [2]. Several other studies have made genetic and nutritional manipulations with the objective of observing the effects of this in development time of Drosophila, showing several degrees of association between the studied manipulations and the shown phenotypes [3]. However, in the present work, the goal was to study the observed differences in the development time of Drosophila, without subjecting flies to any genetic or nutritional manipulation.
This project focused on the study of the expression of candidate genes who could in principle explain the differences in development time in 3 strains of Drosophila (D. americana strain W11;
D. americana strain SF12; D. novamexicana strain NOVA00), all belonging to the virilis group.
These species group is interesting in many areas of studies, because of the wide range of phenotypic differences found between closely related species.
Genes on Muller’s element C were chosen because of the association between this chromosomal arm and developmental time [1]. The expression of the candidate genes was studied using RT-PCR under 12 different conditions, namely, strain W11 with 15 development days at 4 days of life and at 8 days of life; W11 with 16 development days at 4 days of life and at 8 days of life; strain SF12 with 15 development days at 4 days of life and at 8 days of life; SF12 with 16 development days at 4 days of life and at 8 days of life; strain NOVA00 with 16 development days at 4 days of life and at 8 days of life; NOVA00 with 17 development days at 4 days of life and at 8 days of life.
In this work, firstly, we present a review of the knowledge on the characteristics that make
2 We present a short review of its importance in the development of scientific knowledge around many areas of interest, the importance of the sequencing of the original 12 Drosophila genomes and their features, the main characteristics of Drosophila genus and the reason why virilis group is a remarkably interesting group of species. The comparisons between D. americana and D.
novamexicana, the two Drosophila species used in this project are discussed. Then, we briefly
review the relevant literature in development. Moreover, we present evidence of positive selection present in Drosophila genes involved with DT (development time). Lastly, the main results are discussed and their contributions to the topic of interest.
3
I.2. The Known Potential of Drosophila as a Model Organism in
Biological Studies
Many important features of Drosophila, show its great potential in molecular and cellular biology studies. Some of the biggest advantages of using the fruit fly are its short life cycle, easiness to keep in laboratory conditions, easiness of hybridization with closely related species and the numerous different strains with a wide range of phenotypic traits, among several other interesting characteristics.
The rapid and powerful genetic tools available for Drosophila in recent years have maximized the potential of the fruit fly in biology, elucidating gene mechanisms, and revealing novel disease-relevant biology [4]. Information on these resources and many other useful genetic reagents are available through flybase.org, an online annotated resource for Drosophila genetics (http://flybase.org) [5, 6].
The Drosophila system has also been used as a model to develop bioinformatic tools for the characterization of coding and regulatory regions [7, 8].
Considering the substantial genomic conservation with humans, it is no surprise that studies in Drosophila have touched almost all branches of human disease biology, evidencing the ever-growing importance of Drosophila as an organism model [9]. Many different studies have produced interesting results touching several different human diseases; this includes studies of sterol absorption in the gut [10], neuromuscular dysfunction in mucolipidosis [11], mechanisms of congenital renal disease [12] and cardiotoxicity from a high-fat diet [13]. The several
Drosophila models have warranted powerful insights into several neurodegenerative disorders
[14, 15, 16] such as Alzheimer’s and Parkinson’s disease [15], amyotrophic lateral sclerosis [17], Huntington’s disease [18, 19] and spinocerebellar ataxias [20]. Mechanisms to identify conserved regulators of pain perception [21], cardiac function [22] and adipocyte differentiation [23], have produced further insights into human disease. Many other screens have highlighted Mendelian disease genes [24].
It should be noted that all these studies rely on the key assumption that homologous genes between Drosophila and human will have conserved functional activities, leading to similar phenotypes when subject to any genetic manipulation besides the assumption of evolutionary conservation at the sequence level [4].
4
I.3. The Drosophila Genus
I.3.1. The Importance of the Drosophila Genomes Sequencing Project and its Results
Although D. melanogaster is a lot more extensively characterized and studied than other
Drosophila species, in recent years, other species of the genus have been the subject of many
studies. One important milestone in Drosophila biology was the sequencing of 12 Drosophila species (D. melanogaster, D. sechellia, D. simulans, D. yakuba, D. erecta, D. ananassae, D.
pseudoobscura, D. persimilis, D. willistoni, D. mojavensis, D. virilis and D. grimshawi) (Fig. 1),
known widely as the Drosophila 12 Genomes Consortium [25]. Important advances were made regarding the history, evolution, and the further understanding of the divergence of traits between species. The genus Drosophila includes both closely related species and species that are diverging for at least 40 My (million years) [26, 27]. For instance, D. melanogaster, D. americana and D.
novamexicana (the latter two of the virilis group and the subject species of our study) are
diverging for at least 40 My [26, 27]. Many other species have been sequenced since that time, including D. americana.
Figure 1 - Phylogram of the 12 sequenced species of Drosophila, derived using pairwise genomic mutation distances and the neighbor-joining method (adapted from [25])
It is established that the most important aspects of the cellular, molecular and developmental biology of the 12 sequenced species are well conserved. Therefore, the genomes of these species provide an excellent model for studying how conserved functions are maintained in the face of sequence divergence, as well as providing extensive resources for the study of the relationship between genome sequence and phenotypic diversity. The sequences provide a fantastic tool to contrast genome structure, genome content, and evolutionary dynamics across the well-defined phylogeny of the sequenced species (Fig. 1) [25].
5 As mentioned above, at a broad level, the overall genome structure is well conserved across the 12 sequenced species. This can be seen in several characteristics presented on Table1; here we highlight the differences between the 12 species, focusing on D. melanogaster, the model organism, and D. virilis, the closest species to D. americana and D. novamexicana. Total genome size (estimated by flow cytometry) has small variation ranging from 130Mb (D. mojavensis), 200Mb in D. melanogaster and further 364Mb (D. virilis) (Table 1), in contrast with a reported difference between Drosophila and mammals [28]. Total protein-coding sequence ranges from 38.9Mb in D. melanogaster, 57.9Mb in D. virilis, to 65.4Mb in D. willistoni. Intronic DNA content ranges from 19.6Mb in D. simulans, 21.7Mb in D. virilis, 21.8Mb in D. melanogaster to 24.0 Mb in D. pseudoobscura (Table 1). Despite the conservation found in this characteristics, there are many putatively non-neutral changes identified in protein-coding genes, non-coding RNA genes, and cis-regulatory regions. These differences may prove to be the basis of divergences in the ecology and behavior of these species [25]. Approximately 20% of transcription in D. melanogaster seems to be unassociated with protein-coding genes [29] and between 5.6–32.3% of gene models in non-melanogaster species correspond to protein-coding derived from transposable elements. There were 8,563 genes with single-copy orthologous genes in the melanogaster group and 6,698 genes with single-copy orthologous genes in all 12 species (Figure 2) [25, 30]. From the 21,928 cases in which a D.melanogaster gene was absent from another species, there were further identified plausible homologs for 13,265 (60.5%), confirmed absences of homology for 4,546 (20.7%) genes and the remaining 4,117 (18.8%) were unable to be resolved [25]. The number of ncRNA (non-coding RNA) genes per family in Drosophila is relatively low (Table 1). tRNAs (transfer RNAs) genes are the most abundant family of ncRNA genes in all 12 genomes, with 297 tRNAs in D. melanogaster, 279 in D. virilis and between 261– 484 tRNA genes in the other species (Table 1). From the 78 previously reported miRNA (microRNAs) genes, 71 (91%) are highly conserved across the entire genus, with the remaining seven genes restricted to the subgenus Sophophora. All species contain identical numbers of snRNA (small nuclear RNA) genes (Table 1)[25].
Figure 2- Number of gene models in 12 Drosophila genomes that fall into one of the five mentioned homology classes (adapted from [25], see for further details).
6 Table 1- A summary of annotated features across all 12 sequenced genomes (adapted from [25]).
Similar numbers of predicted protein-coding (Table 1) genes are observed across the 12 species. The majority of predicted genes in each species have homologs in D. melanogaster (Table 1). Most of the 13,733 protein-coding genes in D. melanogaster are conserved across the entire phylogeny: 77% have identifiable homologues in all 12 genomes, 62% can be identified as single-copy orthologues in the six genomes of the melanogaster group and 49% can be identified as single-copy orthologues in all 12 genomes (Fig. 2). Figure 2 summarizes studies by [25], presenting a number of gene models in 12 Drosophila genomes that fall into one of five homology classes: single-copy orthologues in all species (single-copy orthologues), conserved in all species as orthologues or paralogues (conserved homologues), a D. melanogaster homologue, but not found in all species (patchy homologues with mel.), conserved in at least two species but without a D. melanogaster homologue (patchy homologues, no mel.), and found only in a single lineage (lineage-specific). Furthermore, for species with expression data available, the fraction of genes in each homology class that fall into one of four evidence classes is presented. The vast majority (11,348/11,644, or 97.5%) of D. melanogaster proteins that can be unambiguously assigned a homology pattern are inferred to be ancestrally present at the genus root. Of the remaining 296 non-ancestrally present genes, 252 are Sophophora-specific. The remaining 44 proteins include 14 present in the melanogaster group, 23 present only in the melanogaster subgroup, 3 unique to the melanogaster species complex, and 4 found in D. melanogaster only [25].
The vast majority of multigene families are found in all 12 genomes, however, their size is highly dynamic: 4,692 (41.0%) gene families changed in size in at least one species, and an appreciable fraction shows rapid and lineage-specific expansions and contractions. There are at least 44 protein-coding genes unique to the melanogaster group, proteins who were found to have very different properties from ancestral ones [25].
Across the genus, transposable elements range from 2.7% in D. simulans and D.
grimshawi, 5.35% in D.melanogaster, 13.96% in D.virilis to 25% in D. ananassae (Table 1).
Within the Drosophila subgenus, D. grimshawi has the lowest transposable element content, possibly relating to its ecological status as an island endemic, which potentially minimizes the chances for horizontal transfer of transposable element families. The highest levels of
7 transposable elements are found in D. ananassae, who also has the highest numbers of pseudo-transfer (t)RNA genes (Table 1). These results further suggest a potential relationship between pseudo-tRNA genes and repetitive DNA, in accordance with what has been established in the mouse genome [31].
When looking into specific genes and parts of the genome, the number of structural changes and rearrangements is obviously larger; one interesting case is the several different rearrangements of genes in the Hox cluster found in Drosophila species [25]. Several cluster splits have been identified in Drosophila [32, 33] and the 12 Drosophila genome sequences provide additional evidence of Hox gene clustering in Drosophila. There are six different gene arrangements found, with no species retaining the inferred ancestral gene order [34].
I.3.2. The Genus Main Characteristics
The Drosophila genus is a large, diverse and widely distributed group of organisms [35]. Its taxonomy is relatively well known and established, there is broad information for most of the species [37]. The genus is paraphyletic as several other genera are included within the phylogeny of Drosophila [36]. Ten subgenera are presently recognized within the genus, of which
Sophophora and Drosophila are the major ones [38]; these are further taxonomically subdivided
into radiations and species groups. Of the two main subgenera, Drosophila is the largest one, comprising three major lineages: the funebris species group; the virilis-repleta radiation; and the
immigrans-tripunctata radiation.
The origin of the virilis-repleta radiation has been placed in the Old World tropics [39], most likely in the Asiatic tropical regions [35]; from this ancestor two lineages evolved leading to the Old World tropics (e.g. the polychaeta group) and temperate species groups (e.g. virilis,
robusta and melanica species groups). A Neotropical radiation, which comprises the repleta, canalinea, mesophragmatica, dreyfusi, annulimana and nannoptera species groups, evolved from
a third lineage of the Asiatic tropical ancestor.
The crown age for the Drosophila subgenus (and, therefore, the divergence of the two major lineages, the immigrans-tripunctata and virilis-repleta), is placed in the late Eocene, approximately 34 Mya [27, 40]. Other studies indicate that the major groups appeared during the Oligocene/Miocene transition or early Miocene [27].
8 Figure 3- Syntenic Relationships of the Chromosomal Arms of the Drosophila Species (adapted from flybase.org [6])
Furthermore, the genus Drosophila varies considerably in their morphology, ecology, and behavior [41]. From an ecological point of view, the members of the subgenus Drosophila occupy a wide variety of niches, from sap feeders (e.g. robusta, melanica and virilis) to cactophilic species (e.g. repleta), mycophagous (e.g. quinaria) and flower feeders (e.g. tripunctata) [37, 38], although many of the species are generalists and can exploit different resources.
Colonization of new geographic regions and new ecological resources can result in rapid species diversification into the new ecological niches available, a phenomenon that seems to have shaped the evolution of Drosophila genus. Members of the subgenus Drosophila are distributed across the globe [27], spanning a wide range of global distributions, the 12 original sequenced species [25] originate from Africa, Asia, the Americas, the Pacific Islands and also cosmopolitan species have colonized the planet (D. melanogaster and D. simulans) as well as closely related species that live on single islands (D. sechellia) [42]. A variety of behavioral strategies is also encompassed by the sequenced species, ranging in feeding habit from generalist such as D.
ananassae, to specialist such as D. sechellia, which feeds on the fruit of a single plant species.
Furthermore, Drosophila species vary in their number of chromosomes and arrangements. There are six fundamental chromosome arms common to all species, referred to as ‘Muller elements’, and named from A to F. Although most pairs of orthologous genes are found on the same Muller element, there is gene shuffling within Muller elements between diverged genomes (Fig. 3). Moreover, inversions seem to have played important roles in the process of speciation in at least some taxa [43].
Despite this wealth of diversity, Drosophila species share a distinctive body plan and life cycle [25].
9
I.4. The virilis Group of Species
I.4.1. virilis Group Main Characteristics
The virilis group of Drosophila is of special interest because it comprises many closely related species with different phenotypic traits evolving for a relatively short period. The species group provides a good model for analyzing the genetic basis of morphological differences [26, 44, 45] being one of the best-studied species groups in the subgenus Drosophila.
In total, the virilis group comprises 12 closely related species, separated in two main phylads,
montana and virilis. The virilis phylad—includes D. virilis, D. lummei, D. novamexicana, and D. americana [26]. There are distinct differences in chromosome number and shape, overall ecology,
morphology, and geographic range. The group has a wide geographic range stretching from the tropics to the northern taiga in both Old and New Worlds, comprising species living in deserts, in the tropics, on chains of volcanic islands and commensally with humans. Larvae of these fruit flies develop in rotting wood, mainly that of deciduous trees of the genus Salix. Gross morphological differences among these taxa are minimal, except for differences in the structure of the male genitalia [46]. The group exhibits a series of chromosomal rearrangements, and the resulting differences among karyotypes were primary characters originally used to define taxa within the group [47]. Chromosomal changes consisting of centromeric fusions and inversions are prevalent. Several chromosomal forms such as D. novamexicana and D. americana apparently arose through dispersal of an ancestral lineage into North America [47-49].
One striking difference in the virilis group of species is the pupal case color [50]. All members of the group have brown puparia, except for D. virilis who has black puparia that are easily distinguished in early pupal development. Furthermore, this trait is not entirely fixed across the species, the intensity of the black color varies between different strains and is affected by crowding and culture conditions [50-52]. A single genomic interval (11 kb) on chromosome 5 was identified as the cause of the pupal case color difference. This region contains only the first exon and regulatory region of a single D. virilis gene, GJ20215, which is the homolog of the D.
melanogaster dopamine N-acetyltransferase (Dat), an enzyme known to act in the pigmentation
pathway. It seems that reduced expression of Dat in early pupal development in D. virilis is the cause of dark pupae in this species [52]. Dat is among a few other genes identified in Drosophila (e.g. [53-55]) that by themselves can cause striking phenotypic differences in closely related species [52].
Regardless of the observed differences, many species can cross with one another at least in one direction and produce partly fertile offspring [56].
10
I.4.2. Phylogenetic Relationships in the virilis Genus
Several studies have examined the taxonomy, phylogenetic history and reproductive incompatibilities among members of this group [47, 52, 57-69].
It seems that interspecific hybridization has significantly contributed to the evolutionary history of the virilis species group [56].
Using a set of 48 polymorphic microsatellites derived from D. virilis to infer phylogenetic relationships in the virilis clade, the results were consistent with previous studies, showing D.
virilis and D. lummei as the most basal species of the group [70]. D. lummei is sister to the North
American members of this subgroup. Both D. virilis and D. lummei are Palearctic endemics [64].
D. virilis being endemic to middle latitudes in Asia and D. lummei occurring at higher latitudes
[64]. Moreover, the division between D. lummei and the North American complex of D.
novamexicana and D. americana apparently represents the dispersal of the virilis subgroup into
the Nearctic region. Fly lines of the virilis subgroup originating from North America, D.
novamexicana and D. americana, form a strongly supported monophyletic group of closely
related sequences [47]. The emergence of an ancestral lineage in North America through a common ancestor with D. lummei is consistent with dispersal through a Beringian corridor. Several chromosomal inversions originated in the common ancestor are currently polymorphic in both D. lummei and D. americana [64], which suggests their ancestral population was well connected and that both lineages have maintained historically large effective sizes [47].
I.4.3. D. virilis
Besides pupal case color, D. virilis differs from other species of the virilis group in that inversion chromosome polymorphism is absent in its natural populations. Analysis of the nucleotide sequences of different gene families invariably leads to the conclusion that D. virilis is an ancient species which was one of the first to diverge from the common ancestor of the group several million years ago [56, 68, 71-72]. The hypothetical place of origin of D. virilis is in Southeast Asia [56, 73].
11
I.4.4. D. virilis and D. americana Relationship
D. virilis and D. americana, are two species of special interest because, among other reasons,
they can be crossed easily and yield hybrids which are partially fertile [74]. D. virilis has been diverging from D. americana for approximately 4.1 My [26, 60]. This two sub-species differ in gene alignment, in the chromosome configuration of the ganglion cells, in phenotypic appearance, and physiological characteristics. D. americana has a much larger eye, with finer eye pile, broader carina, overall darker body color, heavier cloud on posterior cross-vein and a more fusiform body [75].
I.4.5. D. americana
D. americana is a member of the virilis subgroup of Drosophila and is closely related to
D, virilis [68]. D. americana and D. melanogaster have been diverging for about 40My [1, 27].
70.2% of the annotated D. melanogaster proteins have a hit in D. americana genomes (15,308 hits; Table 1). When using the same approach, 84.1% of the annotated D. melanogaster proteins have a hit in the D. virilis genome (18,934 hits; Table 1), but this likely reflects differences in genome coverage [76]. Its ecology means that it is less likely to have been disturbed by human activities than species such as D. melanogaster and D. simulans [77]. D. americana is native to the United States where it has been independently evolving for approximately 1 Myr [26, 47, 78]. This species is widely distributed, across the Central and Eastern regions of the United States from the South (Texas to the states around the Gulf of Mexico) to the North of the country (from Montana to Maine) [73]. This species can be easily collected along the margins of marshes, lakes, and rivers, especially those where there is a high density of Salix species [64], and in recent years, several articles were published using hundreds of wild-caught D. americana individuals from different populations and strains [26, 79-82].
D. americana is an excellent species for comparative studies on the molecular basis of
phenotypic variation [1, 26]. Besides D. virilis, this species can also be crossed with D.
novamexicana. D. americana is thought to present a large amount of genotypic variation, low
levels of population structure and a stable historical population size [26, 78, 83]. The inferred D.
12
I.4.6. D. novamexicana and D. americana Relationship
D. novamexicana is another member of the virilis group of species, that is very closely
related with D. americana, however, they appear to be different in their evolutionary histories. Results show that D. americana has had a large, stable population and there is no evidence that indicates any recent significant reduction in population size. Conversely, there is evidence in the results for a reduced ancestral population size in D. novamexicana. The findings are consistent with a recent cladogenesis event of D. novamexicana and D. americana. Furthermore, D.
novamexicana as a population is significantly differentiated relative to D. americana [66, 84]. D. americana inhabiting the Central and Eastern regions from the South (Texas to the states around
the Gulf of Mexico) (Fig.4) to the North of the country (from Montana to Maine), while D.
novamexicana has a more restricted distribution in the Southwest (New Mexico, Arizona,
Colorado and Eastern Utah) (Fig.5) [73]. The age of divergence between these two species was estimated to be 0.866 My and 0.266 My for fused1 and lim3, respectively, with one method. Estimated 0.388 My with Stephens et al. (1985) [85] method and 0.380 My by Caletka et al. (2004) [47]. Furthermore, other lines of evidence support the recent age of these species such as the estimated age for the inversion Xc, 0.308 My, Vieira et al. (2006) [86]. The divergence time seems to be around 0.40 My, considering the several lines of work and different approaches taken into aging the divergence of this two species. Maintenance of the ancestral karyotype in D.
novamexicana contrasts distinctly with the occurrence of two centromeric fusions in D. americana. The restricted geographical location of D. novamexicana to the western slopes of the
Rocky Mountains suggests that D. novamexicana evolved from a marginal, peripheral population of the D. americana/D. novamexicana ancestral species. The mid to late-Pleistocene is a period characterized by pluvial–interpluvial cycles in Southwest North America that have influenced the evolution and diversification of many North American species [87-88]. Thus, the effect of the pluvial–interpluvial period of the Pleistocene appears to be restricted to the most Southwestern population of the ancestral species. It is also evident that D. novamexicana evolved in complete isolation from D. americana since there is no conclusive evidence for introgression of D.
americana alleles [89].
Figure 4- Geographical location of D. americana, found east of the Rocky Mountains, a major mountain range in western North America (adapted from [90])
13 Figure 5 - Geographical location of D. novamexicana, found in sparse populations confined to the southwestern desert of the United
States, around Arizona and New Mexico (adapted from [90])
The two species differ in their karyotype; D. americana has a fixed fusion of chromosomes 2 and 3 while D. novamexicana retained the ancestral karyotype where chromosomes 2 and 3 are unfused [75, 91]. There are also further karyotype differences between the two species in the frequency of some polymorphic chromosomal inversions. Interestingly, there are populations of D. americana that have chromosomal rearrangements in common with
D. novamexicana while other populations of D. americana show the alternative arrangement [1,
92-94].
However, one of the most easily recognizable differences between D. americana and D.
novamexicana is the pigmentation pattern. It is striking how such closely related species differ so
greatly on such an important phenotypic trait. Adults of D. novamexicana differ in color from their sister species as they have evolved a light brown color pigmentation along the dorsal abdomen, head, and thorax, while all other members of the group are darkly pigmented [44, 93]. Furthermore, D. novamexicana also lacks pigment along the abdominal dorsal midline (Fig.6) [93, 95].
Figure 6 - Pigmentation differences in the virilis group of Drosophila. Estimated divergence times [47] are shown on the scale at the bottom (MY=millions years) (adapted from [95]).
Pigmentation differences in adult insects have been attributed to several selective pressures, including desiccation resistance, ultraviolet protection, thermal regulation, crypsis and sexual
14 selection [45, 96-100]. Selection on pigmentation phenotypes may also be indirectly caused by pleiotropic genes in the pigmentation pathway, affecting a number of traits [101-102]. Previous works have shown that ebony plays a major role in the pigment difference [93] and that tan also contributes [102], the two genes account for nearly 87% of the pigmentation difference [95, 104]. Abdominal expression of the Ebony protein is higher in D. novamexicana than in the darker
D.americana, consistent with its ability to inhibit melanization [93].
Furthermore, pigmentation has emerged as a model trait for evolutionary and developmental analysis that is particularly amenable to molecular investigation in the genus Drosophila [103], because this genus combines the advantages of a well-developed model system with substantial phenotypic diversity. As previously mentioned, the availability of genetic tools in D.
melanogaster has increasingly helped elucidate several genetic and developmental mechanisms
15
I.5. Evolution in the Drosophila Genus
I.5.1. Overall Evolution
As one of the main goals of this project was to study genes showing signs of positive selection according to the bpositive online database [110] (http://bpositive.i3s.up.pt/), while also being involved in development, it is of special importance to understand how the genome is evolving in the Drosophila genus. Many studies have approached the evolutionary processes in Drosophila genomes across the phylogeny of species. The Drosophila 12 Genomes Consortium [25] has collected several analyses on how are the genomes and sequences evolving in the genus. Foremost, having multiple genomes in a phylogenetic framework improves dramatically the precision and sensitivity of evolutionary inference through comparative analysis, producing more robust results than single-genome analyses. The data gathered from the sequencing of the 12
Drosophila species genomes presented by the Drosophila 12 Genomes Consortium [25] illustrate
how rates and patterns of sequence divergence across taxa can enlighten evolutionary processes on a genomic scale. The several sequenced genomes of the Drosophila genus provide great statistical power to identify factors affecting rates of protein evolution.
Although the level of gene expression consistently seems to be a major determinant of variation in rates of evolution among proteins [111-112], studies have suggested that there are other factors playing a significant part [113-116]. The breadth of expression across tissues, gene essentiality, and intron number all independently correlate with rates of protein evolution, suggesting this are also important factors in modulating rates of protein evolution [117]. The presence of repetitive amino acid sequences seems to play a role too, non-repeat regions in proteins containing repeats evolve faster and show more evidence for positive selection than genes lacking repeats [118].
The evolutionary divergence spanned by the genus Drosophila exceeds that of the entire mammalian radiation when generation time is taken into account [25, 119].
Sackton et al. (2007) [120] studied 226 genes using data from the 12 sequenced
Drosophila species genomes and about 10% of the genes analyzed showed evidence of positive
16
I.5.2. GO Terms Evolution
In the Drosophila 12 Genomes Consortium study [25], several GO (Gene Ontology) terms were evaluated for rates of gain/loss. The most common terms with elevated rates of gain/loss include “defense response”, “protein binding”, “zinc ion binding”, “proteolysis”, and “trypsin activity”. Genes present in GO terms “defense response” and “proteolysis” also show high rates of protein evolution. Overall heterogeneity was observed in rates of gene gain and loss across lineages, suggesting that there is no lineage with an increase/decrease in gene gain and loss [122].
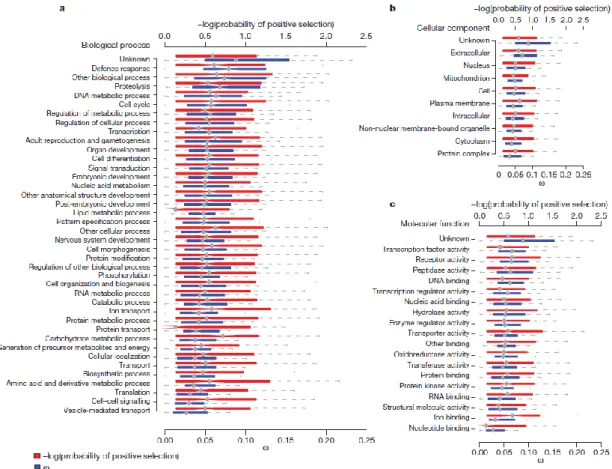
Figure 7- Patterns of constraint and positive selection among GO terms: a, biological process GO terms; b, cellular component GO terms; and c, molecular function GO term. Distribution of average ω per gene is shown and the negative log10 of the probability of
positive selection for the selected genes (adapted from [25]).
Most of the functional categories of genes are strongly constrained, with median estimates of ω=dN/dS (the ratio of non-synonymous to synonymous divergence) [123] much less than one, and functionally similar genes are similarly constrained. Moreover, highly expressed genes seem to evolve more slowly. 31.8% of GO categories have significantly lower variance in ω than expected (q-value true-positive test) [124]. Only 11% of GO categories had statistically significantly elevated ω (relative to the median of all genes with GO annotations) at a 5%
false-17 discovery rate (FDR), suggesting either positive selection or a reduction in the selective constraint. The GO categories showing elevated ω include the biological processes “defence response”, “proteolysis”, “DNA metabolic process” and “response to biotic stimulus”; the molecular functions “transcription factor activity”, “peptidase activity”, “receptor binding”, “odorant binding”, “DNA binding”, “receptor activity” and “G-protein-coupled receptor activity”; and the cellular location “extracellular” (Fig.7). When comparing dN (ratio of non-synonymous divergence) across GO categories similar results are obtained, which suggest that in most cases the observed differences in ω among GO categories are driven by amino acid rather than synonymous site substitutions. It is important to notice that the bias in the way biological function are assigned to genes leaves open the possibility that unannotated biological functions may have an important role in evolution. This evidence was backed up by observing that genes with characterized mutant alleles in flybase.org database [5] evolve significantly more slowly than other genes (median ω with alleles =0.0525 and ω without alleles =0.0701; MWU, P<1x10
-16) [25].
I.5.3. Categories Enriched with Genes Showing Signatures of Adaptive Evolution
There is considerable variation among different protein-coding genes in rates of evolution and patterns of positive selection. Broad functional classes do not seem to share patterns of positive selection, only a few GO categories show excesses of positive selection, although there are some categories who are enriched with genes that show signatures of adaptive evolution such as categories of genes who present interactions with the environment, in sex and reproduction, suggesting that adaptation to changing environments, and sexual selection, shape the evolution of some protein-coding genes [25].
Drosophila species have complex olfactory and gustatory systems used mainly to identify
food sources, hazards and mates, which depend on odorant-binding proteins, and olfactory (Ors) and gustatory receptors (Grs). The D. melanogaster genome has approximately 60 Ors, 60 Grs, and 50 odorant-binding protein genes. Although there is conservation of gene number across the 12 species, there is evidence that some Or and Gr genes experience positive selection [125-127].
D. sechellia and D. erecta, two independently evolved specialists, are losing Gr genes
approximately five times faster than generalist species [125, 128]. We can easily explain this with the knowledge that generalists are expected to encounter the most diverse set of tastants and because of this they have maintained the greatest diversity of Grs. Indeed, there is some evidence that the odorant-binding protein genes evolve significantly faster in specialists compared to generalists [126]. The observed difference between specialist and generalist ω for Or/Gr genes (0.0292) is significantly greater than the difference for genes across the whole genome (0.0091;
18 MWU, P=0.0052) [125], suggesting a change in selective regime. The observation that elevated ω affect groups of Or and Gr genes that respond to specific chemical ligands and are expressed during specific life stages, suggests that rapid evolution at Or/Gr loci in specialists is related to the ecological shifts these species have sustained [125].
Also interesting is the case of some detoxification/metabolism genes. The larval food sources for Drosophila species contain a significant amount of toxic compounds, consequently
Drosophila genomes encode a wide variety of detoxification proteins, which include members of
the cytochrome P450 (P450) and glutathione S-transferase (GST) multigene families, all of which are known to have critical roles in resistance to insecticides [129-131]. Among the P450s, the five enzymes associated with insecticide resistance are highly dynamic across the phylogeny, with 24 duplication events and 4 loss events since the last common ancestor of the genus, which is in striking contrast to genes with known developmental roles, eight of which are present as a single copy in all 12 species [25]. Specialists seem to lose detoxification genes at a faster rate than generalists (D. sechellia has lost the most P450 genes). And although metabolic enzymes, in general, are highly constrained (median ω=0.045 for enzymes, 0.066 for non-enzymes; MWU, P=5.7 x 10⁻²⁴), enzymes involved in xenobiotic metabolism evolve significantly faster than other enzymes (median ω=0.05 for the xenobiotic group versus ω=0.045 overall, two-tailed permutation test, P=0.0110) [25].
Drosophila, like all insects, possesses an innate immune system, with many components
analogous to the innate immune pathways of mammals although it lacks an antibody-mediated adaptive immune system [132]. Immune system genes evolve rapidly, as a response to selection pressures from pathogens and parasites [133-135]. In the Drosophila genus, immune system genes evolve more rapidly than non-immune genes. 29% of receptor genes involved in phagocytosis seem to evolve under positive selection, suggesting that the molecular interactions between Drosophila receptors genes and pathogen antigens are causing coevolution and adaptation in these genes. Only 5% of effector genes show evidence of adaptive evolution, compared to 10% of genes genome-wide. It seems, though, that effector genes evolve by rapid duplication and deletion. 49% of genes genome-wide, 63% of genes involved in pathogen recognition and 81% of genes implicated in immune-related signal transduction can be found as single copy orthologues in all 12 species, compared to only 40% of effector genes (x2=41.13, P=2.53 x 10⁻⁸). Much of the Drosophila immune system genes seems to be evolving rapidly,
although the mode of evolution varies across functional classes [25].
Genes encoding sex and reproduction-related proteins are another example of genes subject to a wide array of selective forces, including sexual conflict, sperm competition, cryptic female choice, and all these selective forces are believed to have led to a rapid evolution in these genes [136-138]. These authors [25] analyzed 2,505 sex and reproduction-related genes in the
19 evolve more rapidly at the protein level than genes not involved in sex or reproduction or than female sex and reproduction-related genes, which comes as an expected result considering the large number of selective forces verified in male flies. Furthermore, genes involved in spermatogenesis have significantly stronger evidence for positive selection than non-spermatogenesis genes (permutation test, P=0.0053), genes that encode components of seminal fluid have significantly stronger evidence for positive selection than ‘non-sex’ genes [139]. It seems that these selective forces shape the evolution of genomes.
Genes involved in development processes are expected to be under strong negative selection [140]. There is a common generalization of development conservation among related species, with the early development stages being the most refractory to change. Moreover, studies on positive selection in genes related to development are very rare. However, there are positively selected genes found in all embryonic stages, even during the periods who show the highest constraint. Indeed, even in functional groups of genes evolving under strong negative selection such as development, there are many genes showing evidence of positive selection at the amino acid level [140].
I.5.4. The Evolution of Different Genomic Elements
Several genomic elements are evolving at different rates. Here on we mention some of the most important genomic elements in the Drosophila genus and how are they evolving.
Gene families expand or contract at a rate of 0.0012 gains and losses per gene per million years, or one fixed gene gain/loss across the genome every 60,000 yr [122]. 342 gene families showed significantly elevated rates of gene gain and loss compared to the genomic average, indicating that non-neutral processes may play a part in gene family evolution [25].
Drosophila cis-regulatory DNA sequences are highly constrained as expected [141-142], with
mean constraint within modules as 0.643 (95% bootstrap confidence interval =0.621–0.662) and within footprints 0.692 (0.655–0.723), both of which are significantly higher than mean constraint in coding DNA overall 0.555 (0.546–0.563) and significantly lower than constraint at non-degenerate coding sites 0.862 (0.856–0.868) and ncRNA genes 0.864 (0.846–0.880). Further evidencing that transcription factor binding sites tend to be found in larger blocks of constraint that cluster to form cis-regulatory modules [143].
Most of the miRNAs are highly conserved within the Drosophila genus. For 71 previously described miRNA genes inferred to be present in the common ancestor of these 12 species, mature miRNA sequences are nearly invariant. Inside the mature miRNA, unpaired sites evolve more slowly than paired sites, whereas the opposite is true for the sequence complementary to the mature miRNA. However, it’s interesting to notice that outside the mature miRNA and its
20 complementary sequence, loops had the highest rate of evolution, followed by unpaired sites, with paired sites having the lowest rate of evolution. A large fraction of unpaired bulges or internal loops in the mature miRNA seem to be conserved. It seems that miRNA genes are considerably more conserved than protein-coding genes. The few substitutions that occur have compensatory changes that maintain the average estimated free energy of the folding structures across the phylogeny [25].
In the mitochondrial genome, functional elements in mtDNA (mitochondrial DNA) are strongly conserved. As expected, tRNAs are relatively more conserved than the mtDNA overall (average pairwise nucleotide distance=0.055 substitutions per site for tRNAs versus 0.125 substitutions per site overall). There is a deficit of substitutions in the stem regions of the stem-loop structure of tRNAs, explained in the light of a strong selective pressure to maintain RNA secondary structure [25].
I.5.5. Positive Selection
Previous works have suggested that a substantial fraction of non-synonymous substitutions in Drosophila were fixed through positive selection [144-148]. Estimated 33.1% of single-copy orthologues in the melanogaster group have experienced positive selection on at least a subset of codons (q-value true-positive tests) [124]. Thus, several lines of evidence, based on different methodologies, suggest that patterns of amino acid fixation in Drosophila genomes have been shaped extensively by positive selection. Among genes inferred to be evolving by positive selection at a 10% FDR, 63.7% (q-value true-positive tests [124]) show evidence for spatial clustering of positively selected codons. In addition to being more constrained, codons in protein domains are less likely to be targets of positive selection [25].
D. melanogaster-specific positive selection has been detected in the past. This could be
related to the ‘out of Africa’ population expansion that occurred approximately 10 000 years ago [149]. D. melanogaster expanded from sub-Saharan Africa and colonized other regions of the world and during this expansion it may have come into contact with new pathogens to which the species had to adapt.
Furthermore, many investigators believe that it is very likely that the suggested 10% figure of genes being under positive selection [120] is an underestimation [121].
![Figure 1 - Phylogram of the 12 sequenced species of Drosophila, derived using pairwise genomic mutation distances and the neighbor-joining method (adapted from [25])](https://thumb-eu.123doks.com/thumbv2/123dok_br/14929598.1000944/26.892.271.683.588.843/figure-phylogram-sequenced-drosophila-pairwise-mutation-distances-neighbor.webp)
![Figure 2- Number of gene models in 12 Drosophila genomes that fall into one of the five mentioned homology classes (adapted from [25], see for further details)](https://thumb-eu.123doks.com/thumbv2/123dok_br/14929598.1000944/27.892.279.615.910.1090/figure-number-drosophila-genomes-mentioned-homology-classes-adapted.webp)
![Table 1- A summary of annotated features across all 12 sequenced genomes (adapted from [25])](https://thumb-eu.123doks.com/thumbv2/123dok_br/14929598.1000944/28.892.161.772.140.321/table-summary-annotated-features-sequenced-genomes-adapted.webp)
![Figure 3- Syntenic Relationships of the Chromosomal Arms of the Drosophila Species (adapted from flybase.org [6])](https://thumb-eu.123doks.com/thumbv2/123dok_br/14929598.1000944/30.892.202.734.110.393/figure-syntenic-relationships-chromosomal-drosophila-species-adapted-flybase.webp)
![Figure 4- Geographical location of D. americana, found east of the Rocky Mountains, a major mountain range in western North America (adapted from [90])](https://thumb-eu.123doks.com/thumbv2/123dok_br/14929598.1000944/34.892.311.628.974.1101/figure-geographical-location-americana-mountains-mountain-western-america.webp)
![Figure 6 - Pigmentation differences in the virilis group of Drosophila. Estimated divergence times [47] are shown on the scale at the bottom (MY=millions years) (adapted from [95])](https://thumb-eu.123doks.com/thumbv2/123dok_br/14929598.1000944/35.892.307.632.749.1006/figure-pigmentation-differences-virilis-drosophila-estimated-divergence-millions.webp)