Shock Simulation of the Optics Mirror Assembly By
Numerical Method
Mr. Brijeshkumar Patel
1, Mr. Vipulkumar Vasava
2, Dr. Mayur Sutaria
3 1,2Assistant Professor, Ipcowala Institute of Engineering & Technology- Dharmaj, Gujarat, India.
3
Associate Professor, Charotar University of Science and Technology (CHARUSAT)-Changa, India
ABSTRACT
Satellite faces many extreme types of loading throughout their life time from the harsh launch environment to the critical space environment. Launch load mainly dynamic is the main design concern for space structure. Shocks are the one of the most critical dynamic load occurs in spacecraft. Optics Mirror Assembly (OMA) is used in the telescope of the satellite. The telescope performance relies on dimensional control & the geometric positioning of the mirror, pointing accuracy and controlled surface deformation of the mirror; Mirror fixation device (MFD) is used for controlling all these factors. It should not distort due to launch loads mainly shocks as well as loads during operation of the telescope. In the present work an attempt has been made to perform experimental and computational analysis of the shock load on Optics Mirror Assembly.
The FE modal for Shock Analysis purpose has been analysed with a specific Linear Transient Response Analysis in order to obtain the time history of acceleration in several output points. The analysis has been conducted over the time interval 0 to 62 ms and frequency band between 10 - 10 KHz. In order to verify the feasibility and reliability of the numerical (Implicit Finite Element Code, Nastran) analysis, the numerical results obtained by Nastran have been compared with those obtained experimentally in the form of SRS. The overall outcome of the simulation method has proven its reliability in simulating Satellite payloads subjected to shocks.
KEYWORDS
: Shock; Implicit Transient Response analysis; Optics Mirror Assembly;I.
INTRODUCTION
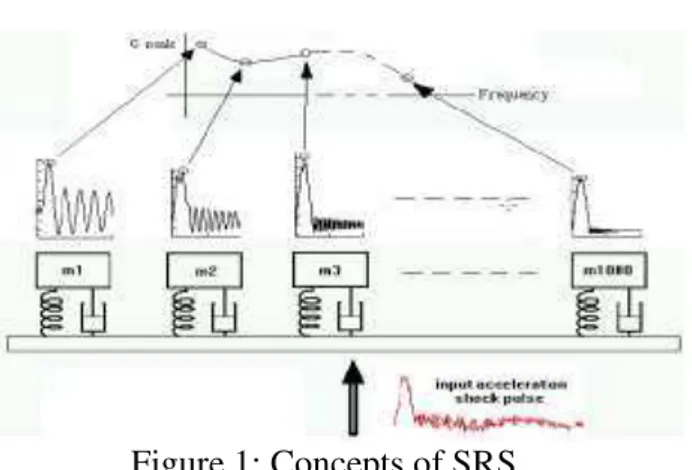
Shock loads are generally not simple time base pulse such as half sine pulse and square waves. Rather, they are complex very short duration wave form as a result of the rapid transfer of energy from the pyrotechnic in the surrounding structure. Shock Response Spectrum (SRS) [1-14] is the tool for the representation of the shock pulse from time domain in to the frequency domain. It is the most commonly used and main standard shock environmental qualification requirements used in the space industry. Shock response spectrum is a measure of the maximum response of an array of single degree of freedom systems when their base is excited by a certain transient pulse as presented in figure 1.
The amplitude of the maximum acceleration response can be calculated by considering all the independent systems separately with constant damping value (5% critical damping) [1-4].
Figure 1: Concepts of SRS
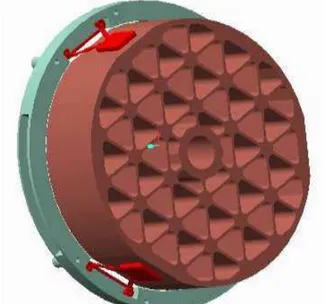
OMA is one of the on-board Payload for Imaging Satellite as shown in figure 2. The OMA consists of top mirror, MFDs and mounting ring. MFD is having two blades and one pad, pad is glued to the mirror. Blade’s Geometry decides the directional stiffness of MFD. The main functional objective of the MFD is to provide flexibility in the radial dimension of the mirror at fixing, which permits in-plane thermal expansion of the mirror. MFD is stiffer in the other two directions which avoids mirror movement in those two directions, and in turn improve the natural frequency as well as reduce dynamic strain at the most critical location of the MFDs. This behavior provides Isostatic
mounting. This peculiar behavior is obtained by providing notch (thin section) in two perpendicular directions as shown in figure 3.
The OMA must withstand a series of shocks at those critical locations such as optical element mirror and MFD notch section. These high frequency pulses result from pyrotechnics devices during their lifetime like the separation of structural subsystems (e.g. booster, fairing or stage separation, clamp band release), the release of deployable appendages (e.g. solar panels or antenna) and the activation of on-board operational subsystems (e.g. propellant valves). These devices produce high frequency and high amplitude shock energy as a by-product. The payload must survive these shock pulses and thus it is very decisive to know the dynamic behavior of the OMA for these shocks.
Figure 2: CAD modal of the optics mirror
assembly
Figure 3: Detail view of notch section of the
MFD
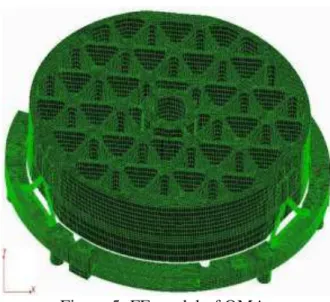
The CAD modal of OMA was generated in the .iges file format. Finite Element Mesh was generated using Hypermesh; properties, loads and constrains were applied in MSC Patran; and finally it is solved using MSC Nastran.
II.
SHOCK RESPONSE SPECTRUM
SPECIFICATION
The SRS specification for OMA payload as per Environmental Test Level Specifications is given in table-1 (-6dB of Qualification level).
Table 1:
Shock response spectrum
specification
Frequency (Hz) SRS (g)
100-300 15dB/Octave
300-5000 150 (X and Y axis)
5000-10000 -6dB/Octave
SRS is converted into a time domain signal by synthesizing using vibration controller software. Synthesized time domain signal corresponding to above SRS is shown in figure. 4, used as input in the numerical analysis as well as shock test.
Figure-4: Time domain input corresponding
to SRS
III.
NUMERICAL SHOCK ANALYSIS
Numerical Shock Analysis of the OMA is carried out using Implicit Finite Element Method [15-20].3.1LINEAR TRANSIENT RESPONSE ANALYSIS
Far field structure shock problems are based on structural response and wave propagation theory and can be solved by an implicit finite element method.
Figure 5: FE modal of OMA
Table-2: Material properties of the OMA
Material Comp.
Young Modulus (N/m2)
Poisson ration
Density (N/m2)
Invar MFDs Ring
1.45
E+11 0.3 8100
Zerodur Mirror
0.91
E+11 0.24 2530
3.2 SELECTION OF PARAMETERS
The following parameters need to consider in the implicit transient response analysis using Nastran are as follows:
= Analysis time step
C = Velocity of the sound through structure = Minimum element length
= Duration of the pulse
= Fundamental period of the structure
= Length of the finite element in the direction of shock load
= Dynamic magnification factor
� = Critical damping factor
1. Time steps are decided based on a beloved criteria.
C………. (1)
It can be seen from above equation (1) that the time step depends on minimum element length , modulus of elasticity and density . Total calculation time (CPU time) directly depends on the time step size for each iteration. To have faster calculation time steps must be larger, but also has to satisfy the equation (1) condition.
2. should be small enough to satisfy the requirements of finite element analysis. These
requirements differ from element to element. The finer the finite element mesh gives good results of capturing all natural modes of the structure.
3. This is subject to the definition of input shock pulse.
4. � and (�=1/2 ) are the most critical parameters and direct related to responses at resonance frequencies. The actual values of them can only know after experimental.
Using all above parameters, Shock response analysis performed for X and Y axis, which are the critical axis of the OMA structure using implicit transient response analysis and output from MSC Nastran converted into the time domain to SRS by using Kelly-Richman algorithm and Smallwood algorithm (MATLAB code) [23-25].
IV.
EXPERIMENTAL SHOCK TEST
Shock test was performed on OMA with application of the electrodynamic shaker with time domain input. Shock pulse is given at the base of the OMA which is mounted on the shaker fixture with six bolted joints and shock will go through that joint. The response measured in terms of acceleration in time domain measured at critical locations such as MFD thin section and on top of mirror. Piezoelectric accelerometer location during the shock test is shown in figure.6.Figure 6 Shock test setup with accelerometer
locations
shock response spectrum (SRS) response based on accelerometer placement on MFD thin section during X and Y testing and transient response analysis axis respectively.
Figure 7: Results SRS along the x-axis on
the MFD thin section
Figure 8: Results SRS along the y-axis on
the MFD thin section
Figure 9: Results SRS along the x-axis on
the mirror top
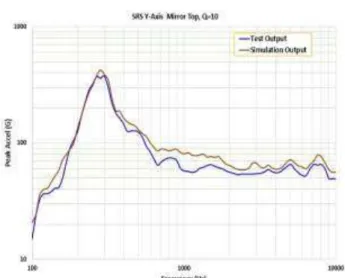
Figure 10: Results SRS along the y-axis on
the mirror top
The SRS diagrams (Figs. 9-10) are referred to the accelerometer placed at mirror top during X and Y testing and analysis axis respectively.
V.
CONCLUSIONS
It can be noted the numerical and experimental results in some cases reach a sufficiently good agreement.
It can be assessed that by taking into account critical parameters such as minimum size of the element, time steps for analysis and damping in the numerical analysis of optics mirror assembly can produce results with a sufficiently good approximation with experimental results, allowing one to conclude that the proposed numerical analysis can be considered a reliable, fast and economical method to obtain realistic predictions of the structural behaviour subject to the shocks.
VI.
ACKNOWLEDGEMENTS
The authors would like to acknowledge the contribution of the vibration test facility team, for their contribution during an experimental shock test of OMA and the useful suggestions from vibration team.REFERENCES
[1] S. Rubin, Concepts in Shock Data Analysis, in: C. M. Harris (Ed.), Shock and Vibration Handbook, third ed., McGraw-Hill, New York, 1988.
[2] S. Himelblau, A. G. Piersol, J. H. Wise, M. R. Grundvig, Handbook for Dynamic Data Acquisition and Analysis, Institute of Environmental Science, 1994.
[4] B. Hollywell, S. Smith, ‘A proposed method to standardize Shock Response Spectrum
Analysis,’ IES, May/June 1996.
[5] De Benedetti, M. Garofalo, G. Zumpano and M. Barboni, ‘On the damping effect due to bolted junctions in space structure subjected to pyro shock,’ Acta Astronautica, Vol. 60, pp 947-956, 2007.
[6] R.S. Ayre, Transient response to step and pulse function, in: C. M. Harris (Ed.), Shock and Vibration Handbook, third ed., McGraw-Hill, New York, 1988.
[7] M. Sutra, D. Mesnier, A. Berlioz, B. Combes ‘ Development of a simulation process of the behaviour of space equipment subjected to pyrotechnic shocks, based on
characterization and environment tests’,
ESA, pp.243, 2005.
[8] J. E. Alexander, ‘Shock Response Spectrum- a Primer,’ sound and vibration, pp 6-14, 2004.
[9] P. L Walter, ‘Guidance for Measuring
Mechanical Shock and Vibration.’ IMAC,
Feb-2009.
[10] Christain Lalanne, Mechanical Shock,
volume 2, John Willy and sons’ Inc. 2009.
[11] Pyroshock Testing Criteria NASA Technical Standard, NASA-STD-7003, Space Administration, May-1999.
[12] MIL-STD-810G. Environmental Engineering Consideration & laboratory Tests. Oct 2008.
[13] Steinberg (1988), Vibration Analysis for Electronic Equipment, John Wiley & Sons. [14] Somnath S, Krishnan Kutty, V. K, Francis
E. J, ‘Dynamic simulation of pyro actuated
‘Ball Lock’ separation for micro-satellite to
evaluate release shock’ ESM&TS 2001.pp.
199.
[15] Dr. M. M. Moharir, Shock wave propagation and Nastran linear algorithms, MSC Nastran user conference, Pasadena, California, March 20-21, 1986.
[16] Robert D. Cook, David S. Malkus, Michael E. Plesha, Robert J. Witt, Concepts and Application of Finite Elements Analysis,
Fourth Edition John Willy and sons’ Inc.
2004.
[17] S. Ham and K. J. Bathe. ‘A finite element
enriched for wave prorogation problems,’
computers and Structures, 94-95, 1-12, 2012.
[18] MSC Basic Dynamic Use Guide, 2012 [19] MSC Advanced Dynamic User Guide, 2012 [20] K.J Bathe and G. Noh. ‘Insight into an
implicit time integration,’ Int. J of Impact Engineering, 42, 80-88, 2012.
[21] Nitin S Gokhale, Sanjay S Deshpande, Sanjeev V Bedekar, Anand N Thite : Practical Finite Element Analysis, Published by Finite to Infinite, 2008.
[22] G. Noh, S. Ham and K. J. Bathe,
‘Performance of an implicit time integration scheme in the analysis of wave
propagation,’ Computer and Structures, 129,
93-105, 2013.
[23] Kelly R.D., Richman G. ‘Principal and
Techniques of Shock Data Analysis,’ the
Shock and Vibration Information Centre. Washington D.C, 1969.
[24] Smallwood D. O. An improved Recursive formula for calculating SRS. Shock and Vibration Bulletin: Proceeding of the 51st symposium on shock and vibration, San Diego, California, 1980.