R E S E A R C H PA P E R
Are species–area relationships from
entire archipelagos congruent with
those of their constituent islands?
geb_536527..540 Ana M. C. Santos1,2*, Robert J. Whittaker3, Kostas A. Triantis2,3, Paulo A. V. Borges2, Owen R. Jones1, Donald L. J. Quicke1,4,5and Joaquín Hortal41Department of Biology, Imperial College
London, Silwood Park Campus, Ascot, Berkshire SL5 7PY, UK,2Universidade dos
Açores, Dep. de Ciências Agrárias – CITA-A (Azorean Biodiversity Group), Terra-Chã, 9700-851 Angra do Heroísmo, Portugal,
3Biodiversity Research Group, Oxford
University Centre for the Environment, South Parks Road, Oxford OX1 3QY, UK,4NERC
Centre for Population Biology, Imperial College London, Silwood Park Campus, Ascot, Berkshire SL5 7PY, UK,5Department of
Entomology, Natural History Museum, Cromwell Road, London SW7 5BD, UK
A B S T R A C T
Aim To establish the extent to which archipelagos follow the same species–area
relationship as their constituent islands and to explore the factors that may explain departures from the relationship.
Location Thirty-eight archipelagos distributed worldwide.
Methods We used ninety-seven published datasets to create island species–area
relationships (ISARs) using the Arrhenius logarithmic form of the power model. Observed and predicted species richness of an archipelago and of each of its islands were used to calculate two indices that determined whether the archipelago fol-lowed the ISAR. Archipelagic residuals (ArcRes) were calculated as the residual of the prediction provided by the ISAR using the total area of the archipelago, stan-dardized by the total richness observed in the archipelago. We also tested whether any characteristic of the archipelago (geological origin and isolation) and/or taxon accounts for whether an archipelago fits into the ISAR or not. Finally, we explored the relationship between ArcRes and two metrics of nestedness.
Results The archipelago was close to the ISAR of its constituent islands in most of
the cases analysed. Exceptions arose for archipelagos where (i) the slopes of the ISAR are low, (ii) observed species richness is higher than expected by the ISAR and/or (iii) distance to the mainland is small. The archipelago’s geological origin was also important; a higher percentage of oceanic archipelagos fit into their ISAR than continental ones. ArcRes indicated that the ISAR underpredicts archipelagic richness in the least isolated archipelagos. Different types of taxon showed no differences in ArcRes. Nestedness and ArcRes appear to be related, although the form of the relationship varies between metrics.
Main conclusions Archipelagos, as a rule, follow the same ISAR as their
con-stituent islands. Therefore, they can be used as distinct units themselves in large-scale biogeographical and macroecological studies. Departure from the ISAR can be used as a crude indicator of richness-ordered nestedness, responsive to factors such as isolation, environmental heterogeneity, number and age of islands.
Keywords
Archipelagic residuals, archipelagos, geological origin, island biogeography, island species–area relationship, isolation, macroecology, nestedness, power model, z-values.
*Correspondence: Ana M. C. Santos, Department of Biology, Imperial College London, Silwood Park Campus, Ascot, Berkshire SL5 7PY, UK.
E-mail: [email protected]
I N T R O D U C T I O N
The species–area relationship is one of the most studied patterns in ecology, often being referred to as one of ecology’s few laws (Schoener, 1976; Rosenzweig, 1995, 2003; Lawton, 1996, 1999). According to this ‘rule’, the number of species increases with area, and the rate of increase of species richness usually declines as area increases. There are a number of classifications for the different types of species–area relationships, depending on the scale at which they are analysed or whether they are measured from nested areas or not (e.g. Rosenzweig, 2003; Scheiner, 2003; Gray et al., 2004; Whittaker & Fernández-Palacios, 2007; Dengler, 2009). Rosenzweig (1995) described three main scales (and types) of species–area relationships (four, if the point scale, which depends on sampling effort, is included), that correspond to different spatial/temporal scales. Following Whittaker & Fernández-Palacios (2007) we may describe them as: (1) archi-pelagic (or island species–area relationship), which is the species–area relationship within a group of islands; (2) intra-provincial (or regional species accumulation curve), which is a species accumulation curve within a large continental area on a regional scale; and (3) inter-provincial, which encompasses dif-ferent biotic regions (see also Rosenzweig, 2004; Triantis et al., 2008a). In the present work we focus on the archipelagic- or island-scale species–area relationship, henceforth termed the ISAR.
The form and slope of ISARs depend on the particular pro-cess(es) that dominate(s) the study system (immigration, spe-ciation and extinction) (Rosenzweig, 1995; see also MacArthur & Wilson, 1963, 1967; Triantis et al., 2008a; Whittaker et al., 2008; Borges & Hortal, 2009). Some archipelagos (e.g. Hawaii, Galápagos, Azores) are sufficiently isolated, in space or time, to host a distinctive (‘disharmonic’) species pool, often drawn from more than one source region but with many shared elements (e.g. species or lineages) among the islands of the archipelago. The small number of colonization events, a characteristic of isolated archipelagos, creates homogeneity in the species colonizing these islands, which could imply that the processes establishing island species richness would largely be a property of the archipelago rather than of each constituent island on its own. Consequently each archipelago – or at least each remote archipelago – may be regarded as a unique entity similar to a province (Triantis et al., 2008a), regardless of the particularities of each island (see discussion in Whittaker et al., 2008). The homogeneity in the processes that build up island biotas would only be broken in cases where local (i.e. within-island) idiosyncratic processes are predominant or the archi-pelago is composed by different subsets of islands that draw their components from significantly different species pools.
Regional factors acting on the whole of the archipelago (such as archipelago isolation, age, origin of the islands) are generally thought to have a consistent effect on the local patterns of diver-sity at the island level. Therefore, archipelagos are usually con-sidered to be homogeneous entities, and it is thus not surprising that many authors have used complete archipelagos as single data points in their analyses (e.g. Wilson, 1961; Scott, 1972;
Schoener, 1976; Wright, 1983; Adler, 1992, 1994; Adler & Dudley, 1994; Adler et al., 1995; Biber, 2002; Carvajal & Adler, 2005; Hamilton et al., 2009). In fact, in his discussion of the so-called ‘single large or several small’ debate on the implications of island theory for reserve design, Rosenzweig (1995, p. 382) argued that ‘the diversity and the area of whole archipelagos falls in the same species–area curve as the separate islands that constitute them’, although stating that this hypothesis deserves further examina-tion. However, formal tests of the assumption that archipelagos act as homogeneous entities in biogeographical terms are lacking. Should this assumption be rejected, either local ecologi-cal factors or the particular characteristics of the group studied (e.g. life-history traits, physiological adaptations) would pre-dominate over classical island biogeography processes, challeng-ing the universality of regional processes as the main factor shaping the diversity of island biotas.
Here, we evaluate whether entire archipelagos follow the same species–area relationship as that defined by their constituent islands. That is, we assess to what extent the total richness of the archipelago departs from the extrapolation of the ISAR to the total area of the islands that compose it. By implication we therefore test the assumption that archipelagos act as single entities in biogeographical terms, and hence the reliability of using them as single units in large-scale biogeographical and macroecological studies. We then evaluate our findings with regard to the type of taxon (invertebrates, vertebrates and plants), the geological origin (continental or oceanic) and iso-lation (distance to the mainland) of each archipelago, and the possible biological interpretation of departures of the archi-pelago data point from the ISAR, including its relationship with the nestedness of island biotas.
M E T H O D S
Information on the species richness on islands was compiled from several sources for 97 archipelago/taxon combinations, pertaining to 38 island groups distributed worldwide (Appen-dix 1). Our data include archipelagos of oceanic (i.e. both true oceanic islands and continental fragments sensu Whittaker & Fernández-Palacios, 2007, following Wallace, 1902), mixed, and continental origin and of varying size and degree of isolation from the closest mainland, and comprise data on several groups of vertebrates, invertebrates and plants. We excluded introduced species and subspecific taxa from all datasets. Total species rich-ness for each archipelago was obtained by pooling the species lists of their constituent islands. We use the term ‘ISAR’ to refer to the species–area relationship constructed from the islands that constitute the archipelago (following Whittaker & Fernández-Palacios, 2007). We also use ‘archipelagic point’ to refer to the total area and richness of the corresponding island group (archipelago).
For each archipelago/taxon combination, an ISAR regression model, with observed species richness (Sobs) as the response
variable and island area (A) as the predictor, was constructed on a log–log scale. This follows the same approach as Arrhenius’ (1921) power model log Sobs = c + b ¥ log A, where c is the
intercept and b the slope. In the particular case of the Canary Islands, ISARs were constructed for both (1) all seven main islands, and (2) all islands with the exception of Fuerteventura and Lanzarote, because these two islands are known to deviate from the general ISAR of their archipelago, being environmen-tally different from the younger islands located to the west and lacking mesic upland habitats (see discussion in Whittaker & Fernández-Palacios, 2007, and Whittaker et al., 2008).
We were unable to find published protocols for evaluating the congruence of archipelagos and their ISARs. Logically, the archi-pelagic point in terms of species richness must fall somewhere between the species richness of the maximum individual island richness and the sum of the species richness of all islands in the archipelago, and archipelagic area is simply the sum of the area of all constituent islands. Therefore, the archipelagic point cannot be considered independent of the ISAR, and so we cannot formally test congruence using standard regression tech-niques. We therefore generated two simple indices to evaluate the departure of the archipelagic point from the richness pre-dicted by extrapolating the ISAR to the total area for the whole archipelago (see below). These indices are based on an exami-nation of the variation around the predicted ISAR but without any statistical probability being attached to them. However, having calculated the indices of fit, we do make use of inferential statistical tests to evaluate the strength of the relationships between these metrics and the properties of the archipelago and the type of taxon studied.
For each archipelago/taxon combination, we estimated archi-pelagic (SApred) and constituent islands’ (SIpred) species richness
from the ISAR regression model. Values of SIpredwere simply the
fitted values of the regression model, while SApredwas estimated
from the model using the total land-surface area of the archi-pelago as the predictor. We then calculated the residuals of the regression model (i.e. observed species richness minus SIpred)
and identified their maximum absolute value (MaxRes). We expressed MaxRes as a proportion (PropMaxRes) of SIpredfor
that particular observation [i.e. if the residual was 1 and the predicted log (species richness) for a given island’s area was 3, then PropMaxRes would be 0.33]. We used PropMaxRes as an aid to examine the amount of disparity between the observed whole-archipelago species richness (SAobs) and its predicted
species richness (SApred). If SAobs was within the bounds of SApred⫾ (SApred¥ PropMaxRes), then we assume that we are not
able to reject the hypothesis that the archipelago follows the ISAR. Conversely, if SAobswas outside these bounds, we assume
that this hypothesis can be rejected and the archipelago species richness is deemed to violate the ISAR. We conducted analogous analyses using the median of the residuals (MedRes) as a more conservative criterion, determining whether the archipelago falls into the interval defined by SApred⫾ (SApred¥ PropMedRes)
or not. Where the archipelago had an even number of islands the
PropMedRes was calculated using the median values of the
abso-lute residuals and of all the SIpred.
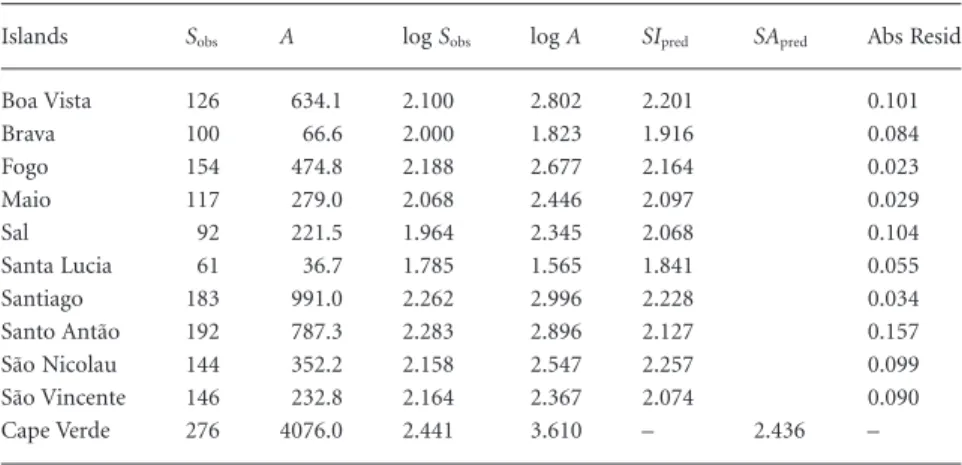
The above procedure can be illustrated using the vascular plants of Cape Verde as an example (Table 1). For this dataset, the ISAR equation (on a log–log scale) is log S = 1.385 + 0.291 ¥ log A; SApredand SIpredwere obtained by applying this equation
to the logarithm of the total land area of the archipelago (4076 km2) and to the logarithm of each island area, respectively
(Table 1). The maximum residual was 0.157 (Santo Antão island) and PropMaxRes was 0.074, which was obtained by cal-culating the proportion of MaxRes over its corresponding SIpred
(2.127). The value obtained for SApred¥ PropMaxRes was 2.436 ¥
0.074 = 0.179, so the interval defined by SApred ⫾ (SApred ¥
PropMaxRes) was 2.436⫾ 0.179. Since the logarithm of the total
richness of the archipelago (2.441) lies inside this interval, we cannot reject that the archipelago is following the ISAR. The same procedure was followed using the median residual (0.087) instead of MaxRes.
We used the ratio between MaxRes and MedRes as a measure of the dispersion of the most distant island points within the archipelago for a preliminary evaluation of whether such
dis-Table 1 Values used to calculate the interval that delimits whether an archipelagic point is congruent with its island species–area relationship (ISAR) or not (for more details see text).
Islands Sobs A log Sobs log A SIpred SApred Abs Resid
Boa Vista 126 634.1 2.100 2.802 2.201 0.101 Brava 100 66.6 2.000 1.823 1.916 0.084 Fogo 154 474.8 2.188 2.677 2.164 0.023 Maio 117 279.0 2.068 2.446 2.097 0.029 Sal 92 221.5 1.964 2.345 2.068 0.104 Santa Lucia 61 36.7 1.785 1.565 1.841 0.055 Santiago 183 991.0 2.262 2.996 2.228 0.034 Santo Antão 192 787.3 2.283 2.896 2.127 0.157 São Nicolau 144 352.2 2.158 2.547 2.257 0.099 São Vincente 146 232.8 2.164 2.367 2.074 0.090 Cape Verde 276 4076.0 2.441 3.610 – 2.436 –
Sobsis the observed species richness of the vascular plants of Cape Verde, A is the island/archipelago
area expressed in km2, log S
obsis the logarithm of Sobs, log A is the logarithm of A, SIpredis the predicted
value for the species richness of each island, SApredis the predicted value for the species richness of
the archipelago, and Abs Resid is the absolute value of the residuals obtained by subtracting SIpredfrom
persion would affect the results of our analyses. The cases in agreement with the ISAR showed similar MaxRes/MedRes ratios to those falling outside this relationship, for both the maximum and median residual criteria (not shown). The degree of disper-sion of the distant island points was, however, higher for the cases meeting only the MaxRes criterion than for the cases meeting both criteria, as expected. We therefore assume that the degree of dispersion of the island points does not affect the probability of rejecting the congruence of an archipelagic point with its ISAR. Rather, it only affects the probability of meeting just the less restrictive or both criteria. Therefore, we expect differences in the criterion met to be mainly driven by the degree of dispersion of the islands, and not by factors causing the archipelagic point to depart from the ISAR. It follows that both criteria are equally reliable in terms of identifying whether an archipelago follows the ISAR of its constituent islands or not.
To determine if any archipelago and/or taxon characteristics account for the fit of an archipelago to its ISAR, we classified the datasets according to: (1) the kind of taxon they belong to (invertebrates, vertebrates or plants), and (2) the origin of the archipelago (continental, mixed or oceanic). In addition, we measured (3) the isolation of the archipelago as the smallest distance between any of the islands and the nearest mainland.
To obtain a measure of how much the archipelago departs from the ISAR, and allow an exploration of potential causes of deviation, we calculated the archipelagic residual (ArcRes) as the residual of the prediction provided by ISAR using the total area of the archipelago. To enable comparisons between different archipelagos, we standardized this residual by dividing it by the total richness observed in the archipelago. Using the above example of the vascular plants from Cape Verde, ArcRes would be calculated as (log SAobs- SApred)/log SAobs, that is (2.441
-2.436)/2.441 = 0.002. We used ArcRes as a response variable in regression models designed to explore the potential causes of deviation from the ISAR in the datasets that yielded significant regressions (P< 0.05). Potential explanatory variables included taxon type, geological origin of the archipelago and isolation, as above.
Finally, we explored whether there is a relationship between the magnitude of ArcRes and the degree of nestedness of the island biotas within the archipelago. Detailed data on species composition per island were not available for many of the datasets used for the former analyses. Due to this, and to avoid problems related to uneven sampling effort, we only analysed a reduced number of arthropod groups in two archipelagos we are more familiar with: the Azores and the Canary Islands (Table 2). These datasets, however, present an ample variation in ArcRes values (compared with the variation found in all studied datasets) and include cases that both enter and fail to enter in the median and maximum residual criteria (see Appendix 1). Given current debate on the most appropriate measure of nestedness (e.g. Almeida-Neto et al., 2007; Ulrich et al., 2009), we calculated two different measures: the nestedness metric based on overlap and decreasing fill (NODF; Almeida-Neto et al., 2008), as rec-ommended by Ulrich et al. (2009); and the original Temperature (T) measure proposed by Atmar & Patterson (1993). We
com-pared these measures and ArcRes by simple correlations and visual examination. Nestedness measures were calculated using aninhado (Guimarães & Guimarães, 2006). All other statistical analyses were performed using Statistica 6.1 (StatSoft, 2003).
R E S U LT S
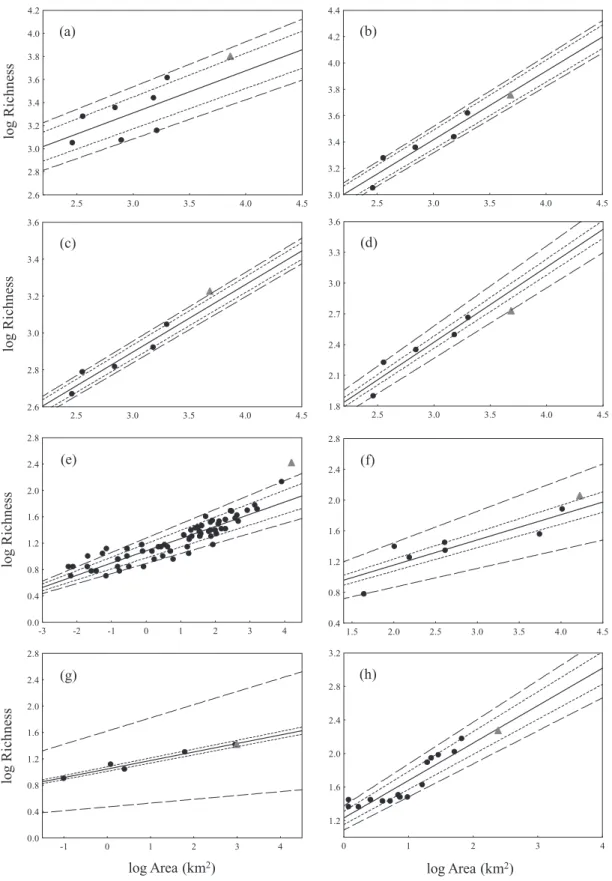
Seventy-two (74%) out of the 97 ISARs examined had slopes significantly different from zero (Appendix 1). Most of the non-significant ISARs came from the Canary Islands (18 out of 25), but most of these became statistically significant after excluding the two more xeric and older islands, Fuerteventura and Lanzarote (see example in Fig. 1a,b). All subsequent results are based on the significant ISARs only. In these archipelago/taxon combinations, slopes (i.e. z-values) ranged from 0.08 to 0.94, with the lower and upper quartiles being 0.22 and 0.52, respec-tively; the median was 0.33; and the overall mean was 0.38.
We could not reject the hypothesis that the archipelago species richness follows the ISAR in 63 cases (88%) when using the maximum residual criterion (Appendix 1; Fig. 1b,f,g,h). The nine cases where the archipelago did not follow the ISAR according to this criterion had significantly lower slopes (median = 0.21, lower and upper quartiles = 0.18 and 0.28) than those that did fit (median = 0.40, lower and upper quartiles = 0.27 and 0.53) (Mann–Whitney U = 156.5, Z = 2.162, n1= 9, n2= 63, P< 0.05). Using the more conservative median residual Table 2 Results of the nestedness analyses for several arthropod groups in the Azores and Canary Islands (data from Borges et al., 2005, and Izquierdo et al., 2004, respectively).
Archipelago n Taxon ArchRes T NODF
Azores 9 All arthropods -0.701 ¥ 10-2 19.38 31.53
9 Arachnids -6.585 ¥ 10-2 20.87 31.04
9 Coleoptera -3.653 ¥ 10-2 18.29 23.35
9 Lepidoptera 2.376 ¥ 10-2 28.20 34.55
Canary Islands 7 Arachnids* 6.791 ¥ 10-2 33.62 14.49
5 Arachnids† 1.522 ¥ 10-2 34.72 16.92
7 Coleoptera* 8.468 ¥ 10-2 40.83 23.05
5 Coleoptera† 2.405 ¥ 10-2 40.12 26.20
7 Lepidoptera* -6.093 ¥ 10-2 20.64 26.45
5 Lepidoptera† -7.394 ¥ 10-2 15.57 30.98
*Refers to all Canary Islands (see text).
†Refers to all Canary Islands except Fuerteventura and Lanzarote (see text).
n, number of islands.
ArchRes is the archipelagic residual (the residual of the prediction
pro-vided by the island species–area relationship (ISAR) using the total area of the archipelago, divided by the total richness observed in the archi-pelago), T is the original Temperature measure of nestedness (Atmar & Patterson, 1993), and NODF is the nestedness metric based on overlap and decreasing fill proposed by Almeida-Neto et al. (2008).
Analyses were not performed for all arthropods in the Canary Islands due to the limit of 3000 lines (i.e. species) of the program used to compute the nestedness measure (aninhado; Guimarães & Guimarães, 2006).
criterion, only 45 out of 72 cases were congruent with their ISAR (63%) (Appendix 1; see examples in Fig. 1b,g,h). Again, most of the cases in which the hypothesis of the archipelago following the ISAR was rejected showed lower slopes (median = 0.27, lower and upper quartiles = 0.19 and 0.33) than those where such a hypothesis was not rejected (median = 0.40, lower and upper quartiles = 0.29 and 0.58) (Mann–Whitney U = 301.5, Z = 3.559, n1= 27, n2= 45, P< 0.001).
When the maximum residual interval was used, vertebrates had more archipelagos following their ISAR than invertebrates or plants (vertebrates 92%, invertebrates 88%, plants 78%; Appendix 1). However, these differences were not significant (c2= 1.06, P = 0.59). Furthermore, when considering the
inter-val defined by the median residual, the proportion of cases that were congruent with the ISAR was almost the same for each one of the three groups (vertebrates and invertebrates 62%, and plants 67%; c2= 0.08, P = 0.96). In any case, differences seemed
to be stronger between archipelagos than between taxa. Some evidence of this came from the archipelagos for which we have data on different taxonomic groups; whereas in several taxa of the Canary Islands the archipelagic point fell outside its ISAR, this was not the case for the Azores or Cape Verde (Appendix 1). Oceanic archipelagos were congruent with their ISAR more often than continental ones, according to the MaxRes criterion (95%, vs. 76%; c2= 5.43, P< 0.05). This difference was more
pronounced when the MedRes criterion was used; while most oceanic archipelagos remain within their ISAR (75%), only 41% of the continental archipelagos showed the same result (c2= 7.98, P< 0.05). Mixed archipelagos were not considered in
these comparisons because of the small number of cases (n = 3). The distance from the archipelago to the mainland also had a significant effect on the probability of rejecting the hypothesis, since more isolated archipelagos were more congruent with their ISARs than less isolated ones (Mann–Whitney U = 159,
Z = -2.12, n1 = 9, n2= 63, P< 0.05 for the MaxRes; Mann–
Whitney U = 413, Z = -2.26, n1= 27, n2= 45, P< 0.05 for the MedRes).
In Fig. 2 we show the ArcRes of the datasets with significant ISARs against their respective distances to the mainland, indi-cating also the type of taxon and geological origin of the archi-pelago. For continental islands ArcRes values showed a marginally non-significant negative relationship with isolation (Spearman R = -0.33, P = 0.08), whereas for oceanic islands this relationship was significant and positive (Spearman R = 0.39,
P < 0.05). ArcRes of continental archipelagos and vertebrates
showed higher variation than in other categories (SD = 0.14 and 0.16, respectively, versus 0.12 for plants, 0.09 for invertebrates, 0.08 for mixed archipelagos and 0.07 for oceanic archipelagos). In fact, there were significant differences between the ArcRes values as a function of the geological origin of the archipelagos (i.e. ArcRes values were bigger for continental archipelagos; Mann–Whitney U = 344, Z = 2.87, P< 0.01; mixed archipelagos were not considered for this analysis) but not between different taxa [Kruskal–Wallis H (2 d.f., n = 72) = 0.093; P = 0.95]. It is noteworthy that invertebrates from continental islands had more positive ArcRes values than negative ones, indicating that,
in such cases, the ISAR tends to under-predict archipelagic species richness, especially in the least isolated islands. However, in the case of the invertebrates from oceanic islands the opposite relationship appears to occur: the least isolated archipelagos typically had negative ArcRes values while the most distant ones exhibited positive residuals. For all the other archipelago/taxon combinations the few data points available were much more scattered and therefore showed no evident trend.
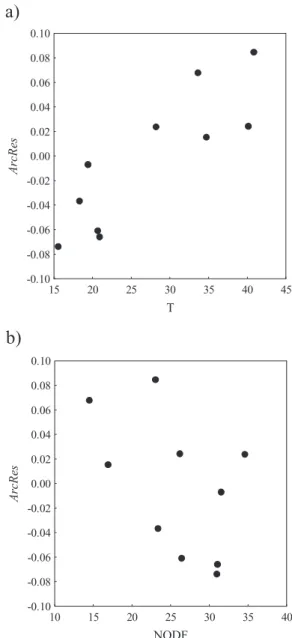
The degree of nestedness of island biotas showed a clear rela-tionship with ArcRes: the more nested a dataset, the lower (and negative) the archipelagic residual (Table 2, Fig. 3). In the cases analysed this pattern is more evident using the Temperature index (Spearman R = 0.83, n = 10, t [n - 2] = 4.21, P< 0.01) than for NODF (Spearman R = -0.48, n = 10, t [n - 2] = -1.54,
P = 0.16).
D I S C U S S I O N
It is often commented that community ecology has few general rules or laws (Lawton, 1996, 1999, 2000; but see Gaston & Blackburn, 2000; Simberloff, 2004; Ricklefs, 2008). One of the few exceptions is held to be the species–area relationship, which is widely applicable for all scales and types of organisms, from bacteria to vertebrates (Rosenzweig, 1995). The species–area relationship has commonly been described for discrete geo-graphic units, such as islands within an archipelago (Rosenz-weig, 1995; Whittaker & Fernández-Palacios, 2007). However, it is not unusual to lump together data on the constituent islands of archipelagos by adding island areas and combining island species lists to obtain the overall area and richness of the archi-pelagos (e.g. Wilson, 1961; Scott, 1972; Wright, 1983; Adler et al., 1995; Carvajal & Adler, 2005; among others). Although this allows the use of these data in large-scale analyses, it also implies that the archipelagos as a whole follow the same relationship with area that their constituent islands do, an assumption that has never been evaluated before.
We have shown that archipelagos do often follow the same ISAR as their constituent islands. In the majority of the cases studied, the archipelagic point is congruent with its ISAR, which begs the question of why whole archipelagos should follow the same species–area relationship as their constituent islands? The answer must be related to the endogenous dynamics of the system (speciation, immigration and extinction), which are determined by a number of regional factors such as total area of the archipelago, number of islands, environmental heterogene-ity, isolation and geological age. These factors act as local filters for the regional processes acting over the species pool of the archipelago (see Ricklefs, 2007, 2008). Given the importance of regional processes common to all their constituent islands, many archipelagos can be considered to behave as a coherent entity for the different processes establishing species diversity. Interestingly, as a consequence of source pool effects there is a close association between species–area and local–regional rich-ness relationships (see Srivastava, 1999; He et al., 2005), so species richness on individual islands is to some extent a reflec-tion of the species pool of the archipelago.
0 1 2 3 4 1.2 1.6 2.0 2.4 2.8 3.2 -1 0 1 2 3 4 0.0 0.4 0.8 1.2 1.6 2.0 2.4 2.8 1.5 2.0 2.5 3.0 3.5 4.0 4.5 0.4 0.8 1.2 1.6 2.0 2.4 2.8 -3 -2 -1 0 1 2 3 4 0.0 0.4 0.8 1.2 1.6 2.0 2.4 2.8 2.5 3.0 3.5 4.0 4.5 1.8 2.1 2.4 2.7 3.0 3.3 3.6 2.5 3.0 3.5 4.0 4.5 3.0 3.2 3.4 3.6 3.8 4.0 4.2 4.4 2.5 3.0 3.5 4.0 4.5 2.6 2.8 3.0 3.2 3.4 3.6 3.8 4.0 4.2 2.5 3.0 3.5 4.0 4.5 2.6 2.8 3.0 3.2 3.4 3.6 (a) (b) (c) (d) (e) (f) (g) (h) log R ic h n es s log R ic h n es s log R ic h n es s log R ic h n es s
log Area (km2) log Area (km2)
Figure 1 Relationship between species richness and area for several archipelago/taxon combinations. Individual islands are represented by black circles and the archipelagos by grey triangles. The island species–area relationship (ISAR) predicted by the regression function is shown as a continuous line in each case. The intervals defined by the maximum and median residuals criteria (see text) are represented by the dashed and the dotted lines, respectively: (a) Canary Islands – arthropods (all islands); (b) Canary Islands – arthropods (without Fuerteventura and Lanzarote); (c) Canary Islands – Coleoptera (without Fuerteventura and Lanzarote); (d) Canary Islands – Lepidoptera (without Fuerteventura and Lanzarote); (e) Aegean Islands – land snails; (f) Fiji – ants; (g) Chatman Islands – birds; (h) Cook Islands – plants. See data sources and regression statistics in Appendix 1.
Given that area is one of the best macroecological descriptors of island species richness (see, e.g., Rosenzweig, 1995; Whittaker & Fernández-Palacios, 2007; Triantis et al., 2008a), the island group as a whole should also be expected to follow its endo-genous species–area dynamics. We thus argue that if the archi-pelago is sufficiently isolated for all the islands to have an equivalent species pool, and the geological characteristics and evolutionary processes are coherent from island to island, it is unsurprising that the biota of the whole of the archipelago would follow the same relationship with area as the one oper-ating within the constituent islands. In other words, the accu-mulation of new species with additional islands will show a consistent relationship with their area. It follows from our ratio-nale that the departure of the archipelago from the ISAR will be related to some extent to the degree of nestedness of the island biotas (see also Wright et al., 1998).
The additional analyses carried out on several arthropod groups of the Canary Islands and the Azores show that the magnitude of the departure of the archipelago from the ISAR is related to nestedness. The more nested the biota of the archi-pelago, the lower the archipelagic residual, a trend that is especially evident when using the Temperature metric. The sen-sitivity to the choice of nestedness metric [Temperature metric of Atmar & Patterson (1993) versus NODF metric of Almeida-Neto et al. (2008)] might reflect the nature of the nestedness patterns. While traditional ‘gap-counting’ nestedness metrics such as Temperature are biased towards the loss of species among islands, NODF also accounts for the degree of coinci-dence of species presences in the poorer sites (see Almeida-Neto
et al., 2008; Ulrich et al., 2009). In other words, while
Tempera-ture values reflect how widespread species are distributed in progressively less rich islands, NODF also takes into account whether poor islands host rare species or not. These rare species are species present in just one or a few islands, so NODF would be expected to be more sensitive when the patterns of nestedness within the archipelago are driven by the numbers of single island endemics (SIEs). Within this framework, the less tight relationship between the archipelagic residual and NODF compared with its relationship with Temperature allows us to
log Distance (km) Ar cR es 0 1 5 50 500 5000 -0.3 -0.2 -0.1 0.0 0.1 0.2 0.3 0.4 0.5
Figure 2 Distribution of the archipelagic residual (ArcRes) for the 72 significant archipelago/taxon combinations, according to the logarithm of the distance to the mainland (in km). ArcRes was calculated as the residual of the prediction provided by the island species–area relationship (ISAR) using the total area of the archipelago, standardized by the total richness observed in the archipelago. The symbol shade represents the type of taxon (black, vertebrates; grey, invertebrates; white, plants), and their shapes represent the type of archipelago (circles, continental; triangles, oceanic; squares, mixed archipelagos). The horizontal line serves only as a guide line to ArcRes = 0.
a)
b)
15 20 25 30 35 40 45 T -0.10 -0.08 -0.06 -0.04 -0.02 0.00 0.02 0.04 0.06 0.08 0.10 Ar cR es 10 15 20 25 30 35 40 NODF -0.10 -0.08 -0.06 -0.04 -0.02 0.00 0.02 0.04 0.06 0.08 0.10 Ar cR esFigure 3 Relationship between the archipelagic residual (ArchRes) and two nestedness measures: (a) Temperature (T), the original measure proposed by Atmar & Patterson (1993), and (b) the overlap and decreasing fill metric (NODF) proposed by Almeida-Neto et al. (2008). Note that the higher the NODF, the more nested the archipelago, which is the converse of the ordering of the T metric. Data correspond to several arthropod groups of the Azores and the Canary Islands (see Table 2).
postulate that the number of SIEs per se does not necessarily have an effect on the departure of the archipelago from the ISAR. In fact, many cases with disproportionately high numbers of SIEs (and therefore highly non-nested biotas) fall into the confidence intervals we used in this work [e.g. Hawaiian land snails (Cowie, 1995) and lobeliads (Givnish et al., 2009)].
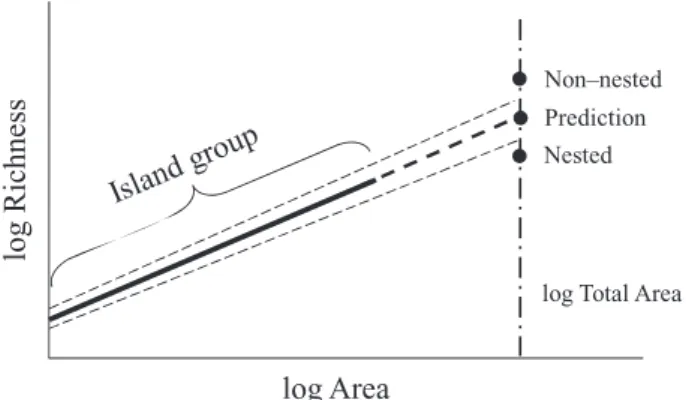
The residual variation of the archipelagic data point seems thus to reflect a particular aspect of nestedness: the absence of species present in the richer islands in progressively poorer islands (i.e. richness-ordered nestedness sensu Whittaker & Fernández-Palacios, 2007). Departures from the ISAR are thus expected in systems that are either highly nested or not nested at all (Fig. 4), independently of the number of SIEs. In the case of highly nested systems, the richness of the archipelago will scarcely exceed that of the largest island and will be fairly insen-sitive to the number and area of smaller islands. Thus, the pre-dicted number of species for the total area of the archipelago will be higher than the observed species richness (e.g. Lepidoptera from the Canary Islands; Fig. 1d). Conversely, in highly non-nested systems there is a high rate of accumulation of new species with the addition of each island. Hence, the observed archipelagic species richness (a cumulative total) should be higher than that predicted by the non-cumulative series pro-vided by the ISAR (e.g. Coleoptera of the Canary Islands or land snails of the Aegean Islands; Fig. 1c,e). However, as discussed above, high overall numbers of SIE in the archipelago are not enough to cause significant departures from the ISAR (e.g. the highly species rich land snails and lobeliads of Hawaii men-tioned above). Rather, departures will appear when the pro-cesses leading to the appearance of high numbers of SIE differ within the set of islands collated together for an analysis. Where an archipelago is composed of different groups of islands with
differing characteristics, the processes building up island biotas might vary amongst the constituent islands. This will happen in archipelagos where: (1) the proximity to the source(s) of colo-nizers allows inter-island variation in colonization rates and/or the arrival probability of particular species or lineages (thus different sets of widespread species will be found in different clusters of islands); (2) one or some of the islands show higher speciation rates (e.g. because they are significantly larger; see Losos & Schluter, 2000); and also (3) some islands suffer anoma-lous pulses of extinction (e.g. island sterilization processes; see Whittaker & Fernández-Palacios, 2007). All these cases will produce anomalous patterns of species accumulation with area, and the departure of the overall richness of the archipelago from the ISAR of its constituent islands.
This raises a more general point: almost all situations where the archipelagic point deviates significantly from the ISAR came from cases where both the slope of the ISAR and the degree of isolation were low, and the total species richness was higher than expected by the ISAR. Given that the ISAR slopes of these excep-tional cases are low, it is not surprising that the total richness of the archipelago falls above the relationship observed for the islands, as seen for the Coleoptera of the Canary Islands or the land snails of the Aegean Islands (Fig. 1c,e, respectively). The reasons for such a non-nested pattern could be: (1) a particu-larly high speciation rate and/or particular patterns in clusters of islands (i.e. limitations to dispersal and availability of ecological space that allow a higher number of speciation events and thus the generation of large numbers of species over the whole archi-pelago); (2) a heterogeneous geological history among the indi-vidual islands, enough to differentiate sets of islands with particular dynamics (e.g. the Canary Islands; see Whittaker
et al., 2008); or (3) multiple sources for the arrival of new species
(which is the case for the Aegean Islands). Conversely, highly nested systems might arise from several circumstances, includ-ing: (4) a low rate of colonization from the continent, which will result in a small number of lineages inhabiting the archipelago, and thus lower compositional replacement; and (5) high rates of dispersal between islands, which will also result in low compo-sitional replacement from island to island. Canarian Lepi-doptera provided the only example in which the overall richness of the archipelagic point falls significantly below the ISAR according to our maximum residual criterion, indicating a low degree of dissimilarity for this group (see Fig. 1d). Butterflies and moths are in general very good dispersers (e.g. Borges & Hortal, 2009), which results in low compositional differences between island faunas (our reason 5). Hence, the total species richness of the archipelago does not increase significantly with the addition of new islands.
Our analytical approach presents several limitations that reflect the exploratory nature of our study. For example, many of the cases we studied pertain to just five island groups (Aegean Islands, Azores, Canary Islands, Cape Verde and Hawaii) for which relatively comprehensive data are available. As a consequence, although the results from these archipelagos reassure us that our conclusions are reliable in broad qualita-tive terms, we cannot be sure that these results will also turn
Prediction
log
Richness
log Area
log Total Area Non–nested
Nested
Figure 4 Hypothetical relationships between different degrees of nestedness and the departure of the archipelago point from the island species–area relationship (ISAR), in a log–log species–area plot. Here, nestedness is a by-product of the rate of accumulation of new species to the total list of the archipelago with the addition of new islands (i.e. richness-ordered nestedness sensu Whittaker & Fernández-Palacios, 2007). Where a system tends towards perfect nestedness, the archipelago richness will be the same as that of the largest island (or only a little higher), while for completely unnested systems the archipelago richness is the sum of the richness of each constituent island.
out to be reliable in quantitative terms. Given the relationship between the degree of departure of the ISAR and nestedness found here, we recommend that further research on this topic should rely on the development of null models of the relation-ship between area and species assembly in a presence/absence matrix. The assumptions and development of these models are currently under debate, and several null hypotheses for random assembly have been proposed so far (see, e.g., Wright
et al., 1998; Rodríguez-Gironés & Santamaría, 2006;
Almeida-Neto et al., 2007, 2008; Ulrich et al., 2009). In fact, these null hypotheses correspond to different aspects of nestedness: rich-ness ordered or area ordered (see also Whittaker & Fernández-Palacios, 2007; Ulrich et al., 2009). We anticipate that departures from the null expectations of these models would depend on the disparity in the presence of widespread species among islands, rather than on the number of rare species (e.g. SIE; see above). Therefore, we hypothesize that these depar-tures would provide insight into the processes determining the assembly of island biotas within the archipelago, such as varying geological histories, island isolation or habitat diversity (see, e.g., Roughgarden, 1989; Lomolino & Davis, 1997; Hortal
et al., 2009), but they will be relatively independent of
differ-ences in the evolutionary processes among islands.
To summarize, we have shown that archipelagos usually follow the same species–area relationship as their constituent islands. A straightforward implication of our results is that archipelagos can, in most cases, be considered as distinct entities. Hence, researchers would be justified in lumping species lists from their constituent islands when conducting biogeographical and/or macroecological studies. It is also important to note that most of the archipelagos studied are in fact ‘SLOSS neutral’ (sensu Rosen-zweig, 2004), and thus that at this large scale whether conserva-tion efforts are devoted to a single large island or to several small ones may be of limited relevance (see also Rosenzweig, 2004). Importantly, the degree of departure from the ISAR (i.e. the archipelagic residual) is related to a particular aspect of nested-ness, the loss of species present on the richest islands from the poorer ones, and can therefore be used as a crude index of richness-ordered nestedness when detailed island checklists are lacking. Given that area is just one of a number of factors deter-mining the species richness on islands, within this framework the departure of some archipelagos from their ISAR would be caused by other factors affecting the assembly of island faunas, and therefore nestedness patterns (see Wright et al., 1998). Further studies are required to understand the complexities of the influ-ence of these factors on the degree of departure of the archipe-lagic point from the ISAR and the exact nature of the relationship between such departure and nestedness, and also to establish the pattern of departure of archipelagic data points from their con-stituent ISARs for other types of insular system, including anthropogenic habitat islands in fragmented landscapes.
A C K N O W L E D G E M E N T S
We thank three anonymous referees for their critical comments. A.M.C.S. was supported by a Portuguese FCT grant (SFRH/BD/
21496/2005), K.A.T. by a Marie Curie Intra-European Fellow-ship Program (project ‘SPAR’, 041095) and the Academic Visitors Program of the NERC Centre for Population Biology, P.A.V.B. by CITA-A, and J.H. by the UK Natural Environment Research Council.
R E F E R E N C E S
Adler, G.H. (1992) Endemism in birds of tropical Pacific islands.
Evolutionary Ecology, 6, 296–306.
Adler, G.H. (1994) Avifaunal diversity and endemism on tropi-cal Indian Ocean islands. Journal of Biogeography, 21, 85– 95.
Adler, G.H. & Dudley, R. (1994) Butterfly biogeography and endemism on tropical Pacific islands. Biological Journal of the
Linnean Society, 51, 151–162.
Adler, G.H., Austin, C.C. & Dudley, R. (1995) Dispersal and speciation of skinks among archipelagos in the tropical Pacific Ocean. Evolutionary Ecology, 9, 529–541.
Almeida-Neto, M., Guimarães, P.R., Jr & Lewinsohn, T.M. (2007) On nestedness analyses: rethinking matrix tempera-ture and anti-nestedness. Oikos, 116, 716–722.
Almeida-Neto, M., Guimarães, P., Guimarães, P.R., Jr, Loyola, R.D. & Ulrich, W. (2008) A consistent metric for nestedness analysis in ecological systems: reconciling concept and mea-surement. Oikos, 117, 1227–1239.
Arechavaleta, M., Zurita, N., Marrero, M.C. & Martin, J.L. (2005) Lista preliminar de especies silvestres de Cabo Verde
(hongos, plantas y animales terrestres). Consejería de Medio
Ambiente y Ordenación Territorial, Gobierno de Canarias, La Laguna, Tenerife.
Arrhenius, O. (1921) Species and area. Journal of Ecology, 9, 95–99.
Atmar, W. & Patterson, B.D. (1993) The measure of order and disorder in the distribution of species in fragmented habitat.
Oecologia, 96, 373–382.
Azeria, E.T. (2004) Terrestrial bird community patterns on the coralline islands of the Dahlak Archipelago, Red Sea, Eritrea.
Global Ecology and Biogeography, 13, 177–187.
Beck, J. & Kitching, I.J. (2004–2008) The Sphingidae of Southeast
Asia (incl. New Guinea, Bismarck and Solomon Islands), version 1.5. Available at: http://www.sphin-sea.unibas.ch/ (accessed
15 June 2008).
Bennett, D.J. (2008) The ophionine wasps of Hawaii (Hymenoptera: Ichneumonidae). Journal of Hymenoptera
Research, 17, 1–43.
Biber, E. (2002) Patterns of endemic extinctions among island bird species. Ecography, 25, 661–676.
Blackburn, T.M., Cassey, P., Duncan, R.P., Evans, K.L. & Gaston, K.J. (2004) Avian extinctions and mammalian introductions on oceanic islands. Science, 305, 1955–1958.
Borges, P.A.V. & Hortal, J. (2009) Time, area and isolation: factors driving the diversification of Azorean arthropods.
Journal of Biogeography, 36, 178–191.
Borges, P.A.V., Cunha, R., Gabriel, R., Martins, A.F., Silva, L. & Vieira, V. (2005) A list of the terrestrial fauna (Gastropoda and
Arthropoda) and flora from the Azores. Direcção Regional de
Ambiente e do Mar dos Açores, Horta, Faial.
Carvajal, A. & Adler, G.H. (2005) Biogeography of mammals on tropical Pacific islands. Journal of Biogeography, 32, 1561– 1569.
Conroy, C.J., Demboski, J.R. & Cook, J.A. (1999) Mammalian biogeography of the Alexander Archipelago of Alaska: a north temperate nested fauna. Journal of Biogeography, 26, 343–352. Cowie, R.H. (1995) Variation in species diversity and shell shape in Hawaiian land snails: in situ speciation and ecological rela-tionships. Evolution, 49, 1191–1202.
Dapporto, L. & Cini, A. (2007) Faunal patterns in Tuscan archi-pelago butterflies: the dominant influence is recent geography not paleogeography. European Journal of Entomology, 104, 497–503.
Dapporto, L. & Dennis, R.L.H. (2008) Species richness, rarity and endemicity on Italian offshore islands: complementary signals from island-focused and species-focused analyses.
Journal of Biogeography, 35, 664–674.
Dengler, J. (2009) Which function describes the species–area relationship best? A review and empirical evaluation. Journal
of Biogeography, 36, 728–744.
Fattorini, S. (2002) Biogeography of the tenebrionid beetles (Coleoptera, Tenebrionidae) on the Aegean Islands (Greece).
Journal of Biogeography, 29, 49–67.
Gaston, K.J. & Blackburn, T.M. (2000) Pattern and process in
macroecology. Blackwell Science, Oxford.
Givnish, T.J., Millam, K.C., Mast, A.R., Paterson, T.B., Theim, T.J., Hipp, A.L., Henss, J.M., Smith, J.F., Wood, K.R. & Sytsma, K.J. (2009) Origin, adaptive radiation and diversification of the Hawaiian lobeliads (Asterales: Campanulaceae).
Proceedings of the Royal Society B: Biological Sciences, 276,
407–416.
Gray, J.S., Ugland, K.I. & Lambshead, J. (2004) On species accu-mulation and species–area curves. Global Ecology and
Bioge-ography, 13, 567–568.
Guimarães, J.P.R. & Guimarães, P. (2006) Improving the analy-ses of nestedness for large sets of matrices. Environmental
Modelling and Software, 21, 1512–1513.
Hamilton, A.M., Hartman, J.H. & Austin, C.C. (2009) Island area and species diversity in the southwest Pacific Ocean: is the lizard fauna of Vanuatu depauperate? Ecography, 32, 247–258. He, F.L., Gaston, K.J., Connor, E.F. & Srivastava, D.S. (2005) The local–regional relationship: immigration, extinction, and scale. Ecology, 86, 360–365.
Holyoak, G.A., Turk, S.M. & Cameron, R.A.D. (2005) Land mol-luscs on the Isles of Scilly: species richness and composition related to area. Journal of Conchology, 38, 549–560.
Hortal, J., Triantis, K.A., Meiri, S., Thébault, E. & Sfenthourakis, S. (2009) Island species richness increases with habitat diver-sity. The American Naturalist, 173, E205–E217.
Izquierdo, I., Martín, J.L., Zurita, N. & Arechavaleta, M. (2004)
Lista de especies silvestres de Canarias (hongos, plantas y ani-males terrestres), 2nd edn. Consejería de Política Territorial y
Medio Ambiente del Gobierno de Canarias, La Laguna, Tenerife.
Kohn, D.D. & Walsh, D.M. (1994) Plant species richness – the effect of island size and habitat diversity. Journal of Ecology,
82, 367–377.
Kotze, D.J., Niemelä, J. & Nieminen, M. (2000) Colonization success of carabid beetles on Baltic islands. Journal of
Bioge-ography, 27, 807–819.
Kryštufek, B. & Kletecˇki, E. (2007) Biogeography of small ter-restrial vertebrates on the Adriatic landbridge islands. Folia
Zoologica, 56, 225–234.
Lawton, J.H. (1996) Patterns in ecology. Oikos, 75, 145–147. Lawton, J.H. (1999) Are there general laws in ecology? Oikos, 84,
177–192.
Lawton, J.H. (2000) Community ecology in a changing world. Ecology Institute, Oldendorf/Luhe, Germany.
Lomolino, M.V. & Davis, R. (1997) Biogeographic scale and biodiversity of mountain forest mammals of western North America. Global Ecology and Biogeography Letters, 6, 57–76. Losos, J.B. & Schluter, D. (2000) Analysis of an evolutionary
species–area relationship. Nature, 408, 847–850.
MacArthur, R.H. & Wilson, E.O. (1963) An equilibrium theory of insular zoogeography. Evolution, 17, 373–387.
MacArthur, R.H. & Wilson, E.O. (1967) The theory of island
biogeography. Princeton University Press, Princeton, NJ.
McCormack, G. (2007) Cook Islands biodiversity database. Cook Islands Natural Heritage Trust, Rarotonga. Available at: http:// cookislands.bishopmuseum.org (accessed 17 November 2007).
Millien-Parra, V. & Jaeger, J.-J. (1999) Island biogeography of the Japanese terrestrial mammal assemblages: an example of a relict fauna. Journal of Biogeography, 26, 959–972.
Mylonas, M.A. (1982) The zoogeography and ecology of the
ter-restrial molluscs of Cyclades [in Greek]. PhD Thesis, University
of Athens, Athens, Greece.
Niemelä, J. (1988) Habitat occupancy of carabid beetles on small islands and the adjacent Åland mainland, SW Finland.
Annales Zoologici Fennici, 25, 121–131.
Niemelä, J., Haila, Y., Ranta, E., Tiainen, J., Vepsäläinen, K. & Ås, S. (1987) Distribution of carabid beetles in four boreal archi-pelagoes. Annales Zoologici Fennici, 24, 89–100.
Nishida, G.M. (2002) Hawaiian terrestrial arthropod checklist. Available at: http://www2.bishopmuseum.org/HBS/checklist/ query.asp?grp (accessed 22 February 2007).
Pandža, M. & Stancˇic´, Z. (2004) Second contribution to the flora of the Kornati islands (Croatia). Natura Croatica, 13, 47– 61.
Pandža, M., Franjic´, J. & Škvorc, Z. (2002) The flora of some uninhabited Šibenik archipelago islands (Dalmatia, Croatia).
Natura Croatica, 11, 367–385.
Panitsa, M. & Tzanoudakis, D. (1998) Contribution to the study of the Greek flora: flora and vegetation of the E Aegean islands Agathonisi and Pharmakonisi. Wildenowia, 28, 95–116. Ricklefs, R.E. (2007) History and diversity: explorations at the
intersection of ecology and evolution. The American
Natural-ist, 170, S56–S70.
Ricklefs, R.E. (2008) Disintegration of the ecological commu-nity. The American Naturalist, 172, 741–750.
Rodríguez-Gironés, M.A. & Santamaría, L. (2006) A new algo-rithm to calculate the nestedness temperature of presence– absence matrices. Journal of Biogeography, 33, 924–935. Rosenzweig, M.L. (1995) Species diversity in space and time.
Cambridge University Press, Cambridge, UK.
Rosenzweig, M.L. (2003) Reconciliation ecology and the future of species diversity. Oryx, 37, 194–205.
Rosenzweig, M.L. (2004) Applying species–area relationships to the conservation of diversity. Frontiers of biogeography: new
directions in the geography of nature (ed. by M.V. Lomolino
and L.R. Heaney), pp. 325–343. Sinauer Associates, Sunder-land, MA.
Roughgarden, J. (1989) The structure and assembly of commu-nities. Perspectives in ecological theory (ed. by J. Roughgarden, R.M. May and S.A. Levin), pp. 203–226. Princeton University Press, Princeton.
Schatz, H. (1998) Oribatid mites of the Galápagos Islands – faunistics, ecology and speciation. Experimental and Applied
Acarology, 22, 373–409.
Scheiner, S.M. (2003) Six types of species–area curves. Global
Ecology and Biogeography, 12, 441–447.
Schoener, T.W. (1976) The species–area relation within archi-pelagos: models and evidence from island birds. Proceedings of
the XVI International Ornithological Congress, 6, 629–642.
Scott, J.A. (1972) Biogeography of Antillean butterflies.
Biotro-pica, 4, 32–45.
Sfenthourakis, S. (1996) A biogeographical analysis of terrestrial isopods (Isopoda, Oniscidea) from the central Aegean islands (Greece). Journal of Biogeography, 23, 687–698.
Sfenthourakis, S., Giokas, S. & Tzanatos, E. (2004) From sam-pling stations to archipelagos: investigating aspects of the assemblage of insular biota. Global Ecology and Biogeography,
13, 23–35.
Sheremet’ev, I.S. (2004) Stability of isolated populations of ter-restrial mammals inhabiting the islands of the Peter the Great Bay, Sea of Japan. Russian Journal of Ecology, 35, 171–175. Simberloff, D. (2004) Community ecology: is it time to move
on? The American Naturalist, 163, 787–799.
Srivastava, D.S. (1999) Using local–regional richness plots to test for species saturation: pitfalls and potentials. Journal of
Animal Ecology, 68, 1–16.
StatSoft (2003) STATISTICA (data analysis software system),
version 6.1. StatSoft Inc., Tulsa, OK.
Tomiyama, K. & Kurozumi, T. (1992) Terrestrial mollusks and conservation of their environment in the Ogasawara Islands [in Japanese with English summary]. Regional Views, 5, 39–81. Triantis, K.A., Mylonas, M., Weiser, M.D., Lika, K. & Vardinoy-annis, K. (2005) Species richness, environmental heterogene-ity and area: a case study based on land snails in Skyros
archipelago (Aegean Sea, Greece). Journal of Biogeography, 32, 1727–1735.
Triantis, K.A., Mylonas, M. & Whittaker, R.J. (2008a) Evolution-ary species–area curves as revealed by single-island endemics: insights for the inter-provincial species–area relationship.
Ecography, 31, 401–407.
Triantis, K.A., Vardinoyannis, K. & Mylonas, M. (2008b) Bioge-ography, land snails and incomplete data sets: the case of three island groups in the Aegean Sea. Journal of Natural History, 42, 467–490.
Trichas, A., Lagkis, A., Triantis, K.A., Poulakakis, N. & Chatzaki, M. (2008) Biogeographic patterns of tenebrionid beetles (Coleoptera, Tenebrionidae) on four island groups in the south Aegean Sea. Journal of Natural History, 42, 491–511. Ulrich, W., Almeida-Neto, M. & Gotelli, N.J. (2009) A
consum-er’s guide to nestedness analysis. Oikos, 118, 3–17. Wallace, A.R. (1902) Island life, 3rd edn. Macmillan, London. Ward, D.F. & Wetterer, J.K. (2006) Checklist of the ants of Fiji
(Hymenoptera: Formicidae). Fiji Arthropods III (ed. by N.L. Evenhuis and D.J. Bickel), Bishop Museum Occasional Papers, No. 85, pp. 23–47.
Welter-Schultes, F.W. & Williams, M.R. (1999) History, island area and habitat availability determine land snail species rich-ness of Aegean islands. Journal of Biogeography, 26, 239–249. Whittaker, R.J. & Fernández-Palacios, J.M. (2007) Island
bioge-ography: ecology, evolution, and conservation, 2nd edn. Oxford
University Press, Oxford.
Whittaker, R.J., Triantis, K.A. & Ladle, R.J. (2008) A general dynamic theory of oceanic island biogeography. Journal of
Biogeography, 35, 977–994.
Williams, G.R. (1981) Aspects of avian island biogeography in New Zealand. Journal of Biogeography, 8, 439–456.
Wilson, E.O. (1961) The nature of the taxon cycle in the Melane-sian ant fauna. The American Naturalist, 95, 169–193. Wilson, E.O. & Hunt, G.L. (1967) Ant fauna of Futuna and
Wallis Islands, stepping stones to Polynesia. Pacific Insects, 9, 563–584.
Woinarski, J.C.Z., Reichel, H. & Andersen, A.N. (1998) The dis-tribution of ants on the Wessel and English Company Islands, in the seasonal tropics of Australia’s Northern Territory.
Aus-tralian Journal of Zoology, 46, 557–579.
Wright, D.H. (1983) Species–energy theory – an extension of species–area theory. Oikos, 41, 496–506.
Wright, D.H., Patterson, B.D., Mikkelson, G.M., Cutler, A. & Atmar, W. (1998) A comparative analysis of nested subset patterns of species composition. Oecologia, 113, 1–20. Zalewski, M. & Ulrich, W. (2006) Dispersal as a key element of
community structure: the case of ground beetles on lake islands. Diversity and Distributions, 12, 767–775.
B I O S K E T C H E S
Ana M. C. Santos is a PhD student at Imperial College London. She studies island biogeography, comparing the
host–parasitoid interactions between islands and mainland. She is also interested in the applicability of species–area relationships on different scales and the potential biases in databases.
Robert J. Whittaker, Kostas A. Triantis, Paulo A. V. Borges and Joaquín Hortal are interested in island
biogeography, among other topics. Owen R. Jones and Donald L. J. Quicke work on the macroevolution of parasitoids. Author contributions: A.M.C.S., R.J.W., K.A.T. and J.H. conceived the ideas; A.M.C.S., K.A.T. and P.A.V.B. gathered the data; A.M.C.S. and J.H. analysed the data; and A.M.C.S., R.J.W., K.A.T. and J.H. wrote the paper with P.A.V.B., O.R.J. and D.L.J.Q. All authors discussed the results and commented on the manuscript.
Editor: Brian McGill
Appendix 1 Characteristics of the archipelago/taxon combinations studied, and results of the species–area regressions and the degree of departure of the archipelagic point from its island species–area relationship (ISAR).
Archipelago I n A G Taxon Sobs SApred Slope Inter. R2 Interval Ref.
C
o
nt
inental
Adriatic Islands 1 13 2586 V Amphibians 7 9.8 0.50 -0.70 0.52** Max, Med 1
Adriatic Islands 1 14 2638 V Mammals 13 14.1 0.29 0.15 0.69*** Max, Med 1
Adriatic Islands 1 14 2638 V Reptiles 28 33.4 0.36 0.29 0.79*** Max, Med 1
Adriatic Islands 1 14 2638 V Vertebrates 48 57.8 0.36 0.52 0.78*** Max, Med 1
Aegean Islands 2 44 3562 I Isopods 69 49.6 0.20 0.97 0.91*** Max 2
Aegean Islands 2 20 3371 I Isopods 59 42.3 0.21 0.88 0.59*** – 3
Aegean Islands 7 65 15,853 I Land snails 264 72.5 0.19 1.08 0.83*** – 4
Aegean Islands 7 64 7593 I Land snails1 196 59.4 0.18 1.08 0.83 – 4
Aegean Islands 10 9 18 P Plants 402 279.8 0.35 2.00 0.78** Max, Med 5
Aegean Islands 0.1 32 20,313 I Tenebrionids 126 41.9 0.28 0.41 0.41*** Max 6
Aegean Islands 8 26 369 I Tenebrionids 59 30.5 0.28 0.78 0.75*** Max 7
Åland Archipelago 0.25 5 1 I Carabids 33 23.0 0.21 1.40 0.47 – 8
Alexander Archipelago 0.35 24 32,707 V Mammals 23 5.7 0.19 -0.10 0.95*** Max 9
Baltic Islands 0.3 24 78 I Carabids 61 30.8 0.11 1.28 0.47*** – 10
Cyclades 13 24 2437 I Land snails 82 62.1 0.27 0.89 0.64*** Max 11
Italian Islands 0.45 31 1234 I Lepidoptera 86 32.6 0.13 1.11 0.21* Max 12
Kalymnos Islands 8 12 132 I Land snails 47 49.9 0.20 1.28 0.81*** Max, Med 13
Kornati Archipelago 16 5 34 P Plants 634 363.3 0.28 2.13 0.92* – 14
Lake Mamri Islands 0.4 15 51 I Carabids 71 36.4 0.14 1.60 0.66*** – 15
Peter the Great Bay Isl. 0.3 11 161 V Mammals 19 10.1 0.31 0.31 0.39* Max, Med 16
Pihlajavesi Archipelago 2 13 1 I Carabids 23 16.5 0.33 1.24 0.37* Max, Med 17
Sardinian–Corsican Isl. 50 11 326 I Lepidoptera 65 24.7 0.15 1.01 0.49* – 12
Scilly Isles 45 7 14 I Land snails 51 54.6 0.36 1.34 0.85** Max, Med 18
Shetland Islands 180 42 3 P Plants 81 186.1 0.48 2.03 0.73*** Max 19
Šibenik Archipelago 1 10 10 P Plants 278 214.8 0.18 2.15 0.94*** – 20
Sicilian Islands 22 10 525 I Lepidoptera 30 20.1 0.09 1.07 0.17 Max 12
Skyros Archipelago 90 12 221 I Land snails 42 40 0.18 1.19 0.88*** Max, Med 21
Stockolm Archipelago 10 12 4 I Carabids 28 16 0.30 1.03 0.52** Max 17
Tuscan Archipelago 9 7 290 I Lepidoptera 67 54.6 0.35 0.88 0.73* Max 22
Tvarminne Archipelago 1 16 < 1 I Carabids 19 8.8 0.28 1.08 0.47** Max 17
Vargskar Archipelago 20 13 2 I Carabids 42 38.6 0.33 1.50 0.74*** Max, Med 17
Wessel Islands 2 37 513 I Ants 74 53.2 0.28 0.96 0.68*** Max, Med 23
Mi
xe
d Dahlak Archipelago 1 26 75 V Birds 38 18.8 0.31 0.70 0.52*** Max, Med 24
Japan 175 10 367,697 V Mammals 55 34.6 0.23 0.28 0.77*** – 25
Appendix 1 Continued
Archipelago I n A G Taxon Sobs SApred Slope Inter. R2 Interval Ref.
Oc
eanic
Azores 1584 9 2435 I Arachnids 172 241.4 0.66 0.15 0.71** Max, Med 27
Azores 1584 9 2435 I Arthropods 1491 1569.4 0.48 1.56 0.89*** Max, Med 27
Azores 1584 6 20,513 I Braconids 14 7.1 0.57 -1.04 0.29 Max, Med 27
Azores 1584 9 2435 I Coleoptera 217 264.1 0.53 0.64 0.69** Max, Med 27
Azores 1584 9 2435 I Hymenoptera 114 103.7 0.64 -0.14 0.77** Max, Med 27
Azores 1584 7 2435 I Ichneumonids 18 33.4 0.85 -1.33 0.55 Max 27
Azores 1584 9 2435 I Land snails 111 89.1 0.21 1.25 0.69** Max 27
Azores 1584 9 2435 I Lepidoptera 104 93.1 0.19 1.33 0.83*** Max 27
Azores 1584 9 2435 P Plants 266 267.4 0.15 1.92 0.64** Max, Med 27
Azores 1584 9 2435 V Vertebrates 78 65.4 0.08 1.55 0.58* Max 27
Canary Islands 96 7 7301 I Arachnids2 775 493.3 0.44 0.98 0.41 Max 28
Canary Islands 96 5 4878 I Arachnids3 683 618.4 0.55 0.75 0.80* Max, Med 28
Canary Islands 96 7 7301 I Arthropods2 6269 4222.7 0.37 2.21 0.34 Max 28
Canary Islands 96 5 4878 I Arthropods3 5679 5959.5 0.52 1.86 0.86* Max, Med 28
Canary Islands 96 7 7301 I Braconids2 55 33.8 0.63 -0.91 0.33 Max, Med 28
Canary Islands 96 5 4878 I Braconids3 51 42 0.78 -1.24 0.47 Max, Med 28
Canary Islands 96 7 7301 I Coleoptera2 1854 980.3 0.22 2.14 0.21 – 28
Canary Islands 96 5 4878 I Coleoptera3 1679 1404.4 0.37 1.80 0.90* – 28
Canary Islands 96 7 7301.3 I Diptera2 983 707.2 0.43 1.19 0.22 Max, Med 28
Canary Islands 96 5 4878 I Diptera3 912 1233.3 0.65 0.68 0.74 Max, Med 28
Canary Islands 96 7 7301 I Hemiptera2 488 378 0.35 1.22 0.41 Max, Med 28
Canary Islands 96 5 4878 I Hemiptera3 440 499.7 0.48 0.91 0.91* Max 28
Canary Islands 96 7 7301 I Hymenoptera2 932 799.6 0.56 0.73 0.47 Max, Med 28
Canary Islands 96 5 4878 I Hymenoptera3 847 1070.7 0.73 0.33 0.75 Max, Med 28
Canary Islands 96 7 7301 I Ichneumonids2 124 63.1 0.27 0.75 0.07 Max, Med 28
Canary Islands 96 5 4878 I Ichneumonids3 120 148.4 0.56 0.11 0.86* Max 28
Canary Islands 96 7 7301 I Insects2 5181 3602.7 0.36 2.15 0.33 Max 28
Canary Islands 96 5 4878 I Insects3 4702 5148.3 0.52 1.78 0.86* Max, Med 28
Canary Islands 96 7 7301 I Land snails2 213 57.9 0.18 1.08 0.09 – 28
Canary Islands 96 5 4878 I Land snails3 182 88 0.33 0.72 0.51 – 28
Canary Islands 96 7 7301 I Lepidoptera2 582 857.8 0.60 0.50 0.51 Max, Med 28
Canary Islands 96 5 4878 I Lepidoptera3 533 847.9 0.73 0.22 0.88* – 28
Canary Islands 96 7 7301 P Plants2 1360 957.5 0.18 2.28 0.32 – 28
Canary Islands 96 5 4878 P Plants3 1245 1169 0.27 2.07 0.90* Max, Med 28
Canary Islands 96 7 7301 V Vertebrates2 96 71.1 0.10 1.47 0.28 – 28
Canary Islands 96 5 4878 V Vertebrates3 84 77.9 0.14 1.37 0.65 Max 28
Cape Verde 568 10 4076 I Arachnids 144 188.9 0.94 -1.11 0.68** Max, Med 29
Cape Verde 568 10 4076 I Arthropods 1379 1474.2 0.62 0.91 0.69** Max, Med 29
Cape Verde 568 10 4076 I Braconids 36 22.9 0.49 -0.31 0.46* Max, Med 29
Cape Verde 568 10 4076 I Coleoptera 419 323.2 0.78 -0.32 0.68** Max, Med 29
Cape Verde 568 10 4076 I Diptera 196 212.9 0.64 0.02 0.58** Max, Med 29
Cape Verde 568 10 4076 I Hemiptera 260 208.8 0.39 0.92 0.55* Max, Med 29
Cape Verde 568 10 4076 I Hymenoptera 183 201.9 0.85 -0.77 0.71** Max, Med 29
Cape Verde 568 10 4076 I Insects 1174 1264.2 0.60 0.94 0.69** Max, Med 29
Cape Verde 568 10 4076 I Land snails 24 29.2 0.45 -0.16 0.53* Max, Med 29
Cape Verde 568 10 4076 I Lepidoptera 139 153 0.66 -0.19 0.44* Max, Med 29
Cape Verde 568 10 4076 P Plants 276 273.1 0.29 1.39 0.78*** Max, Med 29
Cape Verde 568 10 4076 V Vertebrates 55 46.2 0.25 0.77 0.59** Max 29
Chatman Islands 2800 5 975 V Birds 26 27 0.13 1.05 0.96** Max, Med 30
Cook Islands 4400 15 230 V Birds 50 21.1 0.31 0.59 0.36* Max 31
Cook Islands 4400 15 247 P Plants 187 199.5 0.45 1.23 0.82*** Max, Med 32
Fiji 2700 7 16,993 I Ants 113 76.8 0.33 0.50 0.75* Max 33
Futuna and Wallis Islands 3200 6 166 I Ants 21 18.9 0.22 0.78 0.71* Max, Med 34
Galápagos 850 19 7817 I Oribatids 202 111.1 0.22 1.20 0.54*** Max, Med 35
Hawaii 3650 8 16,399 I Braconids 40 27.1 0.34 0.02 0.81** Max, Med 36
Hawaii 3650 10 16,582 I Ichneumonids 53 41.1 0.40 -0.07 0.77*** Max, Med 36
Appendix 1 Continued
Archipelago I n A G Taxon Sobs SApred Slope Inter. R2 Interval Ref.
Hawaii 3650 10 16,397 I Land snails 752 462.2 0.58 0.21 0.93*** Max, Med 38
Hawaii 3650 8 16,885 P Lobeliads 76 62.9 0.73 -1.31 0.67* Max, Med 39
New Zealand 1641 23 267,039 V Birds 60 76.3 0.19 0.87 0.74*** Max, Med 30
Ogasawara Islands 1000 16 71 I Land snails 92 102.8 0.64 0.82 0.79*** Max, Med 40
Solomon Islands 1500 12 23,955 I Sphingidae 38 21.6 0.38 -0.32 0.22 Max, Med 26
I is the smallest distance to the closest source of immigrants (in km), n is the number of islands considered, and A is the sum of their areas (in km2).
G is the kind of taxon studied (V, vertebrates; I, invertebrates; P, plants). The studied data usually refer to all the islands present in the respective reference (Ref.), except when indicated (1all Aegean islands except Crete;2all Canary Islands;3all Canary Islands except Fuerteventura and Lanzarote). S
obsis the
total species richness, and SApredis the richness for the whole archipelago predicted by the ISAR, according to the relationship defined by the slope and
intercept (Inter.) of the regression equation given by the log-log form of the power model. R2is the variability explained by the equation (significant
ISARs are in bold; *P< 0.05; **P < 0.01; ***P < 0.001). Finally, Interval describes whether the archipelago is congruent with its ISAR or not, according to two criteria, the maximum (Max) and median (Med) residual (see text for further details).
The source references (Ref.) for all datasets are as follows: (1) Kryštufek & Kletecˇki (2007); (2) Sfenthourakis (1996); (3) Sfenthourakis et al. (2004); (4) Welter-Schultes & Williams (1999); (5) Panitsa & Tzanoudakis (1998); (6) Fattorini (2002); (7) Trichas et al. (2008); (8) Niemelä (1988); (9) Conroy et al. (1999); (10) Kotze et al. (2000); (11) Mylonas (1982); (12) Dapporto & Dennis (2008); (13) Triantis et al. (2008b); (14) Pandža & Stancˇic´ (2004); (15) Zalewski & Ulrich (2006); (16) Sheremet’ev (2004); (17) Niemelä et al. (1987); (18) Holyoak et al. (2005); (19) Kohn & Walsh (1994); (20) Pandža et al. (2002); (21) Triantis et al. (2005); (22) Dapporto & Cini (2007); (23) Woinarski et al. (1998); (24) Azeria (2004); (25) Millien-Parra & Jaeger (1999); (26) Beck & Kitching (2004–2008); (27) Borges et al. (2005); (28) Izquierdo et al. (2004); (29) Arechavaleta et al. (2005); (30) Williams (1981); (31) Blackburn
et al. (2004); (32) McCormack (2007); (33) Ward & Wetterer (2006); (34) Wilson & Hunt (1967); (35) Schatz (1998); (36) Nishida (2002); (37) Bennett