Study on the growth curve of the internal cavity of ‘Dwarf green’
coconut fruits
1Estudo da curva de crescimento da cavidade interna de frutos de coco anão verde
Thalita Kelen Leal do Prado2*, Taciana Villela Savian3, Tales Jesus Fernandes4 and Joel Augusto Muniz4ABSTRACT - The aim of the work was to evaluate the adjustment of the logistic and gompertz model with structure of
first-order autoregressive errors in the study on the ‘Dwarf green’ coconut fruit growth based on longitudinal and cross-sectional internal cavity diameter data (DLCI and DTCI). Model adjustments showed positive residual autocorrelation, according to the Durbin-Watson test and for both variables, DLCI and DTCI, the residue was modeled according to first-order autoregressive process (AR1). The analysis was performed using the least squares method in the PROC MODEL of the SAS software and results indicated that for both characteristics under study, the logistic model was the most appropriate in describing fruit growth and, according to the model, fully developed ‘Dwarf green’ coconut fruits have longitudinal and cross-sections internal cavity diameter of approximately 7.39 cm and 7.60 cm, respectively.
Key words: Regression. Least squares. Autoregressive errors. Non-linear.
RESUMO - O objetivo do trabalho foi avaliar o ajuste do modelo logístico e gompertz com estrutura de erro autoregressiva
de primeira ordem no estudo do crescimento de frutos de coqueiro anão verde, com base nos dados de diâmetro longitudinal e transversal da cavidade interna (DLCI e DTCI). Os ajustes dos modelos apresentaram autocorrelação residual positiva, de acordo com o teste de Durbin-Watson e para ambas as variáveis, DLCI e DTCI, o resíduo foi modelado segundo um processo autorregressivo de primeira ordem (AR1). A análise foi feita por meio do método de mínimos quadrados no PROC MODEL do programa SAS e os resultados indicaram que para as duas características em estudo, o modelo logístico foi o mais adequado na descrição do crescimento do fruto e de acordo com o modelo, o fruto do coqueiro anão verde, totalmente desenvolvido, tem diâmetro longitudinal e transversal da cavidade interna aproximadamente de 7,39 cm e 7,60 cm, respectivamente.
Palavras-chave: Regressão. Mínimos quadrados. Erros autorregressivos. Não linear.
DOI: 10.5935/1806-6690.20200041 *Author for correspondence
Received for publication 16/11/2015; approved on 04/05/2020
1Parte da dissertação do primeiro autor apresentada ao Programa de Pós-Graduação em Estatística e Experimentação Agropecuária, Universidade
Federal de Lavras/UFLA
2Instituto Federal de Educação, Ciência e Tecnologia do Triângulo Mineiro, Uberaba-MG, Brasil, [email protected] (ORCID ID
0000-0002-1130-251X)
3Departamento de Ciências Exatas, Escola Superior de Agricultura Luiz de Queirós/ESALQ, Universidade de São Paulo/USP, Piracicaba-SP, Brasil,
[email protected] (ORCID ID 0000-0002-3309-6075)
4Departamento de Estatística, Universidade Federal de Lavras/UFLA, Lavras-MG, Brasil, [email protected] (ORCID ID
INTRODUCTION
The genus Cocos consists of species Cocos
nucifera L., which is composed of some varieties, and the
most important are: Typica (Variety ‘Gigante’) and Nana (Variety ‘Anã’), and most coconut hybrids are resulting from crosses between these varieties. In commercial plantations destined for the fresh coconut water market in Brazil, the ‘Anão’ variety predominates, in particular, ‘Dwarf green’ coconut has very tasty liquid albumen and the main purpose of its cultivation is the production of immature (green) fruits for the production of coconut water for fresh consumption (ARAGÃO, 2007; FERREIRA NETO et al., 2011) or for processing by agro-industries. Among “Anã’ coconut varieties, ‘Dwarf green’ is the most tolerant to unfavorable environmental conditions (BENASSI; FANTON; SANTANA, 2013).
The ideal harvesting point of coconut fruits is associated with several indicators related to the plant, fruit and production characteristics. It also depends on certain chemical and sensory properties linked to nutritional, food and human health aspects (ARAGÃO, 2007). According to Cavalini et al. (2006), this point is one of the main factors of post-harvest losses and is most frequently subjectively determined through external color and fruit size, with no consensus standardization among producers.
The growth of most species can be described by a sigmoid curve and, therefore, adjusted by nonlinear models, also known as nonlinear regressions. Such models, when adjusted to weight, diameter, length data and other quantitative characteristics of interest, over time, allow synthesizing a large number of measurements and information in only a few parameters of biological interpretation (FERNANDES et al., 2015, 2019; LIMA
et al., 2017; RIBEIRO et al., 2018a). In this sense, these
statistical models have been widely used in describing growth curves, and in particular, the logistic nonlinear and gompertz models are the most used because they describe sigmoidal growth (AMÂNCIO et al., 2014; CARNEIRO
et al., 2014; FERNANDES; PEREIRA; MUNIZ, 2017;
JANE et al., 2020; MUIANGA et al., 2016; MUNIZ; NASCIMENTO; FERNANDES, 2017; PRADO; SAVIAN; MUNIZ, 2013; RIBEIRO et al., 2018b).
The process of estimating parameters in nonlinear models can be performed using different methods, such as least squares and maximum likelihood methods, considering different correlation structures. When working with growth models, the system of equations is nonlinear, with no explicit solution, requiring iterative processes to obtain parameter estimates. The least squares estimation method is commonly used by the authors in studies applying nonlinear models (BEM et al., 2020; FERNANDES et al., 2015; JANE et al., 2019; PEREIRA
et al., 2014; REZENDE et al., 2020; SOUSA et al.,
2014).
In regression studies, it is common to assume that observations are independent, which is not appropriate when working with time series of data (MORETTIN; TOLOI, 2006). Authors such as Jane et al. (2020), Ribeiro et al. (2018a), Silva et al. (2020) and Sousa
et al. 2014 used structures of first- and second-order
autoregressive errors in their studies, when necessary, and obtained more accurate estimates for parameters in nonlinear models.
Therefore, the aim of this work was to evaluate the adjustment of logistic and gompertz models to longitudinal and cross-sectional internal cavity diameter data (DLCI and DTCI) of ‘Dwarf green’ coconut fruits considering structures of autocorrelated errors and later choose the best model.
MATERIAL AND METHODS
Data used to adjust the model were obtained from an experiment (BENASSI, 2006) in which, among other characteristics, the longitudinal (DLCI) and cross-sectional (DTCI) diameters of ‘Dwarf green’ coconut fruits were measured. The fieldwork was carried out in seven-year-old ‘Dwarf green’ coconut tree orchard (Cocos nucifera L.), installed at the Experimental Citriculture Station of Bebedouro / SP - EECB. Evaluations were performed in eight different plants, marking one inflorescence in each plant based on the measurements of three fruits identified in the apical, median and basal regions of the bunch, aiming at greater sample representativeness, totaling 24 fruits. The first measurement was performed on the day of inflorescence opening and the others every 15 days on marked fruits, totaling 26 measurements. Inflorescences were identified at the time of opening with plastic tape of one meter in length. On each date, the diameters of the 24 fruits were recorded, obtaining means for adjusting the models.
The gompertz and logistic models used to estimate the growth curve parameters, are defined by:
Wi= Aexp{-B exp[-kti]}+ui (1)
Wi= A/1+B exp{-kti}+ui (2)
where: Wi expresses the diameter (cm) of the fruit in the
i-th measurement; A is the model’s asymptotic parameter that corresponds to the maximum diameter value in relation to time; B and k are parameters proportional to
the fruit growth expansion rate, ti refers to the time in
opening; ui = Ø1ui-1+...+Øpui-p+εi, with i = 1, ..., n and n
is the number of fruit measurements; uiis the adjustment
residue in the i-th measurement; Ø1is the first-order
autoregressive parameter; ui-pis the adjustment residue in
time immediately before the i-th measurement; Øp is the
p-order autoregressive parameter; ui-p is the adjustment
residue in p times before the i-th measurement; εiis white
noise with normal distribution N(0,σ2). For the structure of
independent errors, autoregressive parameters will be null
and consequently ui= εi(JANE et al., 2020; PRADO et al.,
2013; SOUSA et al., 2014).
The Durbin-Watson test (DW) was used to assess the existence of residual autocorrelation and tests the null hypothesis that residues are not correlated against the alternative hypothesis that residues follow a first-order autoregressive process (AR1). The test statistics varies in a range of values from 0 to 4, with values close to 0, 2 and 4 indicating presence of positive autocorrelation, no correlation and presence of negative autocorrelation, respectively. The order of the AR process to be adjusted was chosen based on the significance of estimates of autoregressive parameters.
Some authors highlight the importance of selecting models based on scientific principles and there are several approaches used for this purpose such as the Akaike information criterion (AIC), among others. In the present study, the selection of the appropriate model to explain fruit growth was based, in addition to the biological interpretation of parameters, on the quality of adjustments according to the following criteria:
Adjusted determination coefficient R2
aj, given by:
(3)
where: R2is the unadjusted determination coefficient,
n is the number of fruit measurements and q is the
number of model parameters; Akaike criteria:
AIC = 1n(QME)-2(p+1)/n (4)
where: n is the number of observations, QME is the residual mean square and p is the number of model parameters. Residual standard deviation:
DPR = √QME (5)
where: QME is the residual mean square.
Algorithms were implemented in the R statistical software (R DEVELOPMENT CORE TEAM, 2020) and in the PROC MODEL of the Statistical Analysis System software (SAS INSTITUTE, 2014).
RESULT AND DISCUSSION
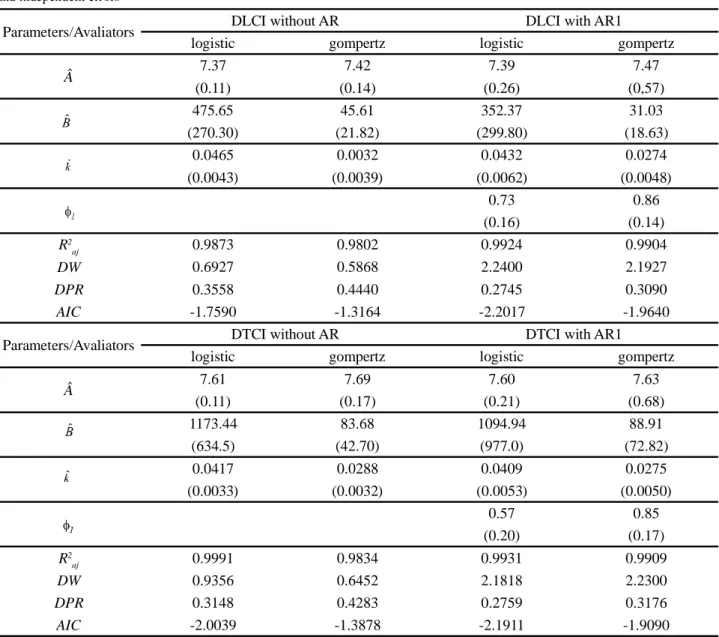
Table 1 shows the estimates of parameters and evaluators of the adjustment quality of logistical and gompertz models for variables longitudinal (DLCI) and cross-sectional internal cavity diameter (DTCI) of ‘Dwarf green’ coconut fruits considering the structures of independent and autoregressive errors.
Firstly, it was found that for the adjustment of models to the longitudinal internal cavity diameter considering the structure of independent errors (DLCI without AR), the DW statistic value was approximately 0.69 for the logistic model and 0.59 for the gompertz model. Both values indicated the presence of positive autocorrelation by the test, indicating the need to consider a first-order autoregressive process (AR1) for the series of residues. In a study on the longitudinal and cross-sectional diameter of pequi fruits, Ribeiro et al. (2018b) found no residual dependence by the Durbin Watson test. Jane et al. (2020), also observed that the best adjustments in the description of the sugarcane growth curve did not consider AR.
For the study on pear length and diameter, Ribeiro et al. (2018a), considered a second-order AR autoregressive process (2). In the present study, when considering the lagged waste vector as a covariate indexed
by the Ø1parameter and proceeding to the joint estimation
of parameters, it appears that the new statistics of the DW test were 2.24 for the logistic model, 2.19 for the gompertz model, and in both cases, according to the test, there was no rejection of the null hypothesis, indicating that now residues are uncorrelated in second order.
The incorporation of the AR1 process in the procedure for adjusting models to DLCI (Table 1) resulted in very small changes in the estimates of model parameters, and the most important change, when compared to model without AR, was verified for the parameter B of models, whose reduction was 26% for the logistic model and 32% for the gompertz model, causing great variability in the estimation of this parameter, as also observed by Prado, Savian and Muniz (2013). Parameter A suffered a small increase of 0.3% for the logistic model and 0.7% for the gompertz model, considering AR1 in the modeling. However, as highlighted by Muniz, Nascimento and Fernandes (2017), incorporating the assumption deviation in the parameter estimation process makes estimates more reliable.
Considering the AR1 structure for DLCI, in relation to the comparison of models, it was found that the adjustment quality evaluators were quite similar, that is, both models presented high values for the adjusted
determination coefficient R2
Parameters/Avaliators DLCI without AR DLCI with AR1
logistic gompertz logistic gompertz
 7.37 7.42 7.39 7.47 (0.11) (0.14) (0.26) (0,57) 475.65 45.61 352.37 31.03 (270.30) (21.82) (299.80) (18.63) 0.0465 0.0032 0.0432 0.0274 (0.0043) (0.0039) (0.0062) (0.0048) 0.73 0.86 (0.16) (0.14) R2 aj 0.9873 0.9802 0.9924 0.9904 DW 0.6927 0.5868 2.2400 2.1927 DPR 0.3558 0.4440 0.2745 0.3090 AIC -1.7590 -1.3164 -2.2017 -1.9640
Parameters/Avaliators DTCI without AR DTCI with AR1
logistic gompertz logistic gompertz
 7.61 7.69 7.60 7.63 (0.11) (0.17) (0.21) (0.68) 1173.44 83.68 1094.94 88.91 (634.5) (42.70) (977.0) (72.82) 0.0417 0.0288 0.0409 0.0275 (0.0033) (0.0032) (0.0053) (0.0050) 0.57 0.85 (0.20) (0.17) R2 aj 0.9991 0.9834 0.9931 0.9909 DW 0.9356 0.6452 2.1818 2.2300 DPR 0.3148 0.4283 0.2759 0.3176 AIC -2.0039 -1.3878 -2.1911 -1.9090
Akaike criterion (AIC). In this variable, the logistic model presented the highest adjusted determination coefficient and low values for the AIC criterion, as well as for the residual standard deviation DPR, thus being the most suitable for the description of this characteristic, corroborating Muniz, Nascimento and Fernandes (2017), who also indicated the logistic model as the most appropriate to describe the diameter growth curve of cocoa fruits.
Regarding the adjustment of logistic and gompertz models to cross-sectional internal cavity diameter data (DTCI) of coconut fruits, considering the structure of independent errors, it was found that the DW statistic value was 0.94
Table 1 - Estimates of parameters (asymptotic standard error) of nonlinear logistic and gompertz models to longitudinal (DLCI) and
cross-sectional internal cavity diameter (DTCI) data of ‘Dwarf green’ coconut fruits considering the structure of AR1 autoregressive and independent errors
for the logistic model and 0.65 for the gompertz model. Both indicated the presence of positive autocorrelation in both models and, therefore, an AR process was considered. Similar results were obtained by Prado, Savian and Muniz (2013), and by Prado et al. (2013), evaluating the growth of the longitudinal and cross-sectional external diameter of ‘Dwarf green’ coconut fruits.
Analogously to the DLCI variable, for the DTCI variable, it was necessary to adjust models considering the AR1 autoregressive structure so that the new DW test statistics (2.18 for the logistic model and 2.23 for the gompertz model) indicate the non-rejection of the null hypothesis of waste independence.
Again for the DTCI variable as reported by Muniz, Nascimento and Fernandes (2017), the incorporation of the AR1 process in the adjustment procedure of models makes estimates more reliable, verifying small changes when compared to model without AR (Table 1). There was a small decrease in parameters A and k for the logistic and gompertz models, with values of 0.1% and 0.8% for parameter A, 3% and 5% for parameter k, respectively. On the other hand, parameter B suffered a decrease of 7% for the logistic model and an increase of 6% for the gompertz model, approximately.
The evaluators of the adjustment quality of models to the DTCI of fruits, similarly to DLCI, demonstrated good adjustment of both models. For DTCI, the logistic model also showed the highest adjusted determination coefficient and lower values for DPR and AIC, which is the best model for describing this characteristic (Table 1). Studying the growth of Asian pear, Ribeiro et al. (2018a), also found the best results using the Logistics model with AR.
The adjustment of the logistic model to longitudinal and cross-sectional internal cavity diameter data of ‘Dwarf green’ coconut fruits, considering the adequate residual structure (AR1) can be seen in Figure 1.
Regarding the stabilization of diameters, it appears that DLCI starts to stabilize around 345 days (11 and a
half months) after inflorescence opening, when fruits have estimated value of 7.39 cm. On the other hand, DTCI begins to stabilize at around 330 days (11 months) and at that time, fruits have estimated value of 7.60 cm (Figure 1). Prado, Savian and Muniz (2013) studied ‘Dwarf green’ coconut fruits and found that the external longitudinal diameter begins to stabilize around 300 days (10 months) after inflorescence opening, when fruits have estimated value of 21.56 cm and the external cross-sectional diameter begins to stabilize at around 270 days (9 months) and at that time, fruits have estimated value of 15.35 cm. Therefore, longer time is required for the stabilization of DLCI and DTCI internal cavity diameters in relation to longitudinal and cross-sectional external diameters obtained by Prado, Savian and Muniz (2013). These results may assist producers in defining the most appropriate harvesting point.
In the study by Ferreira Neto et al. (2011), on the growth and production of ‘Dwarf green’ coconut fruits fertigated with nitrogen and potassium, with production aimed at the consumption of fresh coconut water, fruits were harvested green, with approximately 7 months of formation after inflorescence opening. From 7 months after complete inflorescence opening, fruits were harvested at an interval of 21 days. In the work of Resende et al. (2002), the authors reported that green coconut presents ideal harvesting point when water has already developed
Figure 1 - Observed and estimated values using the logistic model, of longitudinal internal cavity diameter (DLCI) and cross-sectional
all the sensory characteristics that make it suitable for consumption. The harvesting point is determined by the association of morphological indicators related to fruit age or size, or even, to the count of leaves in the plant and water-related chemicals. Benassi et al. (2007), studied ‘Dwarf green’ coconut fruits and recommended harvesting at 8.5 months of age, considering the desirable properties such as taste and water volume. Resende et al. (2002), reported that when production is intended for fresh coconut water consumption, it must be harvested between six and seven months of age.
CONCLUSION
The adjustment of logistic and gompertz models to longitudinal and cross-sectional internal cavity diameter data (DLCI and DTCI), considering the first order autoregressive structure for residues is adequate, resulting in estimates of parameters consistent with literature values. According to methodology used in the adjustment procedure, the logistic model is more suitable to describe the growth of the internal cavity of ‘Dwarf green’ coconut fruits.
REFERENCES
AMÂNCIO, A. L. de L. et al. Use of mathematical models in the study of bodily growth in GIFT strain Nile tilapia. Revista
Ciência Agronômica, v. 45, n. 2, p. 257-266, 2014.
ARAGÃO, W. M. Colheita e pós-colheita do coco. In: FONTES, H. R.; FERREIRA, J. M. S.; SIQUEIRA, L. A. (ed.). A cultura
do coqueiro. Aracaju: Embrapa Tabuleiros Costeiros, 2007.
(Embrapa Tabuleiros Costeiros. Sistemas de Produção, 1). BEM, C. M. de et al. Univariate and multivariate nonlinear models in productive traits of the sunn hemp. Revista Ciência
Agronômica, v. 51, n. 1, e20196673, 2020.
BENASSI, A. C. Caracterizações biométricas, química e
sensorial de frutos de coqueiro variedade anã verde. 2006.
49 f. Tese (Doutorado em Produção Vegetal) - Universidade Estadual Paulista “Júlio de Mesquita Filho”, Jaboticabal, 2006. BENASSI, A. C. et al. Caracterização biométrica de frutos de coqueiro, Cocos nucifera L. variedade anã-verde, em diferentes estádios de desenvolvimento. Revista Brasileira de
Fruticultura, v. 29, n. 2, p. 302-307, 2007.
BENASSI, A. C.; FANTON, C. J.; SANTANA, E. N. de. O
cultivo do coqueiro-anão-verde: tecnologias de produção.
Vitória, ES: Incaper, 2013. 120 p. il. (Incaper. Documentos, 227).
CARNEIRO, A. P. S. et al. Identidade de modelos não lineares para comparar curvas de crescimento de bovinos da raça Tabapuã. Pesquisa Agropecuária Brasileira, v. 49, n. 1, p. 57-62, 2014.
CAVALINI, F. C. et al. Maturity indexes for ‘Kumagai’ and ‘Paluma’ guavas. Revista Brasileira de Fruticultura, v. 28, n. 2, p. 176-179, 2006.
FERNANDES, F. A. et al. Growth curves of meat-producing mammals by von Bertalanffy’s model. Pesquisa Agropecuária
Brasileira, v. 54, e01162, 2019.
FERNANDES, T. J. et al. Parametrization effects in nonlinear models to describe growth curves . Acta Scientiarum.
Technology, v. 37, n. 4, p. 397-402, 2015.
FERNANDES, T. J.; PEREIRA, A. A.; MUNIZ, J. A . Double sigmoidal models describing the growth of coffee berries.
Ciência Rural, v. 47, n. 8, e20160646, 2017.
FERREIRA NETO, M. et al. Crescimento e produção de coqueiro anão verde fertigado com nitrogênio e potássio.
Revista Brasileira de Engenharia Agrícola e Ambiental,
v. 15, n. 7, p. 657-664, 2011.
JANE, S. A. et al. Adjusting the growth curve of sugarcane varieties using nonlinear models. Ciência Rural, v. 50, n. 3, e20190408, 2020.
JANE, S. A. et al. Comparison of polynomial and nonlinear models of description of pepper growth. Revista Brasileira de
Ciências Agrárias, v. 14, n. 4, e7180, 2019.
LIMA, K. P. et al. Nonlinear models for use in description of Boron accumulation in di erent parts of Jalo beans. Revista
Brasileira de Biometria, v. 35, n. 4, p. 834-861, 2017.
MORETTIN, P. A.; TOLOI, C. M. C. Análise de séries
temporais.2. ed. São Paulo: Edgard Blücher, 2006. 538 p.
MUIANGA, C. A. et al. Descrição da curva de crescimento de frutos do cajueiro por modelos não lineares. Revista Brasileira de Fruticultura, v. 38, n. 1, p. 22-32, 2016.
MUNIZ, J. A.; NASCIMENTO, M. S.; FERNANDES, T. J. Nonlinear models for description of cacau fruit growth with assumption violations. Revista Caatinga, v. 30, n. 1, p. 250-257, 2017.
PEREIRA, et al. Descrição do crescimento vegetativo do cafeeiro cultivar Rubi MG 1192, utilizando modelos de regressão. Coffee Science, v. 9, n. 2, p. 263-271, 2014. PRADO, T. K. L. do et al. Ajuste do modelo logístico na descrição do crescimento de frutos de coqueiro anão por meio de algoritmos iterativos MCMC. Revista Brasileira de Biometria, v. 31, n. 2, p. 216-232, 2013.
PRADO, T. K. L. do; SAVIAN, T. V.; MUNIZ, J. A.Ajuste dos modelos Gompertz e Logístico aos dados de crescimento de frutos de coqueiro anão verde. Ciência Rural, v. 43, n. 5, p. 803-809, 2013.
R DEVELOPMENT CORE TEAM. R: a language and environment for statistical computing. Vienna, 2020. Disponível em: http://www.R-project.org. Acesso em: 26 abr. 2020. RESENDE, J. M. et al. Colheita e manuseio pós-colheita. In: ARAGÃO , W. M. (ed.). Coco pós colheita. Brasília: Embrapa, 2002, p. 35-41. (Série Frutas do Brasil, 29).
REZENDE, B. R. et al. Modeling the Growth of Forage Legumes. Journal of Agricultural Science, v. 12, n. 5, p. 139-144, 2020.
RIBEIRO, T. D. et al. Description of the growth of pequi fruits by nonlinear models. Revista Brasileira de Fruticultura, v. 40, n. 4, e949, 2018b.
RIBEIRO, T. D. et al. The use of the nonlinear models in the growth of pears of ‘Shinseiki’ cultivar. Ciência Rural, v. 48, n. 1, e20161097, 2018a.
SAS INSTITUTE. SAS procedures guide for computers. 6. ed. Cary: NC, 2014. v. 3, 373p.
SILVA, É. M. da et al. Description of blackberry fruit growth by nonlinear regression models. Revista Brasileira de Fruticultura, v. 42, n. 2, e-177, 2020.
SOUSA, I. F. et al. Fitting nonlinear autoregressive models to describe coffee seed germination. Ciência Rural, v. 44, n. 11, p. 2016-2021, 2014.