Rev. Caatinga
EFFECT OF ROOSTER TREE GREEN MANURE ON CARROT AND LETTUCE
INTERCROPPING SYSTEM
1RICARDO CARLOS PEREIRA DA SILVA2*, FRANCISCO BEZERRA NETO2, MAIELE LEANDRO DA SILVA3, AURÉLIO PAES BARROS JÚNIOR2, ANTÔNIO EWERTON DA SILVA ALMEIDA2, FLAVIANA DE ANDRADE
VIEIRA2
ABSTRACT - Intercropping is a cropping system that involves cultivating two or more crops in the same area with different cycles and vegetative architectures. One of the ways to increase productivity and efficiency in this cropping system is through green manuring and by properly considering crop combinations, cultivation timing, and planting configuration of the component crops. Thus, the aim of this study was to evaluate the productive performance of carrot and lettuce intercropping systems under different amounts of rooster tree biomass incorporated into the soil and under different spatial arrangements. The study was conducted at the experimental farm Rafael Fernandes, RN, Brazil, in the period from September 2012 to January 2013, in an experimental design of randomized complete blocks in a 4 x 3 factorial scheme, with twelve treatments and 3 replicates. The treatments consisted of the combination of four rooster tree biomass amounts incorporated into the soil (10, 25, 40 and 55 t ha-1 on a dry basis) with three predetermined spatial arrangements between the component crops (2:2, 3:3 and 4:4), which correspond to the rows of carrot alternating with the rows of lettuce. The agronomic performance of the carrot and lettuce intercropping system was optimized in the amount of approximately 46.36 t ha-1 of rooster tree incorporated into the soil. There was no influence of the spatial arrangements on the agronomic efficiency of the carrot and lettuce intercropping. The use of rooster tree as green manure is agronomically viable in intercropped systems of carrot and lettuce.
Keywords: Daucus carota. Lactuca sativa. Calotropis procera. Intercropping. Organic fertilization.
EFEITO DO ADUBO VERDE FLOR-DE-SEDA NO SISTEMA CONSORCIADO DE CENOURA E
ALFACE
RESUMO – A consorciação de culturas é um sistema de cultivo que envolve o cultivo de duas ou mais culturas na mesma área com diferentes ciclos e arquiteturas vegetativas. Uma das maneiras de aumentar a produtividade e a eficiência neste sistema de cultivo é através de adubação verde e considerando adequadamente as combinações de culturas, o tempo e a configuração de plantio das culturas componentes. Assim, o objetivo deste estudo foi avaliar o desempenho produtivo de sistemas consorciados de cenoura e alface em diferentes quantidades de biomassa de flor-de-seda incorporadas no solo e em diferentes arranjos espaciais. O estudo foi realizado na fazenda experimental Rafael Fernandes, RN, Brasil, no período de setembro de 2012 a janeiro de 2013, em um delineamento experimental de blocos completos casualizados, em esquema fatorial 4 x 3, com doze tratamentos e 3 repetições. Os tratamentos consistiram da combinação de quatro quantidades de biomassa de flor-de-seda incorporadas no solo (10, 25, 40 e 55 t ha-1 em base seca) com quatro arranjos espaciais predeterminados entre as culturas componentes (2:2, 3:3 e 4:4), que correspondem às fileiras de cenoura alternadas com as fileiras de alface. O desempenho agronômico do sistema de consórcio de cenoura e alface foi otimizado na quantidade de aproximadamente 46.36 t ha-1 de flor
-de-seda incorporada no
solo. Não houve influência dos arranjos espaciais sobre a eficiência agronômica do consórcio de cenoura e alface. O uso da flor-de-seda como adubo verde é agronomicamente viável em sistemas consorciados de cenoura e alface.
Palavras-chave: Daucus carota. Lactuca sativa. Calotropis procera. Associação de culturas. Adubação
orgânica. ____________________
*Corresponding author
1Received for publication in 08/06/2016; accepted in 05/24/2017.
Paper extracted from the doctoral thesis of the first author.
2Department of Plant Sciences, Universidade Federal Rural do Semi-Árido, Mossoró, RN, Brazil; [email protected] – ORCID:
0000-0003-1815-5513, [email protected] – ORCID: 0000-0001-9622-206X, [email protected] – ORCID: 0000-0002-6983 -8245, [email protected] – ORCID: 0000-0002-9707-6516, [email protected] – ORCID: 0000-0001-5902
-6254.
3Department of Agronomy, Universidade Estadual de Mato Grosso do Sul, Aquidauana, MS, Brazil; [email protected] –
INTRODUCTION
The practice of intercropping carrot with lettuce is beginning to be adopted in the Northeastern region of Brazil, as this system deals with the growth of two or more different cultures, with different plant architecture and root system, being able to be explored simultaneously in the same area. Intercropping systems, in addition to increasing unit productivity, also operates efficiently by combining optimal use of space, nutrients and sunlight, and mutual benefits including protection from pests and diseases (PIVETTA et al. 2007; SILVA et al., 2011). In general, intercropping is challenging as it requires planning on how the crops should be associated, especially with regard to crop management, and maximizing the use of land and environmental resources (ALMEIDA et al., 2015).
The arrangement of two or more species is possible due to the different requirements of the intercropped crops, such as competition among plants for light, CO2, water and mineral nutrients (TÁVORA; SILVA; BLEICHER, 2007). The competition depends on the species involved, their root systems and the availability of water and nutrients (COSTA; SILVA, 2008).
The combination of this management and the use of green manuring have been shown to be practical and an efficient alternative for nutrient supply and the addition of organic matter to the soil directly in the growing area. Legumes are among the plants used as green manures; they produce a large amount of biomass and are able to associate with the nitrogen-fixing bacteria that make nitrogen available for species of commercial interest (SANTOS; SEDIYAMA; PEDROSA, 2013).
The use of biomass of plants of spontaneous species of the Caatinga biome as green manure has been an important option of agricultural production to establish a balance between the demand for higher productivity and the resource drain from the environment (BEZERRA NETO et al., 2014).
Among the plants of spontaneous species of the Caatinga used in green fertilization in horticultural crops is the rooster tree [Calotropis
procera (Ait). R. Br.], belonging to the family of
Apocynaceae, popularly known as rooster tree. This plant, besides being very prolific, has a capacity to supply biomass throughout the year, even in times of drought, which is a key advantage over several native and naturalized species of the Caatinga biome (ALMEIDA et al., 2015). It is worth mentioning that its tissue has high concentrations of N, P and K, and can reach values up to 22.7, 10.0 and 28.9 g kg-1, respectively (SILVA et al., 2013). This species has shown promising results in crops of arugula (LINHARES et al., 2009), carrot (SILVA et al., 2013), coriander (LINHARES et al., 2014) and in a lettuce and arugula intercropping system (ALMEIDA et al., 2015) as well.
In order to provide support research on intercropping systems among vegetable crops fertilized with spontaneous species of Caatinga, this study aimed to evaluate the performance of carrot and lettuce intercropping treated with different biomass amounts of rooster tree incorporated into the soil and at different spatial arrangements.
MATERIAL AND METHODS
The study was conducted at the Rafael Fernandes Experimental Farm of the Universidade Federal Rural do Semi-Arid (UFERSA), located in the district of Alagoinha, Mossoró-RN (5º 11' S and 37º 20' W, 18 m altitude), Brazil, from September 2012 to January 2013. The climate of the region is semi-arid and, according to the Köppen climate classification scheme, is designated as ‘BShw’, dry and very hot, with two seasons: a dry season, which usually runs from June to January; and a rainy season, from February to May (ALMEIDA et al., 2015). During the experimental period, the maximum temperature was between 32.1 - 34.5 °C and minimum temperature was between 21.3 - 23.7 °C, respectively; mean air relative humidity was 67%; mean wind speed was 4 m s-1; mean radiation was 25 mjm2; rainfall was 0 mm; mean atmospheric pressure was 1012 hPa and mean dew point temperature was 19 °C. The climate is therefore, characterized as tropical and semiarid.
The soil of the experimental area is classified as dystrophic yellow-red oxisol (EMBRAPA, 2009). Prior to installation of the experiment, 20 soil samples were collected at 0-20 cm depth and then homogenized to obtain a composite sample, which was processed and analyzed at the soil, water and plant analysis laboratory of the Department of Environmental Sciences of UFERSA. Soil testing results were as follows: pH (water) = 6.45; Organic
matter = 6.45 g kg-1; N = 0.45 g kg-1; P = 3.4 mg dm-3; (H + Al) = 0.00 cmolc dm-3; K+ = 0.18 cmolc dm-3; Ca2+ = 1.85 cmolc dm-3; Mg2+ = 0.37 cmolc dm-3; Na+ = 0.11 cmolc dm-3;
Sum of bases = 2.48 cmolc dm-3; Cation exchange capacity at pH7 = 2.48 cmolc dm-3; Base saturation = 100%, and Electrical conductivity = 0.14 dS m-1.
The rooster tree used as green manure was collected in an area of the rural zone of the municipality of Mossoró (RN) before the initiation of flowering. After harvesting, the plants were crushed into pieces of 2–3 cm and placed to dry at room temperature until they reached a moisture content of 10%. Samples of this green manure were taken randomly for chemical composition and the results were: N = 29.58 g kg-1; P = 4.08 g kg-1; K = 50.09 g kg-1 and C:N ratio of 20:1.
Rev. Caatinga
complete blocks, with treatments arranged in a 4 x 3 factorial scheme, with 3 replicates. The first
factor was constituted by the amounts of rooster tree
biomass incorporated in the soil (10, 25, 40, and 55 t ha-1 in dry basis) and the second factor by the
spatial arrangements used between the component cultures (2:2, 3:3 and 4:4), which correspond to the rows of carrot alternated with the rows of lettuce.
Carrot and lettuce were planted in alternate rows according to the spatial arrangement. The total area of the plot in the 2:2 arrangement was 1.92 m2, which was formed by alternating double rows of the
crops, flanked by two border-rows of each, carrot and lettuce, with a harvest area of 0.80 m2
containing 40 plants of carrot in a spacing of 0.20 m x 0.05 m, and 20 lettuce plants in a spacing
of 0.20 m x 0.10 m. The arrangement 3:3 constituted of alternating triple rows of vegetable crops, flanked by the same border-rows as in 2:2 arrangement with a total plot area of 2.40 m2 and a harvest area of 1.20 m2 containing 60 carrot plants at a spacing of 0.20 m x 0.05 m and 30 lettuce plants at a spacing of 0.20 m x 0.10 m. The 4:4 arrangement composed of alternating four rows of vegetables, flanked by the same border rows as in the 2:2 configuration. The total area of the plot was 2.88 m2 and a harvest area of 1.60 m2 containing 80 carrot plants at a spacing of 0.20 m x 0.05 m and 40 lettuce plants at a spacing of 0.20 m x 0.10 m.
The soil preparation at the site consisted of manual cleaning of the area with hoe, harrowing and construction of the beds. Prior to initiation of the experiment, a soil solarization was performed on the beds with a 30 micron transparent plastic for 45 days, in order to reduce the population of
nematodes and soil phytopathogen.
Irrigation was provided twice daily (morning and afternoon) through a micro sprinkler system providing a water layer of approximately 8 mm dia-1, in order to favor soil microbial activity. Weeds were removed manually.
In each experimental unit of the intercropping, rooster tree was incorporated in two different levels at 50% dry weight basis. The first amount was applied at 20 days before sowing carrot and transplanting the first lettuce crop, while the second was at 55 days after sowing carrot and before transplanting the second lettuce crop.
The lettuce seedlings were produced by a local vegetable grower, sown on September 5, 2012 at 20 days before transplanting to the experimental area in expanded polystyrene trays (128 cells) on September 25, 2012, and planted in the experimental field. The same procedure was used for the second crop of lettuce, with the sowing date being November 24, 2012, 60 days of the experimental period, and on December 14, 2012 at 80 days transplantation to experimental field of the second lettuce crop. Four seeds per cell were sown in a tray and thinning was performed 12 days after sowing
leaving one seedling per cell. During this period of seedling growth they were conditioned to the open environment and covered with a 40% black shading screen. The "Tainá" cultivar of lettuce suitable for warm season production with favorable characteristics such as crisp head or iceberg, uniform, vigorous with good butt cover and an excellent taste was used (SEMENTES SAKATA, 2016).
Carrot sowing was carried out on September 25, 2012, by placing 3 to 4 seeds per hole and thinning was done 20 days after planting on October 14, 2012 leaving one plant per hole. The cultivar Brasília, suitable for summer cultivation, has vigorous foliage with dark green coloration, dark orange pigmentation in roots, low incidence of green or purple shoulder and good resistance to leaf-blight. Sowing is typically from October to February, in the Midwest, North and Northeast regions of Brazil, and recommended for semi-arid Northeastern Brazilian (LOPES et al., 2008).
Harvesting of the first lettuce crop was performed on October 23, 2012 and the second crop was harvested on January 13, 2013, at 28 days after transplanting in the experimental area. The carrot harvest was performed on January 3, 2013, at 100 days after sowing. In the lettuce culture, the evaluations were carried out on 5 plant samples and for carrot, 20 plants were randomly collected within the harvest area of each plot and evaluated.
For carrot, the characteristics evaluated were: plant height (cm), from the ground level to the tip of the highest leaf, determined using a scaled ruler, dry masses of shoots and roots were determined in a forced air oven at 65 °C until it reached a constant weight, expressed as t ha-1. Classified productivity of roots was obtained according to the length and the greatest transverse diameter in: longs, with lengths of 17 to 25 cm and diameter smaller than 5 cm; means, with length of 12 to 17 cm and diameter greater than 2.5 cm; shorts, with length 5 to 12 cm and diameter larger than 1 cm, and scrap, roots that did not fit the previous measurements (LANA; VIEIRA, 2000; LOPES et al., 2008). Quality screening commercial productivity was performed by examining the roots and selecting roots free of cracks, bifurcations, nematodes, and mechanical damages. The total productivity of roots was the sum of economic productivity and scrap, expressed in t ha-1.
drying them in a forced air oven at 65 °C until they reached a constant weight (also expressed in t ha-1).
The efficiency of the intercropping system was determined by the score of the canonical variable, obtained through the bivariate analysis of variance of the yields of carrot and lettuce.
We performed univariate analyzes of variance on the variables studied using the statistical package SISVAR (FERREIRA, 2011) for the randomized complete block design with treatments arranged in a factorial scheme. The Tukey test at the 5% probability level was used to compare the means between the spatial arrangements. Regression analysis was also performed to evaluate the behavior of each characteristic as a function of the biomass amounts of rooster tree used, and the response curve fitting procedures between each variable and the amounts of rooster tree incorporated into the soil were performed through the Table Curve software (JANDEL SCIENTIFIC, 1991).
RESULTS AND DISCUSSION
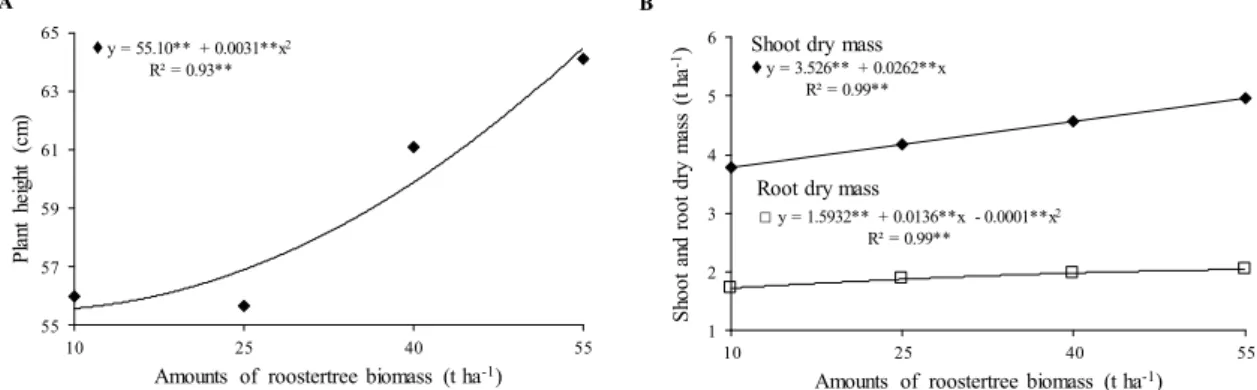
From the regression analysis it can be observed that there was no significant interaction between the amounts of rooster tree biomass incorporated in the soil and the spatial arrangements for the variables analyzed, namely, plant height, shoot dry mass, root dry mass, productivity of long, medium, short and scrap roots, and productivity of commercial and total roots (Figures 1 and 2). However, we observed an increase in plant height (9.07 cm), dry mass of shoots (1.18 t ha-1) and roots (0.32 t ha-1) for carrot, particularly between treatments with the lowest and highest amount of rooster tree biomass added to the soil (Figures 1A and 1B). The highest values recorded for these attributes were 64.48 cm, 4.97 and 2.04 t ha-1, respectively, as expected, in the highest amount of green manure added to the soil (55 t ha-1).
♦y = 55.10** + 0.0031**x2 R² = 0.93**
55 57 59 61 63 65
10 25 40 55
P
la
nt
h
ei
gh
t
(c
m
)
Amounts of roostertree biomass (t ha-1)
A
♦y = 3.526** + 0.0262**x R² = 0.99**
□y = 1.5932** + 0.0136**x - 0.0001**x2 R² = 0.99**
1 2 3 4 5 6
10 25 40 55
S
hoot
a
nd
root
dr
y
m
as
s
(t
h
a
-1)
Amounts of roostertree biomass (t ha-1)
B
Shoot dry mass
Root dry mass
Figure 1. Plant height (A), shoot and root dry mass (B) of carrot intercropped with lettuce as a function of amounts of rooster tree biomass incorporated into the soil.
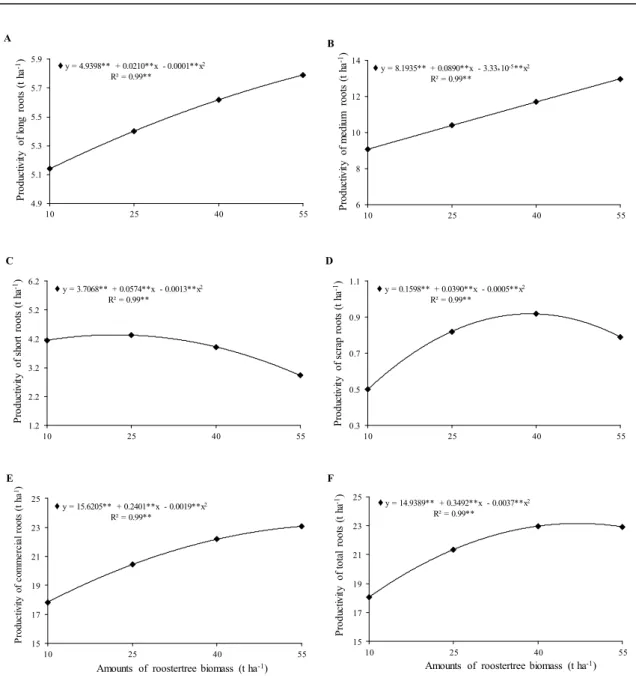
The productivities of long, medium and commercial-grade roots had an ascendant relationship to rooster tree biomass. In other words, the yield of roots increased with increasing amounts of rooster tree biomass incorporated into the soil (Figures 2A, 2B and 2E). The maximum values for these productivities were 5.79 (long); 12.99 (medium) and 23.08 (commercial) t ha-1, respectively, obtained with addition of 55 t ha-1 of the green manure. On the other side, the productivities of short, scrap and total roots increased up to the maximum values of 4.34 (short); 0.92 (scrap) and 23.18 (total roots) t ha-1, with the following amounts of rooster tree biomass addition, 22.06, 38.97 and 47.05 t ha-1, respectively, and then decreasing up to the final dose of biomass addition to the soil (Figures 2C, 2D and 2F).
For the above-described characteristics evaluated in the carrot, no effect of spatial arrangements was observed, except for the medium root productivity, which was significant in the 2:2
arrangement (yield 11.87 t ha-1) in comparison to the 3:3 (Table 1) configuration. These results indicate that there was practically no antagonistic interference in the spatial arrangements in the carrot -lettuce intercropping system.
This increase in medium root productivity is due in part to increasing amounts of rooster tree biomass and benefits of the manuring, days prior to planting, thus providing nutrients that can be easily absorbed and accumulated by the plants (SILVA et al., 2015). The C:N ratio of 17: 1 of the rooster tree makes it easy to decompose rapidly and consequently, release nitrogen in a form that can be easily taken up by the plants (BATISTA et al., 2013).
Rev. Caatinga ♦y = 4.9398** + 0.0210**x - 0.0001**x2
R² = 0.99**
4.9 5.1 5.3 5.5 5.7 5.9
10 25 40 55
P rodu ct ivi ty of l on g root s (t h a
-1) ♦y = 8.1935** + 0.0890**x - 3.33*10-5**x2
R² = 0.99**
6 8 10 12 14
10 25 40 55
P rodu ct ivi ty of m edi um root s (t h a -1) B
♦y = 3.7068** + 0.0574**x - 0.0013**x2 R² = 0.99**
1.2 2.2 3.2 4.2 5.2 6.2
10 25 40 55
P rodu ct ivi ty of s hor t root s (t h a -1) C
♦y = 0.1598** + 0.0390**x - 0.0005**x2 R² = 0.99**
0.3 0.5 0.7 0.9 1.1
10 25 40 55
P rodu ct ivi ty of s cr ap root s (t h a -1) D
♦y = 15.6205** + 0.2401**x - 0.0019**x2 R² = 0.99**
15 17 19 21 23 25
10 25 40 55
P ro d u c ti v it y o f c o m m e rc ia l ro o ts (t h a 1)
Amounts of roostertree biomass (t ha-1)
E
♦y = 14.9389** + 0.3492**x - 0.0037**x2 R² = 0.99**
15 17 19 21 23 25
10 25 40 55
P rod uc tivi ty of t ot al r oo ts ( t ha -1)
Amounts of roostertree biomass (t ha-1)
F A
Figure 2. Productivity of long (A), medium (B), short (C), scrap (D), commercial (E), and total (F) roots of carrot intercropped with lettuce as a function of amounts of rooster tree biomass incorporated into the soil.
The ascendant responses and the optimization of the variables can be attributed to the law of maximum, where the excess of a nutrient in the soil
can cause toxic effect and/or decrease the effectiveness of others, leading to reduced production (ALMEIDA et al., 2015).
Table 1. Plant height (PH), shoot dry mass (SDM), root dry mass (RDM), productivities of roots long (L), medium (M), short (S), scrap (Sc), commercial (C), and total (T) of carrot intercropped with lettuce as a function of the spatial arrangements. Spatial arrangements PH (cm) SDM (t ha-1)
RDM (t ha-1)
L (t ha-1)
M (t ha-1)
S (t ha-1)
Sc (t ha-1)
C (t ha-1)
T (t ha-1) 2:2 58.11 a* 4.25 a 1.80 a 6.26 a 11.87 a 3.41 a 0.60 a 21.37 a 21.97 a 3:3 60.26 a 4.19 a 1.86 a 5.49 a 10.04 b 3.85 a 0.82 a 20 41 a 21.07 a 4:4 61.71 a 4.53 a 1.92 a 4.71 a 11.22 ab 4.40 a 0.67 a 20.13 a 20.80 a
There was significant interaction between planting times and spatial arrangements with regards to plant height and interaction between times and amounts of rooster tree biomass applied on lettuce productivity (Table 2 and Figure 3E). By analyzing the spatial arrangements adopted for each planting time, we concluded that there was no significant difference in plant height in the different spatial arrangements used for lettuce. On the other hand,
when studying the planting times within each spatial arrangement, we noticed significant differences in plant height, particularly, in the 2:2 and 3:3 spatial arrangements, where the means of plant height for the first planting time were different from the second (Table 2). These taller lettuce heights from the first planting are likely due to the minimal inter- and intra-specific competition between the component cultures in relation to the arrangement.
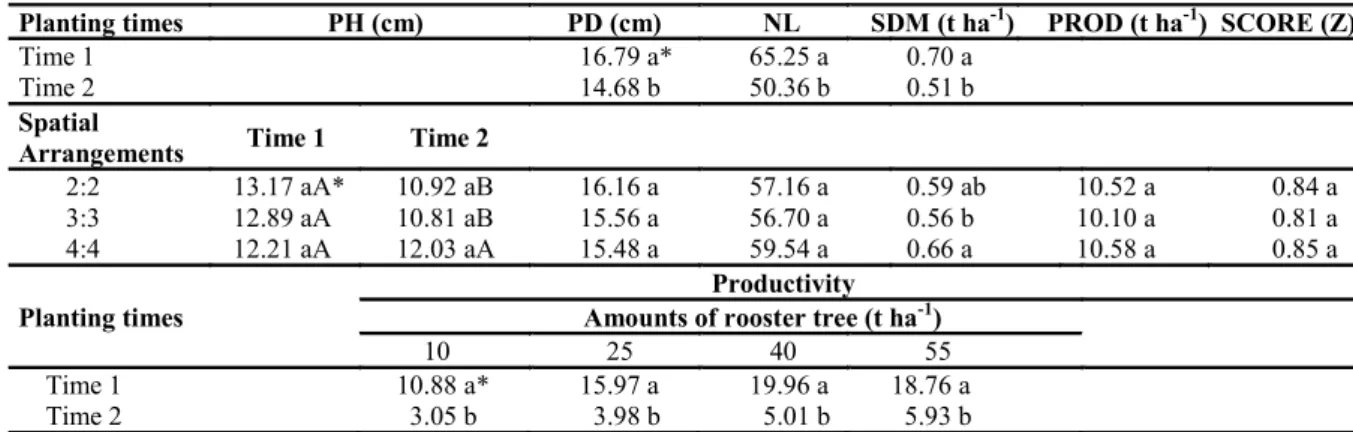
Table 2. Plant diameter (PD), number of leaves per plant (NL), shoot dry mass (SDM), productivity (PROD), score (Z) of the canonical variable, and plant height (PH) of lettuce intercropped with carrot as a function of the spatial arrangements and planting times.
Planting times PH (cm) PD (cm) NL SDM (t ha-1) PROD (t ha-1) SCORE (Z)
Time 1 16.79 a* 65.25 a 0.70 a Time 2 14.68 b 50.36 b 0.51 b
Spatial
Arrangements Time 1 Time 2
2:2 13.17 aA* 10.92 aB 16.16 a 57.16 a 0.59 ab 10.52 a 0.84 a 3:3 12.89 aA 10.81 aB 15.56 a 56.70 a 0.56 b 10.10 a 0.81 a 4:4 12.21 aA 12.03 aA 15.48 a 59.54 a 0.66 a 10.58 a 0.85 a
Planting times
Productivity Amounts of rooster tree (t ha-1)
10 25 40 55 Time 1 10.88 a* 15.97 a 19.96 a 18.76 a Time 2 3.05 b 3.98 b 5.01 b 5.93 b
*Means followed by the same lowercase letters in the column and upper case in the row do not differ from each other by the Tukey Test at the 5% probability level.
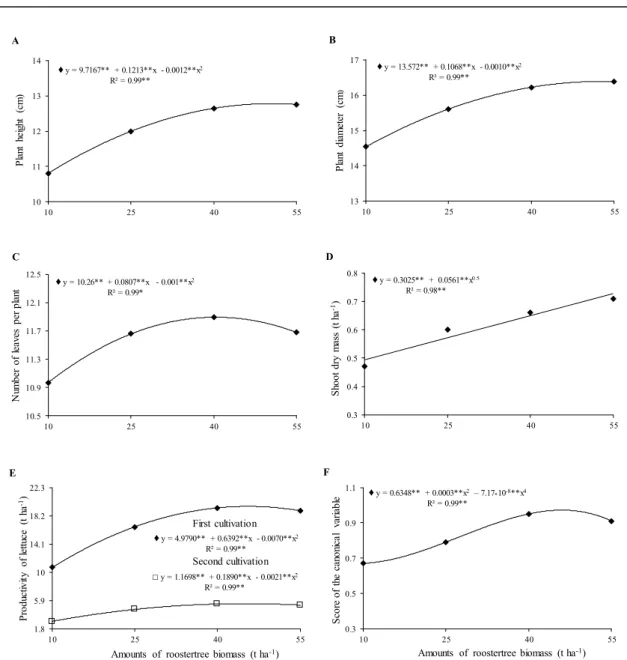
Regarding the diameter, leaf number per plant and dry mass of the lettuce shoots, a significant difference due to lettuce planting times was observed, with a higher average value for Time 1 (Table 2). On the other hand, plant height, diameter, and number of leaves per lettuce plant increased with the increasing amounts of rooster tree biomass up to the values of 12.24 cm, 16.42 cm and 11.9 leaves per plant, in the amounts of 50.55; 52.84 and 40.37 t ha-1 of the green manure, and then, decreasing until the last application of rooster tree biomass to the soil (Figures 3A, 3B and 3C). For dry mass of shoots, an increase of 0.24 t ha-1 was observed between the highest and the lowest amounts of rooster tree added to the soil, with a maximum value recorded for 55 t ha-1 of green manure incorporated in the soil (Figure 3D).
For lettuce, an increase in the productivity was observed with increasing amounts of rooster tree biomass up to the values of 19.57 and 5.42 t ha-1 in the amounts of 45.59 and 44.99 t ha-1 incorporated in the soil during both planting times 1 and 2, respectively, and then decreasing until the largest application of green manure added to the soil (Figure 3E). By examining the lettuce planting times within each rooster tree biomass dosage, we observed significant differences in the productivity between the planting times, with the productivity in Time 1 being higher than Time 2 (Table 2).
This superiority of the productivity for Time 1 is due to the shorter cycle for lettuce compared to the carrot cycle. Also, the growth of the carrot culture at the initial stages is slow, and requiring little water and nutrients. This may have reduced the resource competition for, which is in contrast to what was observed when lettuce was cultivated during Time 2.
The competition between plants is importance key consideration in these cropping systems, since the efficiency of an associated system is mainly based on the complementarity between the crops involved, and this will be greater insofar as it is possible to minimize the established effects of one species on the other (PORTO et al., 2011).
Rev. Caatinga
y = 9.7167** + 0.1213**x - 0.0012**x2
R² = 0.99**
10 11 12 13 14
10 25 40 55
P la nt h ei gh t (c m ) A
y = 13.572** + 0.1068**x - 0.0010**x2
R² = 0.99**
13 14 15 16 17
10 25 40 55
P la nt di am et er (c m ) B
y = 10.26** + 0.0807**x - 0.001**x2
R² = 0.99*
10.5 10.9 11.3 11.7 12.1 12.5
10 25 40 55
N um be r of l ea ve s pe r pl an t C
y = 0.3025** + 0.0561**x0.5
R² = 0.98**
0.3 0.4 0.5 0.6 0.7 0.8
10 25 40 55
S hoot dr y m as s (t h a -1) D
y = 4.9790** + 0.6392**x - 0.0070**x2
R² = 0.99**
y = 1.1698** + 0.1890**x - 0.0021**x2
R² = 0.99**
1.8 5.9 10 14.1 18.2 22.3
10 25 40 55
P rodu ct ivi ty of l et tu ce (t h a -1)
Amounts of roostertree biomass (t ha-1)
E
First cultivation
Second cultivation
y = 0.6348** + 0.0003**x2–7.17 *10-8**x4
R² = 0.99**
0.3 0.5 0.7 0.9 1.1
10 25 40 55
S cor e of t he c an on ic a l va ri abl e F
Amounts of roostertree biomass (t ha-1)
Figure 3. Plant height (A) and diameter (B), number of leaves per plant (C), shoot dry mass (D), productivity (E) and score of the canonical variable (F) of lettuce intercropped with carrot as a function of amounts of rooster tree biomass incorporated in the soil.
In relation to the spatial arrangements, there were no significant differences between lettuce productivities, plant diameter and number of leaves per plant (Table 2). A significant difference was observed between the mean values of dry mass of lettuce shoots, with higher value recorded in the 4:4 spatial arrangement (Table 2).
Compared with monoculture, the intercropping between plants stands out by the fully use of all natural resources, preventing diseases, pests and insects, reducing the need for chemical fertilizers and pesticides, reducing environmental pollution, reducing production costs and improving the yield of the grower as well as their profits (ZHANG et al., 2003).
A large number of species can improve ecosystem productivity and the occurrence of species or functional groups with different and specific ecological strategies taking to an increase of the resource exploitation and therefore, for a positive
relationship between biodiversity and the functioning of ecosystems (TILMAN; FORNARA, 2008).
Almeida et al. (2015), working with agronomic efficiency of the lettuce-arugula intercropping fertilized with rooster tree reported that the result is due to the fact that the intercropping responded to the green manuring with rooster tree and the nutrients provided has translated into agronomic efficiency.
It is well-known that green manuring improves fertility, increases organic matter content, decreases erosion rates, increases soil water retention and soil microbiota activity by increasing nutrient availability and reducing the amount of invasive plants (GRAHAM; HAYNES, 2006), and these observations are in agreement with other reports.
CONCLUSIONS
The best productive performance of the carrot and lettuce intercrop was obtained when the rooster tree biomass of approximately 46.36 t ha-1 was incorporated into the soil.
There was no influence of the spatial arrangements on the agronomic efficiency of the carrot and lettuce intercropping system.
Two crops of lettuce during the carrot cycle appear to be a viable alternative for the vegetable growers.
The use of rooster tree as green manure is agronomically feasible in the carrot and lettuce intercropping system.
ACKNOWLEDGEMENTS
Special thanks are due to the Coordenação de Aperfeiçoamento de Pessoal de Nível Superior (CAPES), for the financial support to this research and to the research group that develops technologies for growing vegetables on family farms.
REFERENCES
ALMEIDA, A. E. S. et al. Eficiência agronômica do consórcio alface-rúcula fertilizado com flor-de-seda. Revista Caatinga, Mossoró, v. 28, n. 3, p. 79-85, 2015.
BATISTA, M. A. V. et al. Atributos microbiológicos do solo e produtividade de rabanete influenciados pelo uso de espécies espontâneas. Horticultura Brasileira, Brasília, v. 31, n. 4, p. 587-594, 2013.
BEZERRA NETO, F. et al. Otimização agroeconômica da cenoura fertilizada com diferentes doses de jitirana. Revista Ciência Agronômica, Fortaleza, v.45, n. 2, p. 305-311, 2014.
COSTA, A. S. V.; SILVA, M. B. Sistemas de consórcio milho feijão para a região do vale do rio doce, Minas Gerais. Ciência e Agrotecnologia, Lavras, v. 32, n. 2, p. 663-667, 2008.
EMPRESA BRASILEIRA DE PESQUISA AGROPECUÁRIA - EMBRAPA. Manual de análises químicas de solos, plantas e fertilizantes. 2ª edição revisada e ampliada. Brasília, DF: EMBRAPA, 2009. 627 p.
FERREIRA, D. F. SISVAR: a computer statistical analysis system. Ciência e Agrotecnologia, Lavras, v. 35, n. 6, p. 1039-1042, 2011.
GRAHAM, M. H.; HAYNES, R. J. Organic matter status and the size, activity and metabolic diversity of the soil microbial community in the row and inter -row of sugar cane under burning a trash retention. Soil Biology and Biochemistry, Great Britain, v. 38, n. 1, p. 21- 31, 2006.
JANDEL SCIENTIFIC. Table curve: curve fitting software. Corte Madera, CA: Jandel Scientific, 1991. 280 p.
LANA, M. M.; VIEIRA, J. V. Fisiologia e manuseio pós-colheita de cenoura. Brasília, DF:
Embrapa Hortaliças, 2000. 16 p.
LINHARES, P. C. F. et al. Velocidade de decomposição da flor-de-seda no desempenho agronômico da rúcula cv. Cultivada. Revista Verde Agroecologia e Desenvolvimento Sustentável, Mossoró, v. 4, n. 2, p. 46-50, 2009.
LINHARES, P. C. F. et al. Roostertree (Calotropis
procera) under different amounts and periods of
incorporation on yield of coriander. Revista Verde Agroecologia e Desenvolvimento Sustentável, Pombal, v. 9, n. 3, p. 7-12, 2014.
LOPES, W. A. R. et al. Produtividade de cultivares de cenoura sob diferentes densidades de plantio. Revista Ceres, Viçosa, v. 55, n. 5, p. 482-487, 2008.
OLIVEIRA, L. A. A. et al. Viabilidade agronômica de policultivos de rúcula/cenoura/alface sob quantidades de flor-de-seda e densidades populacionais. Revista Caatinga, Mossoró, v. 28, n. 4, p. 116-126, 2015.
PIVETTA, L. A. et al. Avaliação do cultivo consorciado de rúcula com alface, em sistema orgânico e biodinâmico na região oeste do Paraná. Cadernos de Agroecologia, Guarapari, v. 2, n. 2, p. 1682-1685, 2007.
Rev. Caatinga
carrots. Horticultura Brasileira, Brasília, v. 29, n. 3, p. 404-411, 2011.
SANTOS, I. C.; SEDIYAMA, M. A. N.; PEDROSA, M. W. Adubação verde no cultivo de hortaliças. Viçosa: EPAMIG, 2013. 6 p. (Circular Técnica. 179).
SEMENTES SAKATA. Características de cultivares de alface. Disponível em: <http:// http:// www.sakata.com.br/produtos/hortalicas/folhosas/ alface>. Acesso em: 17 de jun. 2016.
SILVA, A. F. A. et al. Rentabilidade do rabanete adubado com flor-de-seda em duas épocas de cultivo no semiárido de Pernambuco. Revista de Ciências Agrárias, Recife, v. 58, n. 2, p. 198-207, 2015.
SILVA, H. D. et al. Viabilidade agronômica de consórcios entre alface e rúcula no sistema orgânico de produção. Cadernos de Agroecologia, Guarapari, v. 6, n. 2, p. 2-5, 2011.
SILVA, M. L. et al. Produção de cenoura fertilizada com flor-de-seda (Calotropis procera (Ait.) R. Br.). Revista Ciência Agronômica, Fortaleza, v. 44, n. 4, p. 732-740, 2013.
TÁVORA, F. J. A.; SILVA, C. S. A.; BLEICHER, E. Sistemas de consórcio do milho, sorgo e feijão -caupi em séries de substituição. Revista Brasileira de Agrociência, Pelotas, v. 13, n. 3, p. 311-317, 2007.
TILMAN, D.; FORNARA, D. A. Plant functional composition influences rates of soil carbono and nitrogen accumulation. Journal of Ecology, London, v. 96, n. 2, p. 314-322, 2008.
ZHANG, Y. et al. Biodiesel production from waste cooking oil: Process design and technological assessment. Bioresource Technology, Amsterdam, v. 89, n. 1, p. 1-16, 2003.