1
Corresponding author:
Received: October 11, 2017.
Accepted: November 22, 2017.
Copyright: All the contents of this journal, except where otherwise noted, is licensed under a Creative Commons Attribution License.
Genotype-environment interaction on the density of
peach buds cultivated in a humid subtropical climate
Gener Augusto Penso
1, Idemir Citadin
2, Silvia Scariotto
3,
Moeses Andrigo Danner
4, Marcos Robson Sachet
51Agronomist Engineer, MsC. Student of the Graduate Program in Plant Science at the Federal University of Viçosa, Viçosa – MG. Brazil. E-mail: [email protected]. 2Agronomist Engineer, Dr. Professor at the University of Technology – Paraná, UTFPR, Pato Branco – PR. Brazil. E-mail: [email protected].
3Agronomist Engineer Dr. Student of the Graduate Program in Plant Science at the. University of Technology – Paraná, UTFPR, Pato Branco – PR. Brazil. E-mail: [email protected].
4Agronomist Engineer, Dr. Professor at the University of Technology – Paraná, UTFPR, Pato Branco– PR. Brazil. E-mail: [email protected]. 5Agronomist Engineer, Dr. Professor at the Federal University of Roraima, Boa Vista, Roraima, Brasil. E-mail: [email protected].
Abstract – Studies on the interaction of genetic and environmental effects on floral morphogenesis
in peach trees grown in humid subtropical climate provide important information related to adaptation and for assisting in the selection of new cultivars. This study aimed to verify the genetic and environmental effects and to identify peach tree genotypes with greater shoot length, vegetative
bud, flower bud density adaptability and stability under humid subtropical climate conditions.
Twelve peach tree genotypes were evaluated over a period of eight years, during the growing season (2006/07 to 2013/14) in Pato Branco-PR, Brazil. Data were collected for shoot length (SL),
flower bud density (FBD) and vegetative bud density (VBD), as well as temperature, humidity and precipitation. For the analysis of adaptability and stability we used GEE Biplot methodology. SL was influenced by the temperature and relative humidity. Increased exposure time to temperatures
below 20 °C and above 30 °C, high thermal amplitude and relative humidity of less than 50% reduced shoot growth. VBD and FBD were predominantly controlled by the genetic factor. For VBD, the genotypes ‘Cascata 1055’ and ‘Conserva 681’ were the most adapted. For FBD, the genotypes ‘Cascata 1055’, ‘BRS Bonão’, ‘Conserva 681’, ‘Cascata 967’ and ‘BRS Kampai’ presented better adaptability. The genotypes more adapted to the FBD can be recommended for cultivation in the humid subtropical climate, since they also present greater stability in the production of fruits, independently of the meteorological conditions that occur during the vegetative and reproductive season.
Index terms: Prunus persica L. Batsch, GGE Biplot, genetic improvement, adaptability and stability, morphogenesis.
Interação genótipo-ambiente na densidade de gemas
de pessegueiro cultivado em clima subtropical
Resumo – Estudos da interação dos efeitos genéticos e ambientais, na morfogênese floral de
pessegueiros cultivados em regiões de clima subtropical úmido, são importantes para verificar a
adaptação e a seleção de novas cultivares. Este trabalho teve como objetivo verificar os efeitos
genéticos e ambientais identificando genótipos com maior adaptabilidade e estabilidade no comprimento de ramos e na densidade de gemas vegetativas e florais, de pessegueiros cultivados em clima subtropical úmido. Foram avaliados 12 genótipos de pessegueiro cultivados em Pato Branco, Paraná, em oito ciclos (2006/2007 a 2013/2014). Foram coletados dados de comprimento de ramos (CR), densidade de gemas florais (DGF) e densidade de gemas vegetativas (DGV), dados meteorológicos de temperatura, umidade e precipitação. Para análise de adaptabilidade e estabilidade, foi utilizada a metodologia GGE Biplot. CR foi influenciado pelas condições
ambientais de temperatura e umidade relativa do ar. Maior tempo de exposição a temperaturas abaixo de 20 °C e acima de 30 °C, a amplitude térmica elevada e a umidade relativa do ar abaixo de 50% reduzem o crescimento de ramos. A DGV e a DGF são controladas predominantemente pelo fator genético. Para a DGV, os genótipos ‘Cascata 1055’ e ‘Conserva 681’ foram os mais adaptados. Para a DGF, os genótipos ‘Cascata 1055’, ‘BRS Bonão’, ‘Conserva 681’, ‘Cascata 967’ e ‘BRS Kampai’ apresentaram melhor adaptabilidade. Especialmente estes genótipos mais adaptados quanto à DGF podem ser recomendados para cultivo na região, pois devem apresentar maior estabilidade na produção de frutos também, independentemente das condições meteorológicas que ocorram durante o ciclo vegetativo e reprodutivo.
Termos para indexação: Prunus persica L. Batsch, GGE Biplot, melhoramento genético, adaptabilidade e estabilidade,morfogênese.
Introduction
The peach tree [Prunus persica (L.) Batsch] is a species originated from temperate climates, but it is now widely cultivated in subtropical and tropical regions (LEITE, PETRI and COUTO, 2014). Its expansion into theses regions was permitted largely due to genetic improvement research, which was conducted to reduce the chilling requirement (SCARIOTTO et al., 2013; RASEIRA and FRANZON, 2014).
Humid subtropical climate regions present mild winter characteristics, with a large thermal range, and summers with elevated temperature and precipitation levels, favouring excess vegetative growth. In these regions, there is a large yearly variation in accumulated chilling units during the peach tree dormancy period and considerable risk of late frost, especially in regions of higher altitude. These environmental effects often hamper the adaptation of the species and make cultivars recommendation difficult (CITADIN et al., 2001; CITADIN et al., 2014).
With the obtainment of peach tree cultivars with a low chilling requirement, there has been a reduction in
flowering and sprouting heterogeneity. However, problems still persist, such as low fruit set, low fruitification and/
or production irregularity, which could be related to three environmental effects: 1) the occurrence of temperatures
above 25 ºC during the pre-flowering period and flowering
(in the winter), these cause a delay in the formation of the female gametophyte, causing anomalies in their formation (NAVA et al., 2009; COUTO et al., 2010); 2) The occurrence of elevated temperatures during November/ December, which coincides with the period of induction
and floral differentiation in the southern hemisphere,
this can cause the formation of blind buds due to the
inhibition of floral differentiation, resulting in a reduction in flower bud density (MONET and BASTARD, 1971;
BANGERTH, 2006); and 3) the occurrence of frost during
the flowering period until the hardening of the endocarp
of the fruit (ASSMANN et al., 2008).
There are almost no studies on genetic and
environmental effects and their interactions on floral
morphogenesis and the stability of bud formation in peaches cultivated in subtropical climates (PÉREZ, 2004; LI et al., 2010), especially in humid subtropical
climate. The adequate formation of floral buds is of great importance, as it is the first component of yield
in fruit plants. Once affected it can trigger failures in the subsequent stages, resulting in a yield reduction (WERNER et al., 1988; ALBUQUERQUE et al., 2004).
The number of floral buds should also be stable throughout
the production cycle, regardless of the climatic variations that occur, to avoid large yield variations between years.
Therefore, understanding the factors that affect the
morphogenesis of floral buds in peach plays an important
role in the selection of the best adapted cultivars for the cultivation sites (OKIE and WERNER, 1996; KODAD and COMPANY, 2008). In this sense, the use of new tools that assist the study of adaptations and stability in peach tree, such as assessment of the use of bud density and shoot growth, can be useful for genetic improvement programmes, because they can support the selection, and the indication of new genotypes (PÉREZ, 2004; ENGIN and ÜNAL, 2007).
The use of the Biplot methodology proposed by Gabriel (1971), for the analysis of adaptability and stability of genotypes, and improved for the GGE Biplot
methodology by Yan (2000), has been widely used in the genetic improvement programmes of several species. This methodology permits in a clear way the visualisation and distinction (even with a large number of genotypes and environments) of the most stable and adapted genotypes and the performance of each genotype in relation to each environment (YAN and HOLLAND, 2010; SILVA and BENIN, 2012).
This study aimed at verifying the genotype and environmental effects under the bud morphogenesis in peach trees, cultivated in a humid subtropical climate, as
well as the length of shoots, the final density of flowers,
and vegetative buds, in order to identifying genotypes with the greatest adaptability and stability in relation to bud density.
Material and methods
The experiment was conducted in the experimental orchard of the Federal Technological University - Paraná, Pato Branco Campus (26°10’38’’ S, 52°41’21’’ W, altitude
764 m). The climate according to the Köppen classification
is a type Cfa, with an average of 225 hours below 7.2 ºC or 700 hours below 12 °C, accumulated between May and September (SCARIOTTO et al., 2013), and average annual precipitation of 1600 to 1800 mm (IAPAR, 2017).
Twelve peach tree genotypes were evaluated, all of which were provided by Embrapa Clima Temperado, where were cultivated in advanced selections of low and medium chilling requirement (Table 1).
The peach trees were grafted onto ‘Aldrighi’ rootstock (originating from seeds) and the planting was carried out in 2004 and 2005, with a 4 x 6 m spacing, with rows running north to south. The plants were trained in an open vase system and the management was carried out according to the crop recommendations, with the use of green pruning during the summer period and light pruning of the fruit-bearing shoots during the winter period (PEREIRA and RASEIRA, 2014).
The field evaluations were conducted in the years of
2006 to 2014, with three plants per genotype (replicates),
using five shoots a year per plant, distributed throughout
number (FB) and vegetative (VB) buds were recorded. These data were used to calculate the density of the vegetative (VBD) and flower buds (FBD), through the equations: VBD = (n°VB)/SL (cm) and FBD = (n° FB)/SL
(cm). The results were expressed as the number of buds per centimetre of shoot (buds cm-1). The experiment was
conducted in a 12 x 8 factorial scheme, in a completely
randomised design, with genotypes (fixed effect) forming the first factor and year or environment (random factor)
the second factor.
Data were also obtained hourly for precipitation, relative humidity and temperature through the meteorological station of the Paraná Meteorological System (SIMEPAR), located eight kilometres from the orchard. The sum of chilling hours (<12 °C summed from May to July) was calculated. The period from August 1st
to February 28th was considered as the vegetative growing
season (the period in which most plant development occurs). Taking into account this vegetative growing season, the number of hours with temperatures below
20 °C (Σh <20 °C), between 25-30 °C (Σh 25-30 °C) and above 30 °C (Σh> 30 °C) were summed. Thermal
amplitude (the difference between the maximum and minimum temperature); the number of hours with a
relative humidity (RH) below 50% (Σ h RH <50%) and above 70% (Σh RH> 70%); and the cumulative
precipitation (C.P.) were also recorded
The data for SL, FB, VB, VBD and FBD were initially submitted to normality analysis by the Lilliefors
test and homogeneity by the Bartlett test. Verification
of the interaction genotype x environment was done through analysis of variance, using the GENES software application (CRUZ, 2013). Once the assumptions of the mathematical model were met, the analysis of the adaptability and stability was conducted using the GGE Biplot methodology (YAN, 2000), using R software (DEVELOPMENT CORE TEAM, 2015), through the
GGE Biplot GUI package (BERNAL, 2015).
The GGE Biplot methodology is based on the
model: Ɣij – ÿj= ɣ1εi1ρj1+ɣ2εi2ρj2+εij, where Ɣij represents the mean of the variable for genotype i in year j; Ÿj is the overall mean of the variable for genotypes in environment
j. Ɣ1εi1ρj1 represents the first principal component (PC1).
Ɣ2εi2ρj2+εij represents the second principal component (PC2). y1 and y2 are the self values associated with PC1 and PC2. εi1 and εi2 are the PC1 and PC2 scores for genotype i. pj1 and ρj2 are the self values associated with PC1 and PC2 for year j. εij is the ij error associated with the model (YAN et al., 2007). The interpretation of the results was made based on the ‘which-won-where’ comparison of the
GGE Biplot method, described by Yan and Tinker (2006), Yan et al. (2007) and Silva and Benin (2012).
One of the ways of observing the adaptation of a
genotype to a given environment is verified through the
angle formed between the genotype and year, starting from the origin. When the angle formed between them is less than 90°, it is said that there is adaptation of this genotype
to the environment and if the angle formed between them is greater than 90°, there is no adaptation of this genotype. This is because the graphical representation of the method is the result of the analysis of the decomposition of vector product values through the cosine of the angle between two vectors (YAN and TINKER, 2006; YAN et al., 2007; SILVA and BENIN, 2012). Regarding the stability, genotypes closer to zero in relation to PC2 indicate that the genotype is more stable (SILVA and BENIN, 2012).
Results and discussion
The SL, VBD and FBD data presented normality and homogeneity according to the Lilliefors and Bartlett tests, respectively and, therefore, their transformation was not necessary. For all the analysed variables there was a
significant interaction between genotype and year (G x A), identified by the F test (p≤0.01), which is a necessary
assumption for the use of GGE Biplot analysis.
The GGE Biplot analysis identified that for the
variable SL, approximately 68% of the variation can be
explained by the first two principal components (PC),
with 45.77% of the variation linked to PC1 and 22.31% linked to PC2 (Figure 1). These results indicate that there
is a significant environmental effect (through genotype
x environment interaction) in SL, as shown by the high value of PC2, and also by the wide distribution of season and genotypes between mega-environments (Figure 1).
Under the humid subtropical environmental conditions where the study was conducted, the genotypes ‘Cascata 967’, ‘BRS Bonão’, ‘Cascata 1055’, ‘Conserva 681’ and ‘Olímpia’ can be considered adapted for SL, as they were stable between the evaluated season (Figure 1). The genotypes ‘Atenas’, ‘Tropic Beauty’, ‘Santa Áurea’, ‘BRS Libra’, ‘BRS Kampai and ‘BRS Rubimel’ were considered to have low adaptation and high instability in the evaluation of adaptability and stability of the SL, the 2006/07 and 2009/10 season came closest to being considered ideal for homogeneity of the genotypes response to these environments, making them more stable seasons. The 2013/14 season was the most unstable, with a greater genotype separation, however, the season presented the lowest SL among the evaluated cycles.
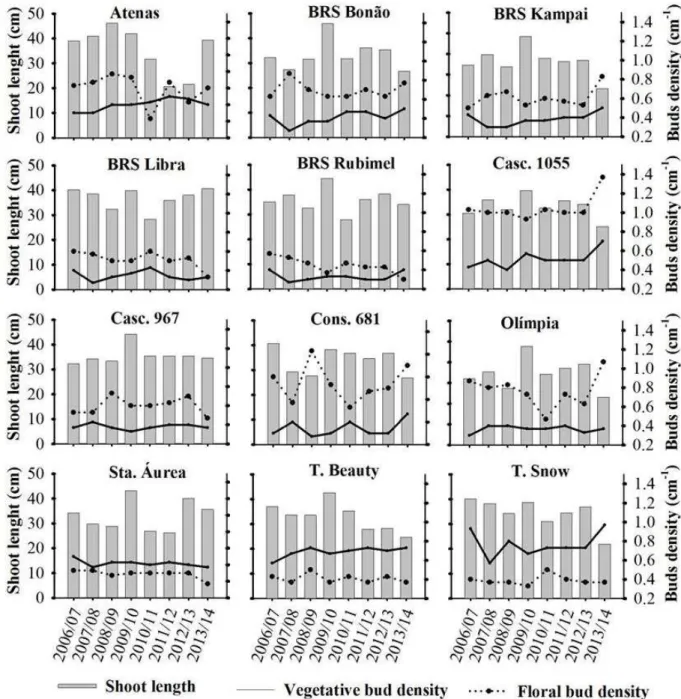
of productive buds. However, contrary to Rodrigues et al. (2009), it was observed that several genotypes did not show abrupt variations in bud density, even in cycles that presented greater SL (Figure 2). Even in seasons with greater SL, as was the case in 2009/10, with approximately 10 cm more on average, the bud densities remained almost unchanged (Figure 2). These results corroborate with those of Li et al. (2010), who observed variation in shoot length in Prunusavium L. grown in different climate types,
however, the flower bud density did not differ significantly
among the evaluated sites.
The large variation in SL between the evaluated
season occurs largely due to environmental influence
and its variations during the study period, both during the dormancy period and during the period of vegetative growth, especially due to the temperature and precipitation conditions. This because the occurrence of higher temperatures associated with water availability, and high soil fertility, increase the length of shoots (DAVIDSON et al., 2015). In the winter of 2008 there was the lowest chilling accumulation recorded among the evaluated years, with 338 hours below 12 °C (Table 2), which was
not sufficient to supply the chilling requirement of most
genotypes (Table 1). Under these conditions, the genotypes in 2008/09 presented one of the lowest SL among the evaluated cycles, with the exception of the ‘Atenas’ cultivar, which was the only genotype that displayed adaptability to the 2008/09 environment (Figure 1), with
a significant increase in SL (Figure 2).
In previous studies, a reduction in the vegetative budding rate, a reduction in the formation of productive shoots and an increase of rosette-type branches (which are less productive), have been shown in years with
insufficient chilling accumulation during the peach tree
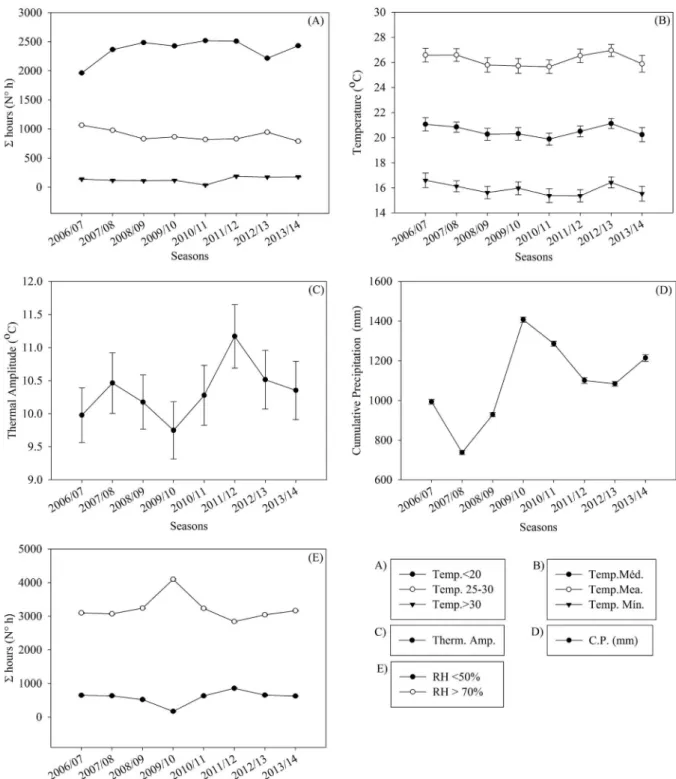
dormancy period (SCARIOTTO et al., 2013). For the rest of the 2008 season (2008/09), there were no large
variations in Σh <20 °C, Σh 25-30 °C, Σh <20 °C or Σh >30
°C (Figure 3A), and the maximum, mean and minimum temperatures (Figure 3B) in relation to the anterior or posterior season. However, during the rest of the 2008/09 season there was a high thermal amplitude (Figure 3C), the lowest cumulative precipitation (700 mm) in relation to the other seasons (Figure 3D), and an increase in the
Σh RH <50% (Figure 2E), impairing SL at the end of the season at the time of evaluation (Figure 2).
In the winter of 2013, even though there was satisfactory chilling accumulation, there was intense late frost at the end of August (Table 2). At this time all genotypes had already presented established sprouting (Table 1), therefore, the normal development of shoots during the rest of the season was impaired and the SL was lower (Figure 2).
Conversely, during the 2009/10 season, there were favourable factors for shoot growth, with high precipitation (1400 mm), because during this season
there were a greater number of hours with RH >70% and
a low thermal amplitude, high value of Σh 25-30 °C. This provided a favourable environment for an increase in gas exchange, the formation of assimilates and increased production of organic compounds, resulting in an increase in SL (Figure 2).
Other studies have also found a higher shoot growth rate in peach trees due to greater water availability and
RH >60% associated with temperatures around 25 °C
(MONET and BASTARD, 1971; BERMAN and De JONG, 1997; BESSET et al., 2001; SOLARI et al., 2006; ANDREINI and BARTOLINI, 2008).
Temperatures <20 °C, during the vegetative growth season, may retard shoot growth (FAUST, 2000). This was observed in the seasons in which there was a change in the number of hours recorded at this temperature range, as in the season that showed a reduction from 2500 of Σh <20 °C to Σh <20 °C, 2000 and 2200 hours respectively (Figure 3).
Hot and humid climate conditions in China increase
the formation of long and vigorous shoots (>60 cm) and
lower production of sweet cherry (Prunus avium L.), in comparison with mild and dry climate regions, where a greater number of more productive medium and short shoots occur (LI et al., 2010). Apricot shoots with high
vegetative growth showed smaller and sparser flower buds, higher floral abortion and flowers with underdeveloped
pistils that do not sustain the germination of pollen. In
short shoots (20 to 30 cm) the flowers have adequate
morphological development (JULIAN, et al., 2010). These results indicate that more vigorous shoots generate less fruit production than smaller shoots.
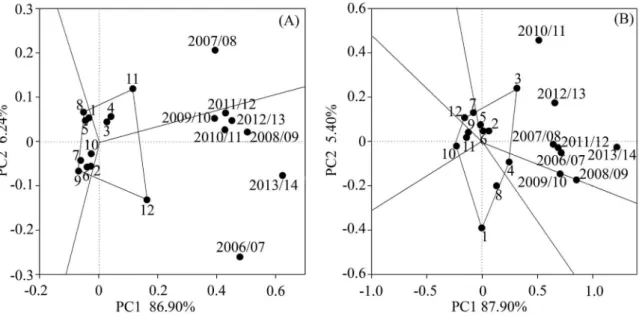
For VBD and FBD the opposite behaviour was observed for SL, since the GGE Biplot analysis showed that
the genotypic effect (genetic influence) was predominant
over the environmental effect. This is because more of the variations of the analysis were linked to PC1 for both
characteristics (≈86 and 87%, respectively), than to PC2
(Figure 4A, 4B).
The major genotypic influence over environment on VBD is also demonstrated by the marked VBD difference between the genotypes, varying from 0.33 to 0.77 buds cm-1 (Figure 2). The high or reduced VBD has influence on
crown vigour. Low VBD can result in a risk of uneven and
insufficient shoots. According to Gordon et al. (2006) 0.3
to 0.4 vegetative buds cm-1 may represent excess canopy
vigour in peach trees. In our study it was observed that the
VBD was equal to or higher than the value indicated by the authors, observed in our study area, since the evaluated genotypes have excessive vegetative growth (Figure 2).
Most of the genotypes showed good stability for
FBD (Figure 4B), despite the climatic variations that occurred in the evaluated years (Figure 2, Figure 3). These results corroborate those obtained by Okie and
Werner (1996), who concluded that flower buds density
is fundamentally driven by genotypic variation, while the
environment has a low influence on it.
Considering the interpretation that the angle formed between the genotype and the cycle should be <90º (YAN et al, 2007), high adaptation and good stability for FBD was observed for the genotypes ‘Cascata 967’, ‘BRS Bonão’, ‘Conserva 681’, ‘BRS Kampai’, because they presented adaptability in most of the evaluated seasons (Figure 2, Figure 3). The genotype ‘Cascata 1055’ presented a high bud density, however, it presented instability in some of the seasons (Figure 2, Figure 3).
Despite showing a lower FBD the genotypes ‘BRS Rubimel’, ‘Santa Áurea’ and ‘Tropic Beauty’ were considered stable, while the genotype ‘Atenas’ showed to have lower instability (Figure 2B). In the FBD adaptability and stability assessment, the season of 2013/14 was the closest to what was considered ideal, as it was the most stable and presented a high overall mean. The 2010/11
season was the most unstable, thereby permitting better separation of the genotypes.
The high genotypic response of the bud densities is largely due to the lack of extreme environmental stress conditions or imbalance in the plants, which can affect
bud density more drastically. A significant factor that acts on flower bud formation, and contributes to final flower
bud density, is the carbon/nitrogen ratio (C/N) (TROMP, 1980; MEDIENE et al., 2002). These authors report that
if the C/N ratio is moderately high then floral induction
occurs, however, if it is low, it promotes vegetative growth. According to Faust (2000), there is an inverse relation between vegetative growth and the formation of
flower buds.
According to Bernier (2005), the temperature is
directly linked to the floral differentiation phase, in that mild temperatures favour flower bud formation, while
high temperatures cause adverse effects, resulting in bud formation anomalies (SHEN et al., 1999; Faust, 2000). This fact was supported in this experiment, where the occurrence of mild temperatures was predominant during the evaluation period (Figure 3A). According to Li et al.
(2010), flower bud differentiation in Prunus avium L., was slightly accelerated and early when cultivated in hot and humid regions, in comparison with those cultivated in milder and drier climates.
Temperature affects biochemical and metabolic processes. Generally, temperatures slightly above 25 °C, tend to accelerate the metabolism and the differentiation of buds. In contrast, temperatures of 30 to 35 °C are capable of paralysing the formation, or can even cause bud abortion (BEPPU et al., 2001). However, a low sum of hours between these temperature ranges was observed, which did not affect bud density in this study.
Table 1
–
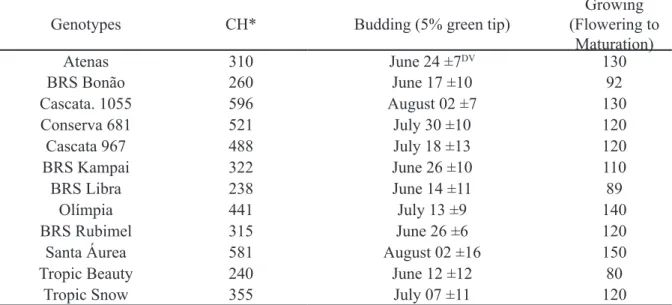
Chilling requirement calculated in chill hours below 12 °C (CH), date of budding and maturation
of peach genotypes.
Genotypes CH* Budding (5% green tip)
Growing (Flowering to
Maturation)
Atenas 310 June 24 ±7DV 130
BRS Bonão 260 June 17 ±10 92
Cascata. 1055 596 August 02 ±7 130
Conserva 681 521 July 30 ±10 120
Cascata 967 488 July 18 ±13 120
BRS Kampai 322 June 26 ±10 110
BRS Libra 238 June 14 ±11 89
Olímpia 441 July 13 ±9 140
BRS Rubimel 315 June 26 ±6 120
Santa Áurea 581 August 02 ±16 150
Tropic Beauty 240 June 12 ±12 80
Tropic Snow 355 July 07 ±11 120
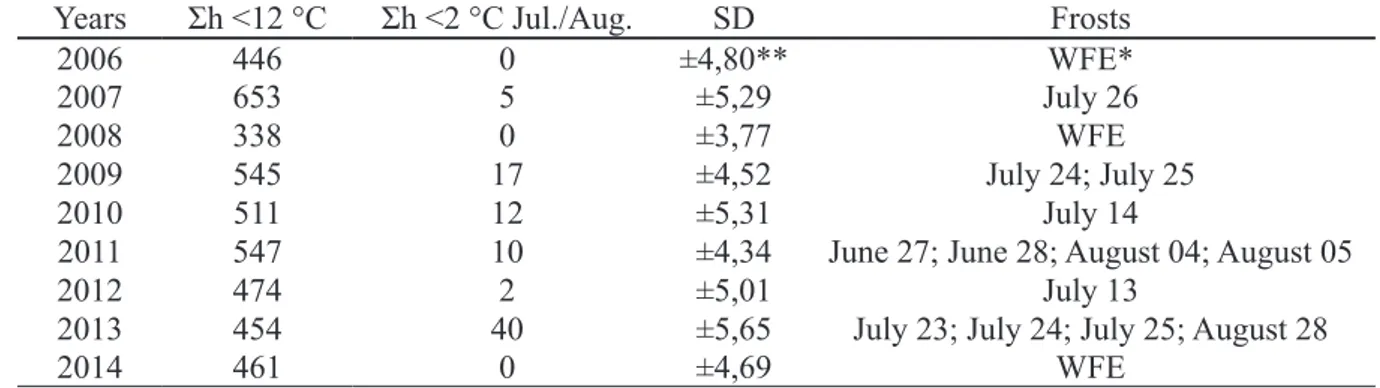
Table 2 – Sum of hours below 12 °C (Σh <12 °C), taking into account the period from May 1 to July 31 of each year, sum of hours below 2 °C (Σh <2 °C July/August) and date of frost events during the winter period of each year.
Years Σh <12 °C Σh <2 °C Jul./Aug. SD Frosts
2006 446 0 ±4,80** WFE*
2007 653 5 ±5,29 July 26
2008 338 0 ±3,77 WFE
2009 545 17 ±4,52 July 24; July 25
2010 511 12 ±5,31 July 14
2011 547 10 ±4,34 June 27; June 28; August 04; August 05
2012 474 2 ±5,01 July 13
2013 454 40 ±5,65 July 23; July 24; July 25; August 28
2014 461 0 ±4,69 WFE
* WFE without frost event. ** Standard deviation.
Figure 3 – Sum of hours <20; 25-30; >30 °C (A), maximum, mean and minimum temperatures (B), thermal amplitude
Figure 4 – Adaptability and stability by the ‘which-won-where’ comparison of the GGE Biplot methodology, of 12
peach genotypes evaluated for vegetative bud density (A), flower bud density (B) in seasons from 2006/07 to 2013/14.
Genotypes evaluated: Atenas (1); BRS Bonão (2); Cascata 1055 (3); Conserva 681 (4); Cascata 967 (5); BRS Kampai (6); BRS Libra (7); Olímpia (8); BRS Rubimel (9); Santa Áurea (10); Tropic Beauty (11); Tropic Snow (12).
Conclusions
The variable shoot length is influenced by the en -vironmental conditions: temperature and relative humi-dity of the air;
The flower and vegetative bud densities are con -trolled primarily by the genotypic factor;
The increase in exposure time to temperatures below 20 °C and above 30 °C, high thermal amplitude and a relative humidity of less than 50% reduce shoot growth;
For vegetative bud density the genotypes ‘Cascata 1055’ and ‘Conserva 681’ were the most adapted;
For the flower bud density the genotypes ‘Cascata
1055’, ‘BRS Bonão’, ‘Conserva 681’, ‘Cascata 967’ and ‘BRS Kampai’ presented better adaptability and may be preferentially cultivated in the region of Pato Branco – PR.
Acknowledgements
The authors would like to thank the Meteorological System of Paraná (SIMEPAR) for making available the meteorological data used in this study, Embrapa Clima Temperado for making the genotypes available for the
study, CAPES and CNPq for financial support.
References
ALBUQUERQUE, N.; BURGOS, L.; EGEA, J. Influence of flower bud density, flower bud drop and fruit set on
apricot productivity. Scientia Horticulturae, Amsterdam, v.102, n.4, p.397-406, 2004.(1)
ANDREINI, L.; BARTOLINI, S. Morphological changes in the Apex of Prunus persica L. during floral transition and effects of gibberellin on flower bud differentiation.
Journal of Applied Horticulture, Indiranagar, v.10, n.2, p.93-99, 2008. (1)
ASSMANN, A. P.; CITADIN, I.; LOCATELLI, M. C.; SCARIOT, S.; DANNER, M. A.; RASEIRA, M. C. B. Tolerância de frutos de pessegueiro a geadas. Revista Brasileira de Fruticultura, Jaboticabal, v.30, n.4, p.1030-1035, 2008. (1)
BANGERTH, F. Flower induction in perennial fruit trees: Still a enigma?. Acta Horticulturae, The Hague, v.727, n.1, p.177-196, 2006. (1)
BEPPU, K.; IKEDA, T.; KATAOKA, I. Effect of high
temperature exposure time during flower bud formation
on the occurrence of double pistils in ‘Satohnishiki’ sweet cherry. Scientia Horticulturae, Amsterdam, v.87, n.1, p.77-84, 2001. (1)
BERNAL, E.F. Vegan. In: INTERACTIVE GGE Biplots. R. R package version 1.0-8. Disponível em: <https:// cran.r-project.org/web/packages/GGEBiplotGUI/ GGEBiplotGUI.pdf>. Acesso em 18 jan. 2017. (5)
BERNIER, G.; PÉRILLEUX, C. A physiological
overview of the genetics of flowering time control. Plant Biotechnology Journal, Charlottetown, v.3, n.1, p.3-16, 2005. (1)
BESSET, J.; GÉNARD, M.; GIRARD, T.; SERRA, V.;
BUSSI, C. Effect of water stress applied during the final
stage of rapid growth on peach trees (cv. Big – Top).
Scientia Horticulturae, Amsterdam, v.91, n.3, p.289-303, 2001. (1)
CITADIN, I. SCARIOTTO, S.; SACHET, M. R.; ROSA, F. J.; RASEIRA, M. C. B.; WAGNER Jr., A. Adaptability and stability of fruit set and production of peach trees in subtropical climate. Scientia Agricola, Piracicaba, v.71, n.2, p.133-138, 2014. (1)
CITADIN, I.; RASEIRA, M. C. B.; HERTER, F. G.;
SILVA, J. B. Heat requeriment for blooming and leafing
in peach. HortScience, Alexandria, v.36, n.2, p.305-307, 2001. (1)
COUTO, M.; RASEIRA, M. C. B.; HERTER, F. G.;
SILVA, J. B. Influence of high temperatures at blooming
time on pollen production and fruit set of peach ‘Maciel’ and ‘Granada’. Acta Horticulturae, The Hague, v.872, n.1, p.225-230, 2010. (1)
CRUZ, C. D. GENES – a software package for analysis in experimental statistics and quantitative genetics. Acta Scientiarum, Maringá, v.35, n.3, p.271-276, 2013. (1)
DAVIDSON, A.; SILVA, D.; QUINTANA, B.; DE JONG, T. M. The phyllochron of Prunus persica shoots is relatively constant under controlled growth conditions
but seasonality increases in the field in ways unrelated
to patterns of temperature or radiation. Scientia Horticulturae, Amsterdam, v.184, n.1, p.106-113, 2015. )
ENGIN, H.; ÜNAL, A.; Examination of flower bud initiation and differentiation in sweet cherry and peach by scanning electron microscope. Turkish Journal of Agriculture Forestry, Tubitak, v.31, n.6, p.373-379, 2007. (1)
FAUST, M. Physiological considerations for growing temperate-zone fruit crops in warm climates. In: EREZ, A. Temperate fruit crops in warm climates. Norwell: Springer, 2000. p.137-156. (2)
GABRIEL, K. R. The Biplot graphic display of matrices with application to principal component analysis.
Biometrika, Oxford, v.58, n.3, p.453-467, 1971. (1)
GONÇALVES, M. A.; COCCO, C.; VIGNOLO, G. K.; PICOLOTTO, L.; ANTUNES, L. E. C. Efeito da intensidade de poda na produção e qualidade de frutos de pessegueiro. Revista Brasileira de Fruticultura, Jaboticabal, v.36, n.3, p.742-747, 2014. (1)
GORDON, D.; DAMIANO, C.; De JONG, T. M. Preformation in vegetative buds of Prunus persica: factors
influencing number of leaf primordial in overwintering.
Tree Physiology, Victoria, v.26, n.4, p.537-544, 2006. (1)
IAPAR - Instituto Agronômico do Paraná. Cartas climáticas do Paraná, precipitação – Média anual. Londrina, 2017. Disponível em: <http://www.iapar.br/ modules/conteudo/conteudo.php?conteudo=595>. Acesso em: 13 jan. 2017. (5) (mudar na p.4 linha 15 (ISTITUTO AGRONÔMICO DO PARANÁ – IAPAR, 2017) para (IAPAR, 2017).
JULIAN, C.; HERRERO, M.; RODRIGO, J. Flower bud differentiation and development in fruiting and nom-fruiting shoots in relation to fruit set in apricot (Prunus armerniaca L.). Trees, Berlin, v.24, n.5, p.833-841, 2010.
KODAD, O.; COMPANY, R. S. Significance of flower bud
density for cultivar evaluation in almond. HortScience, Alexandria, v.43, n.6, p.1753-1758, 2008. (1)
LEITE, G. B.; PETRI, J. L.; COUTO, M. Dormência das fruteiras de clima temperado. In: PIO, R. Cultivo de fruteiras de clima temperado em regiões subtropicais e tropicais. Lavras: Editora UFLA, 2014, p. 57-79. (2)
LI, B. L.; XIE, Z.; ZHANG, C.; XU, W.; ZHANG, C.; LIU, Q.; LIU, C.; WANG, S. Tree growth characteristics
and flower bud differentiation of sweet cherry (Prunus avium L.) under different climate conditions in China.
HortScience, Alexandria, v.37, n.1, p.6-13, 2010. (1)
MEDIENE, S.; JORDAN, M.O.; PAGES, L.; LEBOT, J.;
ADAMOWICZ, S. The influence of severe shoot pruning
on growth, carbon and nitrogen status in young peach trees (Prunus persica). Tree Physiology, Victoria, v.22, n.18, p.1289-1296, 2002. (1)
MONET, R.; BASTARD, Y. Effets d’une température
modérément élevée: 25 °C, sur les bourgeons floraux du
pêcher. Physiology Végetal, London, v.9, n.2, p.209-226, 1971. (1)
OKIE, W. R.; WERNER, D. J. Genetic influence on flower bud density in peach and nectarine exceeds that of
environment. HortScience, Alexandria, v.31, n.6, p.1010-1012, 1996. (1)
PEREIRA, J. F. M.; RASEIRA, A. Poda. In: RASEIRA, M. C. B.; PEREIRA, J. F. M.; CARVALHO, L. C.
Pessegueiro. Brasília, DF: Embrapa, 2014, p. 283-307. (2)
PÉREZ, S. Yield Stability of peach germplasm differing in dormancy and blooming season in the Mexican subtropics.
Scientia Horticulturae, Amsterdam, v.100, n.1, p.15-21, 2004. (1)
R Development core team. R: a language and environment for statistical computing. Áustria: R Foundation for Statistical computing, 2013. p.288. (2)
RASEIRA, M. C. B.; FRANZON, R. C. Melhoramento genético. In: RASEIRA, M. C. B.; PEREIRA, J. F. M.; CARVALHO, L. C. Pessegueiro. Brasília, DF: Embrapa, 2014. p. 57-72. (2)
RODRIGUES, A. Desenvolvimento do pessegueiro ‘Flordaprince’ sob duas intensidades de poda verde.
Bragantia, Campinas, v.68, n.3, p.673-679, 2009. (2)
SCARIOTTO, S.; CITADIN, I.; RASEIRA, M. C. B.; SACHET, M. R.; PENSO, G. A. Adaptability
and stability of 34 peach genotypes for leafing under
Brazilian subtropical conditions. Scientia Horticulturae, Amsterdam, v.155, n.1, p.111-117, 2013. (1)
SHEN, Y.; GUO, J.; LIU, C.; JIA, K. Effect of temperature on the development of peach flower organs. Acta Horticulturae, The Hague, v.26, n.1, p.1-6, 1999. (1)
SILVA, R. R.; BENIN, G. Análises Biplot: Conceitos, interpretações e aplicações. Ciência Rural, Santa Maria, v.42, n.8, p.1404-1412, 2012. (1)
SOLARI, L. I.; JOHNSON, S.; De JONG, T. M. Relationship of water status to vegetative growth and leaf gas exchange of peach (Prunus persica) trees on different rootstocks. Tree Physiology, Victoria, v.26, n.6, p.1333-1341, 2006. (1)
TROMP, J. Flower-bud formation in apple under various day and night temperature-regimes. Scientia Horticulturae, Amsterdam, v.13, n.3, p.235-243, 1980. 1)
WERNER, D. J.; MOWREY, B. D.; CHAPARRO, J.
X. Variability in flower bud number among peach and
nectarine clones. HortScience, Alexandria, v.23, n.1, p.578-580, 1988. (1)
YAN, W.; HOLLAND, J.B. A heritability-adjusted GGE Biplot for test environment evaluation. Euphytica, Dordrecht, v.171, n.3, p.355-369, 2010. (1)
YAN, W.; HUNT, L. A.; SHENG, Q.; SZLAVNICS, Z. Cultivar evaluation and mega-environment based on the
GGE Biplot. Crop Science, Madison, v.40, n.3, p.597-605, 2000(1).
YAN, W.; KANG, M. S.; MA, B.; WOODS, S.; CORNELIUS, P. GGE Biplot vs. AMMI Analysis of genotype-by-environment data. Crop Science, Madison, v.47, n.2, p.643-655, 2007. (1)
YAN, W.; TINKER, N. A. Biplot analysis of multi-environment trial data: Principles and applications.