ISSN 2179-8087 (online)
Original Article
Conservation of Nature
Creative Commons License. All the contents of this journal, except where otherwise noted, is licensed under a Creative Commons Attribution License.
Structural and Floristic Variations in an Atlantic Subtropical
Rainforest in Southern Brazil
João Paulo de Maçaneiro
1
, Dieter Liebsch
1
, André Luís de Gasper
2
,
Franklin Galvão
1
, Lauri Amândio Schorn
2
1Universidade Federal do Paraná – UFPR, Curitiba/PR, Brasil 2Universidade Regional de Blumenau – FURB, Blumenau/SC, Brasil
ABSTRACT
The Atlantic Subtropical Rainforest covers a huge area of Santa Catarina state, starting on the coast and going through the Serra Geral. Along its distribution, the vegetation changes according to altitude, geomorphology, and soil. In the attempt to evaluate vegetation variations related to different soil types in an Atlantic Forest remnant, 43 plots of 200 m2 were sampled. All the
individuals with DBH ≥ 5.0 cm were measured. We have found consistent floristic and structural variations, which separated sample plots with Litholic Neosol and Rogosol situated in slopes from those with Yellow-Red Ultisol and Haplic Cambisol, as well as plots with Fluvic Neosol from Haplic Gleisol in plateaus. Species richness increased according to water availability and soil depth, with the plateaus’ soils being the richest. Each area was characterized by a range of indicator species and the results indicated that soil attributes are important drivers of vegetation variation.
2/10 Maçaneiro JP, Liebsch D, Gasper AL, Galvão F, Schorn LA Floresta e Ambiente 2019; 26(1): e20160101
1. INTRODUCTION
The Atlantic Rainforest exhibits high biological diversity, endemism values and threat levels, therefore it is considered a global hotspot for biodiversity conservation (Myers, 2003). Dense, rich and exuberant Subtropical Atlantic Rainforest runs along the coastal highlands found in Santa Catarina state, Brazil (Klein, 1980; Maçaneiro et al., 2015a). In this vegetation typology, recent studies have pointed out a high richness of species that, sometimes, overcomes that of other forest types found in this state, adding up to 1,473 species of plants in 599 genera and 144 families (Gasper et al., 2014a).
In Santa Catarina, the Atlantic Subtropical Rainforest originally covered 29,282 km2, which corresponded to 31% of the state’s territory. However, due to the historical process of overexploitation of natural resources, it has been reduced to only 40.4% of its original extension, of which less than 1% has remained without anthropogenic modification (Vibrans et al., 2013). Secondary forests are those that have suffered anthropogenic disturbances and have had its composition and structure altered. These forests have been considered important for conservation as they preserve a significant part of the original diversity of species and in this sense may complement the role of primary forests (Gibson et al., 2011). In the coastal highlands of Santa Catarina, most secondary forests are represented by fragments up to 50 ha distributed in different formations, according to the altitudinal gradient (Vibrans et al., 2013; Oliveira-Filho, 2015; Maçaneiro et al., 2015b). In these formations, elevation drives, indirectly, a range of other environmental factors that are related to vegetation distribution. Climatic components (solar radiation, precipitation, and temperature), geomorphological (relief, slope, and gap) and pedological (soil types and water availability) are closely related to changes in elevation (Ferreira-Júnior et al., 2012; Schaefer et al., 2015). Therefore, interactions amongst these components are expected to be one of the main drivers of vegetation distribution in the Atlantic Subtropical Rainforest (Oliveira-Filho et al., 2015).
Due to the environmental diversity and species richness found in Santa Catarina’s Atlantic Subtropical Rainforest, some studies have investigated the main determining factors of vegetation floristic and structural variations. On a local scale, geomorphology
has been found to perform an important role in describing vegetation floristic and structural variations (Maçaneiro et al., 2016a). In fact, geomorphology determines soil types and their physical and chemical properties (Ferreira-Júnior et al., 2012; Marangon et al., 2013; Santos et al., 2013). Nevertheless, water regime and slopes’ erosion are important environmental predictors that can influence vegetation distribution as well (Schaefer et al., 2015).
In Santa Catarina’s coastal highlands, at higher altitudes, soils tend to be shallower and poorer in nutrients, which directly affect the composition and structure of tree communities (Klein, 1980; Ferreira-Júnior et al., 2012; Schaefer et al., 2015). On these areas, vegetation is characterized by the reduced size, small diameter, tortuous and bifurcated individuals. However, in lowlands with flat reliefs, constituted by floodplains, soils can vary in depth and frequently suffer from waterlogging most part of the year. In lowlands, vegetation is characterized by low homogeneous canopies with few tree species adapted to the local water stress conditions (Klein, 1980; Curcio et al., 2007).
So, the relation between soil types and forest composition and structure have been well studied in Santa Catarina’s Atlantic Subtropical Rainforest (Vibrans et al., 2012), especially in the Vale do Itajaí’s region (Klein, 1980; Maçaneiro et al., 2015a, b, 2016b, 2017). However, there are few studies that have evaluated in a consistent manner the influence of different types of soils over tree communities. Thus, this work intends to answer the following questions: (i) Even in close locations, are there vegetation floristic and structural variations related to slope position? (ii) Are these differences observed among different types of soils? A positive answer is expected, since this ascertainment has already been confirmed in studies conducted in other regions of the Atlantic Subtropical Rainforest (Curcio et al., 2007; Teixeira et al., 2008; Ferreira-Júnior et al., 2012; Marangon et al., 2013; Schaefer et al., 2015).
2. MATERIAL AND METHODS
ranging from 700 to 1,039 m a.s.l. and located between 27°06’-27°07’ S and 49°11’-49°13’ W.
The climate is Cfa – humid subtropical climate according to Köppen’s classification, i.e. it has warm summers without dry seasons. The average annual temperature ranges between 16-18 °C and the monthly average temperature varies between 12-14 °C on the coldest month (July), and between 20-23 °C on the warmest months (January and February). The annual relative humidity varies between 82-84% and the total annual rainfall ranges between 1,500-1,700 mm, evenly distributed all year long (Pandolfo et al., 2002).
The study area spreads over two geological formations: Itajaí Group (Gaspar Formation), composed by meta-cluster rocks, and by non-hydromorphic soils, shallow soils (thickness < 20 cm), and without diagnostic B horizon (Litholic Neosol and Regosols); Tabuleiro Complexe, composed by granite-gneiss rocks, and non-hydromorphic soils, deep soils (thickness > 50 cm), with textural or incipient B horizons (Yellow-Red Ultisol and Haplic Cambisol). Furthermore, associated to these geological formations, there are alluvial areas located in valleys formed by recent sediments. These are constituted by non-hydromorphic soils, with A
horizon resting on C layer and fluvic nature at a depth of 150 cm and, eventually, hydromorphic nature, with glei horizon between 50-150 cm (Fluvic Neosol e Haplic Gleisol) (Santos et al., 2013; Aumond et al., 2018).
The Subtropical Upperhills Broadleaved Evergreen Rainforest (sensu Oliveira-Filho, 2015), hereafter referred to as Subtropical Rainforest, is the predominant vegetation. This forest changes according to local geomorphology, and the underlying soil type. The colonization and occupation of Faxinal do Bepe began in 1953 and lasted until 2004. During this period, most of the forests in the study area were submitted to selective logging and posterior conversion to pastures; nowadays, the pastures are abandoned and covered by vegetation in initial successional stage (Maçaneiro et al., 2017).
4/10 Maçaneiro JP, Liebsch D, Gasper AL, Galvão F, Schorn LA Floresta e Ambiente 2019; 26(1): e20160101
(13 plots), respectively. In these sample plots, all living trees and shrubs with DBH ≥ 5.0 cm were sampled.
The botanical samples were deposited in the Dr. Roberto Miguel Klein Herbarium (Gasper et al., 2014b) and identified by comparison with other voucher specimens with the help of experts. APG IV (2016) and Brazilian Flora 2020 (JBRJ, 2017) were used as classification systems and to check name spelling, respectively.
To analyze floristic and structural variations between the sampled areas, two data matrices were used; the first was constituted by the composition of species and the second by their abundance. Afterwards, Non-metric Multidimensional Scaling (NMDS) was used to verify how sample plots behaved in the multidimensional space of composition and abundance of species. Sørensen’s distance was used for the composition matrix and Bray-Curtis’ distance for the abundance one (Legendre & Legendre, 2012). To verify NMDS’s consistence, a stress measure was calculated, which indicates the amount of variances not explained by the NMDS model (McCune & Grace, 2002). The stress statistical significance was verified by Monte Carlo’s test with 999 permutations, and the confirmation of the stress’ stability in the final portion of the iterations was verified as suggested by McCune & Grace (2002). Finally, the statistical significance of the floristic groupings formed by NMDS was tested using the Analysis of Similarity (ANOSIM).
In order to compare the species richness of sampled areas, rarefaction curves were used according to Mao Tau’s method. In this analysis, rarefaction was based on the number of individuals observed, since the comparison of species richness between different areas can be influenced by the density of individuals on each area (Gotelli & Colwell, 2001).
To describe the vegetation’s structure, classic phytosociological parameters were calculated (density, dominance, relative and absolute frequencies, and the importance value for each species), for each area. Subsequently, the indicator species for each area were analysed and the indicator values for each species were obtained using Tichý & Chytrý’s (2006) method. Statistical significance of each indicator’s value was verified using Monte Carlo’s test with 9,999 permutations.
Vegetation structure was compared using measured dendrometric attributes: medium and maximum
diameter at breast height (DBH), as well as its variance; total minimum, medium and maximum heights and its variance; total basal area; number of individuals and number of bifurcated stems. The comparison between these variables was made using the ANOVA and its means were obtained from Tukey-Kramer’s test, both using a level of significance of α = 5%. ANOVA’s suppositions were checked according to Zar (2010).
3. RESULTS AND DISCUSSION
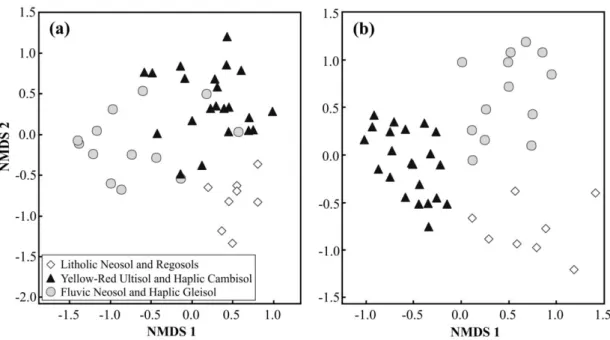
In the Non-metric Multidimensional Scaling (NMDS), composition and abundance of species in the sample plots differed according to soil types (Figure 2). The first two ordination axes of composition and abundance matrices segregated the sample plots situated in Litholic Neosol and Regosols, Fluvic Neosol and Haplic Gleisol and Yellow-Red Ultisol and Haplic Cambisol, and produced 57.3% and 58.7%, respectively, of the correlation between ordination distances and original n-dimensional space. Average stress obtained by real data (composition = 23.9%; abundance = 24.4%) and randomized data (composition = 31.6%; abundance = 28.1%) of the two first ordination axes of NMDS remained stable in the final portion of the iterations, and presented statistical significance (Monte Carlo, p < 0.05). Moreover, the three floristic groups formed by NMDS showed significant differences between each other regarding species composition and abundance (ANOSIM, p < 0.001).
Differences between the analyzed vegetation are related to the environments. Studies on environmental gradients carried out in local scales showed that vegetation distribution is strongly related to soil type (Klein, 1980; Curcio et al., 2007; Schaefer et al., 2015; Scipioni et al., 2015; Maçaneiro et al., 2016a, c). Ferreira-Júnior et al. (2012), for example, mentioned that relief changes imply modifications in soils’ physical and chemical properties and these will influence the distribution pattern of vegetation. In the present study, the different types of soils were the main drivers of the segregation of floristic groups, indicating that physical and chemical characteristics of these soils provide specific conditions and different vegetation composition and structure.
were estimated, considering the standardization of 295 individuals, while other areas indicated decrease in species richness on deep and non-hydromorphic soils (Yellow-Red Ultisol and Haplic Cambisol, with 77 species) and shallow and non-hydromorphic soils (Litholic Neosol and Regosols, with 58 species). Although the number of individuals does not get close to the rarefaction curves’ stabilization in each area analysed, a considerable increase on the number of species according to water availability and soils’ depth was observed. The species richness’ increase, according to water availability and soils’ depth, had already been
described by several authors (Curcio et al., 2007; Ferreira-Júnior et al., 2012; Moulatlet et al., 2014). In the present study, changes in water availability and soils’ depth can lead to modifications in their physical and chemical properties, which are considered the main predictors in trees and shrubs species’ distribution on the Atlantic Subtropical Rainforest (Ferreira-Júnior et al., 2012; Oliveira-Filho et al., 2015; Schaefer et al., 2015; Maçaneiro et al., 2016a).
Fluvic Neosol and Haplic Gleisol areas exhibited the highest species richness values. In the valley-bottom portions a high environmental heterogeneity can occur, along with high fertility, which enables the coexistence of elevated species richness (Teixeira et al., 2008). However, Curcio et al. (2007) consider hydromorphic soils highly selective for most species and, in turn, they tend to present lower specie richness when compared to other soils. Nevertheless, it is worth emphasizing that hydromorphic soils are not predominant in the alluvial lowland areas, which are composed by non-hydromorphic soils. These areas were less affected by anthropogenic processes, since they did not contain a considerable amount of species of economic interest, which could have caused the increase of species richness. On the other hand, the opposite occurred in areas with deep non-hydromorphic soils, such as Yellow-Red Ultisol and Haplic Cambisol, which contained several trees Figure 2. Ordination diagrams of the plots produced by Non-metric Multidimensional Scaling (NMDS), based on composition (a) and abundance (b) of species in 43 sample plots of a Subtropical Rainforest in Southern Brazil.
6/10 Maçaneiro JP, Liebsch D, Gasper AL, Galvão F, Schorn LA Floresta e Ambiente 2019; 26(1): e20160101
species of economic interest (Ocotea catharinensis, Ocotea porosa and Aspidosperma australe, among others) and where selective harvesting was more intense (Schorn & Maçaneiro, 2018).
In the Litholic Neosol and Regosols plots, only 247 individuals of 58 different species were sampled. So, they had the lowest floristic richness registered
among the areas analyzed. This is an area with non-hydromorphic shallow soils (< 20 cm thickness) subjected to water deficit during droughts and with low fertility, that occupies higher altitudes and steep slopes. Total density of individuals was 1,543.8 ind ha-1 and basal area 29.33 m2 ha-1 (Table 1). The vegetation
was composed predominantly by Ocotea puberula,
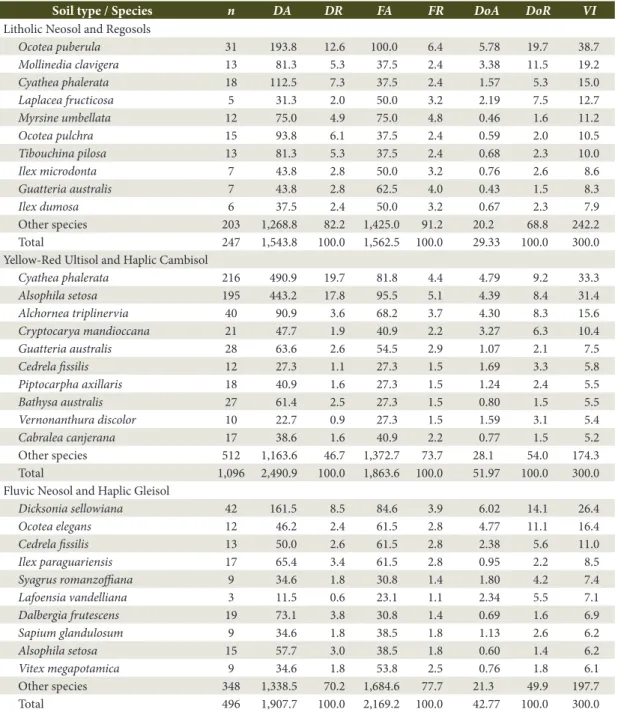
Table 1. Phytosociological parameters calculated for the ten species with higher importance value in three areas of a Subtropical Rainforest in Southern Brazil.
Soil type / Species n DA DR FA FR DoA DoR VI
Litholic Neosol and Regosols
Ocotea puberula 31 193.8 12.6 100.0 6.4 5.78 19.7 38.7 Mollinedia clavigera 13 81.3 5.3 37.5 2.4 3.38 11.5 19.2 Cyathea phalerata 18 112.5 7.3 37.5 2.4 1.57 5.3 15.0 Laplacea fructicosa 5 31.3 2.0 50.0 3.2 2.19 7.5 12.7 Myrsine umbellata 12 75.0 4.9 75.0 4.8 0.46 1.6 11.2 Ocotea pulchra 15 93.8 6.1 37.5 2.4 0.59 2.0 10.5 Tibouchina pilosa 13 81.3 5.3 37.5 2.4 0.68 2.3 10.0 Ilex microdonta 7 43.8 2.8 50.0 3.2 0.76 2.6 8.6 Guatteria australis 7 43.8 2.8 62.5 4.0 0.43 1.5 8.3 Ilex dumosa 6 37.5 2.4 50.0 3.2 0.67 2.3 7.9 Other species 203 1,268.8 82.2 1,425.0 91.2 20.2 68.8 242.2 Total 247 1,543.8 100.0 1,562.5 100.0 29.33 100.0 300.0 Yellow-Red Ultisol and Haplic Cambisol
Cyathea phalerata 216 490.9 19.7 81.8 4.4 4.79 9.2 33.3 Alsophila setosa 195 443.2 17.8 95.5 5.1 4.39 8.4 31.4 Alchornea triplinervia 40 90.9 3.6 68.2 3.7 4.30 8.3 15.6 Cryptocarya mandioccana 21 47.7 1.9 40.9 2.2 3.27 6.3 10.4 Guatteria australis 28 63.6 2.6 54.5 2.9 1.07 2.1 7.5 Cedrela fissilis 12 27.3 1.1 27.3 1.5 1.69 3.3 5.8 Piptocarpha axillaris 18 40.9 1.6 27.3 1.5 1.24 2.4 5.5 Bathysa australis 27 61.4 2.5 27.3 1.5 0.80 1.5 5.5 Vernonanthura discolor 10 22.7 0.9 27.3 1.5 1.59 3.1 5.4 Cabralea canjerana 17 38.6 1.6 40.9 2.2 0.77 1.5 5.2 Other species 512 1,163.6 46.7 1,372.7 73.7 28.1 54.0 174.3 Total 1,096 2,490.9 100.0 1,863.6 100.0 51.97 100.0 300.0 Fluvic Neosol and Haplic Gleisol
Dicksonia sellowiana 42 161.5 8.5 84.6 3.9 6.02 14.1 26.4 Ocotea elegans 12 46.2 2.4 61.5 2.8 4.77 11.1 16.4 Cedrela fissilis 13 50.0 2.6 61.5 2.8 2.38 5.6 11.0 Ilex paraguariensis 17 65.4 3.4 61.5 2.8 0.95 2.2 8.5 Syagrus romanzoffiana 9 34.6 1.8 30.8 1.4 1.80 4.2 7.4 Lafoensia vandelliana 3 11.5 0.6 23.1 1.1 2.34 5.5 7.1 Dalbergia frutescens 19 73.1 3.8 30.8 1.4 0.69 1.6 6.9 Sapium glandulosum 9 34.6 1.8 38.5 1.8 1.13 2.6 6.2 Alsophila setosa 15 57.7 3.0 38.5 1.8 0.60 1.4 6.2 Vitex megapotamica 9 34.6 1.8 53.8 2.5 0.76 1.8 6.1 Other species 348 1,338.5 70.2 1,684.6 77.7 21.3 49.9 197.7 Total 496 1,907.7 100.0 2,169.2 100.0 42.77 100.0 300.0
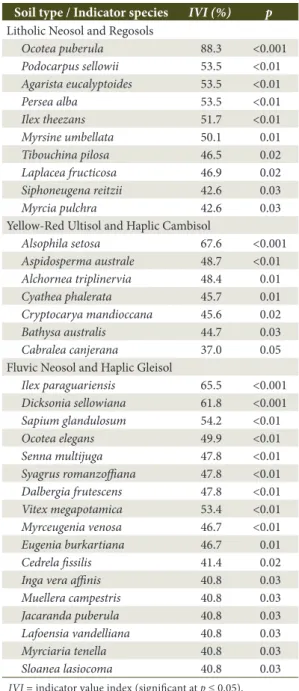
Mollinedia clavigera, Cyathea phalerata, Laplacea fructicosa, and Myrsine umbellata (VI = 96.8%), which characterized it (DR = 31.9%). Ocotea puberula registered an importance value of 38.7%, especially because of its high density (DA = 193.8 ind ha-1), dominance (DoA = 5.78 m2 ha-1) and due to the fact it was found in all plots (FA = 100%). This area also presented ten indicator species, as Ocotea puberula, Podocarpus sellowii, Agarista eucalyptoides, Persea alba, Ilex theezans, and Myrsine umbellata, which added up to more than 50% of the indicator value index (Table 2). In the Yellow-Red Ultisol and Haplic Cambisol area 1,096 individuals of 144 different species were sampled. This area is characterized by its deep non-hydromorphic soils (> 50 cm thickness) and by its incipient B horizon, which improves water retention. Total density was of 2,490.9 ind ha-1 and basal area was of 51.97 m2 ha-1 (Table 1). When compared to Litholic Neosol and Regosols, its vegetation structure is distinct and it is characterized, predominantly, by Cyathea phalerata, Alsophila setosa, Alchornea triplinervia and Cryptocarya mandioccana, which adds up to more than 90% of importance value. Cyathea phalerata and Alsophila setosa have an importance value of 64.7%, especially due to its high density (DR = 37.5%) and to the fact that it can be found in more than 80% of the study area. In this area seven indicator species can be found, with emphasis on Alsophila setosa which has more than 50% of indicator value index (Table 2).
Fluvic Neosol and Haplic Gleisol area is located on the valley-bottom, on alluvial lowlands formed by recent sediments. Due to its location, these areas have a permanent water availability, and can even suffer from water saturated soils most part of the year (hydromorphic soils). In this area 496 individuals of 112 species were sampled. Total density of individuals was 1,907.7 ind ha-1 and basal area 42.77 m2 ha-1 (Table 1). Vegetation structure is characterized, predominantly, by the presence of Dicksonia sellowiana, Ocotea elegans, and Cedrela fissilis, which represented the highest importance value (VI = 53.9%), and characterized the vegetation
physiognomy (DR = 13.5%). Dicksonia sellowiana
exhibited the highest importance value (VI = 26.4%), especially due to its high density (DA = 161.5 ind ha-1), dominance (6.02 m2 ha-1) and to the fact it can be found in more than 80% of the sample plots. Moreover, this area had the biggest number of indicators species, adding up to 17 species, with emphasis on Ilex paraguariensis,
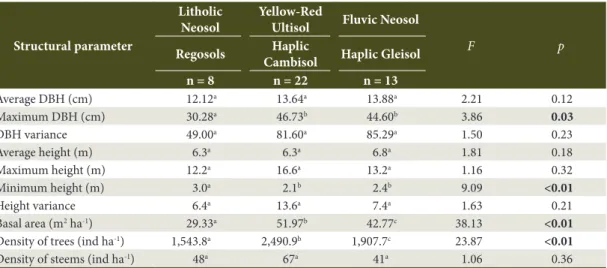
Dicksonia sellowiana, and Sapium glandulosum, which added up to more than 50% of indicator value index. When analyzing the vegetation’s structural parameters, not all dendrometrical variables showed significant differences between each other (Table 3). However, it was confirmed that in areas with Litholic Neosol and Regosols, the maximum DAP and trees’ minimum height were significantly different from
Table 2. Indicator species for each soil type of a Subtropical Rainforest in Southern Brazil.
Soil type / Indicator species IVI (%) p Litholic Neosol and Regosols
Ocotea puberula 88.3 <0.001 Podocarpus sellowii 53.5 <0.01 Agarista eucalyptoides 53.5 <0.01 Persea alba 53.5 <0.01 Ilex theezans 51.7 <0.01 Myrsine umbellata 50.1 0.01 Tibouchina pilosa 46.5 0.02 Laplacea fructicosa 46.9 0.02 Siphoneugena reitzii 42.6 0.03 Myrcia pulchra 42.6 0.03 Yellow-Red Ultisol and Haplic Cambisol
Alsophila setosa 67.6 <0.001 Aspidosperma australe 48.7 <0.01 Alchornea triplinervia 48.4 0.01 Cyathea phalerata 45.7 0.01 Cryptocarya mandioccana 45.6 0.02 Bathysa australis 44.7 0.03 Cabralea canjerana 37.0 0.05 Fluvic Neosol and Haplic Gleisol
Ilex paraguariensis 65.5 <0.001 Dicksonia sellowiana 61.8 <0.001 Sapium glandulosum 54.2 <0.01 Ocotea elegans 49.9 <0.01 Senna multijuga 47.8 <0.01 Syagrus romanzoffiana 47.8 <0.01 Dalbergia frutescens 47.8 <0.01 Vitex megapotamica 53.4 <0.01 Myrceugenia venosa 46.7 <0.01 Eugenia burkartiana 46.7 0.01 Cedrela fissilis 41.4 0.02 Inga vera affinis 40.8 0.03 Muellera campestris 40.8 0.03 Jacaranda puberula 40.8 0.03 Lafoensia vandelliana 40.8 0.03 Myrciaria tenella 40.8 0.03 Sloanea lasiocoma 40.8 0.03
8/10 Maçaneiro JP, Liebsch D, Gasper AL, Galvão F, Schorn LA Floresta e Ambiente 2019; 26(1): e20160101
each other (Tukey-Kramer, p < 0.05), if compared to the other areas analyzed. Tree communities located in shallow, nutrient poor and well drained soil sites may possess individuals with small diameters (Klein, 1980; Carvalho et al., 2005). Thus, soil types can influence tree diameter and height.
A strong gradient was verified between individual’s density increase and their basal area according to the higher soils’ depth (Table 3). In areas with shallow soils (Litholic Neosol and Regosols) density and basal area were statistically lower (Tukey-Kramer, p < 0.0001) when compared to other areas analyzed, in the given order: Fluvic Neosol and Haplic Gleisol, Yellow-Red Ultisol and Haplic Cambisol. This result suggests that, in the studied area, deep soils tend to present more exuberant vegetation when compared to shallow soils, which was already expected due to greater water and oxygen availability for plants, as well as better texture, structure and porosity conditions (Carvalho et al., 2005; Ferreira-Júnior et al., 2012). However, studies focusing on soil’s physical, chemical and morphological attributes shall be conducted in order to confirm this hypothesis.
4. CONCLUSION
The results indicate that vegetation presents consistent floristic and structural variations, since significant patterns in the floristic groups formation were statistically confirmed, according to the analyzed soils.
Species richness increases according to the level of water availability and soils’ depth, whereby lowlands alluvial soils (Fluvic Neosol and Haplic Gleisol) showed the highest species richness, followed by the ones in slopes with deep soils (Yellow-Red Ultisol and Haplic Cambisol), and shallow non-hydromorphic soils (Litholic Neosol and Regosols) showed the lowest species richness.
Attributes related to geology, geomorphology, and pedology are important drivers of floristic and structural variations on an Atlantic Subtropical Rainforest in Santa Catarina. Considering that this study was conducted in a local scale, the same approach should be used in other regions of the Atlantic Subtropical Rainforest, given that these studies should investigate the association among trees/shrubs species and the physical/chemical properties of the soil.
ACKNOWLEDGEMENTS
The authors are grateful to Banco Nacional de Desenvolvimento Econômico e Social (BNDES) and Fundação de Apoio à Pesquisa Científica e Tecnológica do Estado de Santa Catarina (FAPESC) for the financial assistance, and to Coordenação de Aperfeiçoamento de Pessoal de Nível Superior (CAPES) and Conselho Nacional de Desenvolvimento Científico e Tecnológico (CNPq) for the granted research fellowship (306216/2013-2 and 141346/2014-0). We also thank Daiana Vogel and Sandra Mikich for translating and reviewing the text to English.
Table 3. Vegetation’s structural parameters in three soil areas of a Subtropical Rainforest in Southern Brazil.
Structural parameter
Litholic Neosol
Yellow-Red
Ultisol Fluvic Neosol
F p
Regosols Haplic
Cambisol Haplic Gleisol
n = 8 n = 22 n = 13
Average DBH (cm) 12.12a 13.64a 13.88a 2.21 0.12
Maximum DBH (cm) 30.28a 46.73b 44.60b 3.86 0.03
DBH variance 49.00a 81.60a 85.29a 1.50 0.23
Average height (m) 6.3a 6.3a 6.8a 1.81 0.18
Maximum height (m) 12.2a 16.6a 13.2a 1.16 0.32
Minimum height (m) 3.0a 2.1b 2.4b 9.09 <0.01
Height variance 6.4a 13.6a 7.4a 1.63 0.21
Basal area (m2 ha-1) 29.33a 51.97b 42.77c 38.13 <0.01
Density of trees (ind ha-1) 1,543.8a 2,490.9b 1,907.7c 23.87 <0.01
Density of steems (ind ha-1) 48a 67a 41a 1.06 0.36
SUBMISSION STATUS
Received: 2 mar., 2016 Accepted: 22 dec., 2017
CORRESPONDENCE TO
João Paulo de Maçaneiro
Departamento de Ciências Florestais, Universidade Federal do Paraná – UFPR, Avenida Prefeito Lothário Meissner, 900, Jardim Botânico, CEP 80210-170, Curitiba, PR, Brasil e-mail: [email protected]
REFERENCES
Angiosperm Phylogeny Group – APG IV. An update of the Angiosperm Phylogeny Group classification for the orders and families of flowering plants: APG IV. Botanical Journal of the Linnean Society 2016; 181(1): 1-20. http:// dx.doi.org/10.1111/boj.12385.
Aumond JJ, Fenilli TAB, Maçaneiro JP, Hodecker A, Zatelli KS. Unidades geoambientais. In: Vitorino MD, Adenesky E Fo, editores. Diagnóstico prévio: subsídio preliminar para projetos de restauração ecossistêmica. Blumenau: Edifurb; 2018.
Carvalho DA, Oliveira-Filho AT, Vilela EA, Curi N, Van Den Berg E, Fontes MAL et al. Distribuição de espécies arbóreo-arbustivas ao longo de um gradiente de solos e topografia em um trecho de floresta ripária do Rio São Francisco em Três Marias, MG, Brasil. Brazilian Journal of Botany 2005; 28(2): 329-345. http://dx.doi.org/10.1590/ S0100-84042005000200013.
Curcio GR, Galvão F, Bonnet A, Barddal ML, Dedecek RA. A floresta fluvial em dois compartimentos do rio Iguaçu, Paraná, Brasil. Floresta 2007; 37(2): 125-147. http://dx.doi.org/10.5380/rf.v37i2.8645.
Ferreira-Júnior WG, Schaefer CEGR, Silva AFS. Uma visão pedogeomorfológica sobre as formações florestais da Mata Atlântica. In: Martins SV. Ecologia de florestas tropicais do Brasil. Viçosa: UFV; 2012.
Gasper AL, Vibrans AC, Funez LA, Rigon MJ Jr, Bittencourt F, Vieira C. Dr. Roberto Miguel Klein Herbarium (FURB), Blumenau, Southern Brazil. PhytoKeys 2014a; 42(4): 21-37. http://dx.doi.org/10.3897/phytokeys.42.6865. PMid:25383009.
Gasper AL, Uhlmann A, Sevegnani L, Meyer L, Lingner DV, Verdi M et al. Floristic and Forest Inventory of Santa Catarina: species of evergreen rainforest. Rodriguésia
2014b; 65(4): 807-816. http://dx.doi.org/10.1590/2175-7860201465401.
Gibson L, Lee TM, Koh LP, Brook BW, Gardner TA, Barlow J et al. Primary forests are irreplaceable for sustaining tropical biodiversity. Nature 2011; 478(7369): 378-381. http://dx.doi.org/10.1038/nature10425. PMid:21918513. Gotelli NJ, Colwell RK. Quantifying biodiversity: procedures and pitfalls in the measurement and comparison of species richness. Ecology Letters 2001; 4(4): 379-391. http://dx.doi. org/10.1046/j.1461-0248.2001.00230.x.
Jardim Botânico do Rio de Janeiro – JBRJ. Brazilian Flora 2020 em construção [online]. Rio de Janeiro: JBRJ; 2017 [cited 2017 Nov 28]. Available from: http://floradobrasil. jbrj.gov.br/
Klein RM. Ecologia da flora e vegetação do Vale do Itajaí.
Sellowia 1980; 1(32): 165-389.
Legendre P, Legendre L. Numerical ecology. Amsterdan: Elsevier; 2012.
Maçaneiro JP, Schorn LA, Sevegnani L, Vibrans AC. Structure of the tree component and indicator species in different types of forests in the Itajaí-Mirim river, Southern Brazil. Australian Journal of Basic and Applied Sciences 2015a; 9(33): 392-397.
Maçaneiro JP, Seubert RC, Schorn LA. Phytosociology of a primary Subtropical Rain Forest in Southern Brazil.
Floresta 2015b; 45(3): 555-566.
Maçaneiro JP, Oliveira LZ, Seubert RC, Eisenlohr PV, Schorn LA. More than environmental control at local scales: do spatial processes play an important role on floristic variations in Subtropical Forests? Acta Botanica Brasílica
2016a; 30(2): 183-192. http://dx.doi.org/10.1590/0102-33062015abb0294.
Maçaneiro JP, Oliveira LZ, Eisenlohr PV, Schorn LA. Paradox between species diversity and conservation: a Subtropical Atlantic Forest reserve in Brazil has similar tree species diversity to unprotected sites in the same region. Tropical Conservation Science 2016b; 9(1): 1-19. Maçaneiro JP, Seubert RC, Schorn LA. Do variations in the composition and structure of vegetation allow floristic groups to be detected in a subtropical moist forest in southern Brazil? Biotemas 2016c; 29(4): 43-58.
Maçaneiro JP, Gasper AL, Schorn LA, Galvão F. Few dominant native woody species: how subtropical rainforest successional process acts on abandoned pastures in Southern Brazil. Applied Ecology and Environmental Research 2017; 15(4): 1633-1676. http://dx.doi.org/10.15666/ aeer/1504_16331676.
Marangon LC, Soares JJ, Feliciano ALP, Lani JL, Matos LV. Relação entre vegetação e pedoformas na Mata do Paraíso, município de Viçosa, Minas Gerais. Revista Árvore 2013; 37(3): 441-450. http://dx.doi.org/10.1590/ S0100-67622013000300007.
McCune B, Grace JB. Analysis of ecological communities. Gleneden Beach: MJM Software Design; 2002.
10/10Maçaneiro JP, Liebsch D, Gasper AL, Galvão F, Schorn LA Floresta e Ambiente 2019; 26(1): e20160101
in Lowland Amazonian Forests. Biotropica 2014; 46(4): 396-403. http://dx.doi.org/10.1111/btp.12117.
Myers N. Biodiversity hotspots revisited. Bioscience 2003; 53(10): 796-797.
Oliveira-Filho AT, Budke JC, Jarenkow JA, Eisenlohr PV, Neves DRM. Delving into the variations in tree species composition and richness across South American subtropical Atlantic and Pampean forests. Journal of Plant Ecology
2015; 8(3): 242-260. http://dx.doi.org/10.1093/jpe/rtt058. Oliveira-Filho AT. Um sistema de classificação fisionômico-ecológico da vegetação neotropical: segunda aproximação. In: Eisenlohr PV, Felfili JM, Melo MMRF, Andrade LA, Meira JAA No, editores. Fitossociologia no Brasil: métodos e estudos de casos. Viçosa: UFV; 2015.
Pandolfo C, Braga HJ, Silva VP Jr, Massignan AM, Pereira ES, Thomé VMR et al. Atlas climatológico do Estado de Santa Catarina. Florianópolis: Epagri; 2002. CD-ROM. Santos HG, Jacomine PKT, Anjos LHC, Oliveira VÁV, Lumbreras JF, Coelho MR et al. Sistema Brasileiro de Classificação de Solos. 3. ed. Brasília: Embrapa; 2013. Schaefer CEGR, Nunes JA, Neri AV, Mendonça BAF, Ferreira-Júnior WG, Arruda DM et al. Relação solo-vegetação em formações vegetacionais brasileiras: metodologia e estudos de caso. In: Eisenlohr PV, Felfili, JM, Melo MMRF, Andrade LA, Meira JAA No, editores.
Fitossociologia no Brasil: métodos e estudos de casos. Viçosa: UFV; 2015.
Schorn LA, Maçaneiro JP. Levantamento da vegetação. In: Vitorino MD, Adenesky E Fo, editores. Diagnóstico
prévio: subsídio preliminar para projetos de restauração ecossistêmica. Blumenau: Edifurb; 2018.
Scipioni MC, Galvão F, Longhi SJ, Pedron FA. Gradiente ambiental em comunidades arbóreas no baixo rio Jacuí.
Ciência Rural 2015; 45(10): 1802-1808. http://dx.doi. org/10.1590/0103-8478cr20131371.
Teixeira AP, Assis MA, Siqueira FR, Casagrande JC. Tree species composition and environmental relationships in a Neotropical swamp forest in Southeastern Brazil.
Wetlands Ecology and Management 2008; 16(6): 451-461. http://dx.doi.org/10.1007/s11273-008-9082-x.
Tichý L, Chytrý M. Statistical determination of diagnostic species for site groups of unequal size. Journal of Vegetation Science 2006; 17(6): 809-818. http://dx.doi. org/10.1111/j.1654-1103.2006.tb02504.x.
Vibrans AC, McRoberts RE, Lingner DV, Nicoletti AL, Moser P. Extensão original e atual da cobertura florestas de Santa Catarina. In: Vibrans AC, Sevegnani L, Gasper AL, Lingner DV, editores. Inventário Florístico Florestal de Santa Catarina: diversidade e conservação dos remanescentes florestais. Blumenau: Edifurb; 2012.
Vibrans AC, Mcroberts RE, Moser P, Nicoletti AL. Using satellite image-based maps and ground inventory data to estimate the area of the remaining Atlantic forest in the Brazilian state of Santa Catarina. Remote Sensing of Environment 2013; 130(1): 87-95. http://dx.doi.org/10.1016/j. rse.2012.10.023.