https://doi.org/10.1590/0004-282X20180038 ARTICLE
Longitudinal analysis of verbal episodic
memory in patients with relapsing-remitting
multiple sclerosis
Análise longitudinal da memória episódica verbal em pacientes com esclerose múltipla
remitente-recorrente
Izadora Nogueira Fonte Boa1, Carolina de Medeiros Rimkus1, Kenia Repiso Campanholo1, Samira Luisa Apóstolos
Pereira1, Thiago de Faria Junqueira1, Melissa de Almeida Rodrigues Machado1, Dagoberto Callegaro1, Maria
Concepción García Otaduy1, Claudia da Costa Leite1, Eliane Correa Miotto1
1Universidade de São Paulo, Faculdade de Medicina, Hospital das Clínicas, Departamento de Neurologia, São Paulo SP, Brasil.
Correspondence: Izadora Nogueira Fonte Boa; Rua Piranhas, 48, apto 302; 30770-540 Belo Horizonte MG, Brasil; E-mail: [email protected]
Conflict of interest: There is no conflict of interest to declare.
Received 02 August 2017; Received in final form 12 January 2018; Accepted 22 February 2018.
ABSTRACT
Objective: A 4.5-year follow-up study was conducted to characterize baseline verbal episodic memory (VEM) and its behavior and to assess the effects of relapsing-remitting multiple sclerosis (RRMS) on this domain. Methods: Twenty-nine patients with RRMS underwent two neuropsychological assessments performed an average of 4.5 years apart. Twenty-six control participants underwent a single neuropsychological assessment. A significance level of p < 0.005 was adopted to denote a significant difference between the groups on the Mann Whitney and Wilcoxon paired statistical analyses. Results: No statistical difference was found in the results of the VEM tests between the first and second neuropsychological assessments of the patients. However, a statistical difference was evident between the patient and control groups in the results of the VEM tests. Conclusion: The patient group showed changes in the VEM relative to the control group. After approximately 4.5 years of disease, the patient performance on the VEM stabilized or improved.
Keywords: multiple sclerosis; cognition; longitudinal studies.
RESUMO
Objetivo: Neste estudo, propomos a caracterização da Memória Episódica Verbal (MEV) basal e o seu comportamento após o período de 4,5 anos de doença, a fim de avaliar o efeito da EMRR neste domínio. Métodos: Vinte e nove pacientes com EMRR foram submetidos a duas avaliações neuropsicológicas realizadas entre um intervalo de tempo médio de 4,5 anos. Vinte e seis controles foram submetidos à avaliação neuropsicológica única. Considerou-se nível de significância p <0,005 para delinear diferença significante entre os grupos nas análises estatísticas Mann Whitney e Wilcoxon pareado. Resultados: Não houve diferença estatística nos resultados dos testes de MEV entre a primeira e segunda avaliação neuropsicológica realizada pelos pacientes. Houve discrepância estatística nos resultados dos testes de MEV entre o grupo dos pacientes e controles. Conclusão: O grupo de pacientes apresentou alterações de MEV quando comparado aos controles. Após 4,5 anos aproximadamente os pacientes estabilizaram ou melhoraram seu desempenho em MEV.
Palavras chave: esclerose múltipla; cognição; estudos longitudinais.
Patients with multiple sclerosis (MS) clinically present with a myriad of neurologic symptoms, including cogni-tive decline, regarded as having the greatest impact on key aspects of their daily living, such as managing domestic tasks, participating in society and holding down a job1.
According to reviews of the scientific literature, one third
of MS patients with the relapsing-remitting (RRMS) clinical form show cognitive impairments that are often milder than that found in the progressive subtypes of the disease2,3.
Cognitive impairments can vary, but an impact on epi-sodic memory is evident in the early stages of the disease. A 10-year longitudinal study revealed that decline in information
processing speed and verbal episodic memory (VEM) in early RRMS patients predicted progression to the secondary pro-gressive MS clinical form. Given that secondary propro-gressive MS is a more severe stage of the disease, assessing these cog-nitive domains in the early stages of MS is vital4.
A scientific review of the related literature1 reported that
episodic memory is one of the most common deficits found in
MS, occurring in 40–65% of patients. Evidence on the nature
assimilation of new information in patients relative to con-trols, yet once the information has been acquired, delayed recall and recognition ability in patients had proven to be similar to those of healthy controls5.
Numerous cross-sectional studies investigating the prev-alence and pattern of cognitive dysfunction in MS are avail-able in the literature. However, there is a dearth of studies on the evolution of the disease, from a cognitive viewpoint, over
the course of time. The results of longitudinal studies in the literature are conflicting, reporting cognitive improvement,
stability or decline in patients over time6.
The objective of this study was to conduct a longitudinal
assessment of VEM at two time points, consisting of a base-line assessment and another at 4.5 years of disease later, to assess the impact of RRMS on the VEM over this period. In order to characterize the VEM in RRMS patients at baseline, results were compared against those of the healthy controls.
The characterization of sociodemographic and clinical vari -ables, as well as correlation between attention and executive functions and VEM, were analyzed at the baseline assessment.
METHODS
Participants
The study sample comprised 29 patients with RRMS (19 women and 10 men), whereas the control group com -prised 26 healthy subjects (17 women and nine men). Patients were recruited from the clinic for demyelinating diseases of the Department of Neurology of the Clínicas Hospital of the São Paulo University School of Medicine.
The study sample included patients diagnosed with RRMS
based on the McDonald criteria (2010)7. All patients under-went an initial cognitive assessment to establish a baseline. In addition, only patients with an IQ within or above the mean expected IQ for age (mean = 106.60; SD = 7.65) were included, on the premise that patients of lower intelligence may have worse cognitive performance. Patient IQ was determined at baseline using the Vocabulary and Matrix Reasoning subtests of the Wechsler Adult Intelligence Scale-Revised (WAIS-III)8.
The exclusion criteria included: patients who had evolved to progressive clinical subtypes, patients with deficits that
prevented assessment, patients with other central nervous system disease, patients with relapse less than 30 days before
the study, patients using corticosteroids for the last 90 days
before the examination, patients with a Mini-Mental State
Examination (MMSE) score below the cut-off. Owing to the
lack of normative MMSE data for the Brazilian population for
the age stratum of the present sample, cut-off scores for the
educational level were employed9.
The control group was formed by selecting healthy partici -pants matched for age, educational level and gender with the patients in the study group. Volunteers using psychoactive or neuroleptic medications or with a history of alcohol or illegal
drug abuse were excluded. Control participants scoring below
the cut-off on the MMSE for educational level9 and above the
cut-off on the Hospital Anxiety and Depression Scale (8 for symptoms of anxiety and 9 for depression) were excluded10.
Instruments and procedures
The patients underwent a comprehensive cognitive assess
-ment, which included specific tests of VEM such as the Hopkins
Verbal Learning Test11 and the Logical Memory subtest of the Memory Wechsler Scale12 (Table 1). The same protocol was used for the assessments at the study baseline and endpoint.
The interval between the two neuropsychological assess -ments applied to the patient group ranged from 3.1 to 5.7 years with a mean and standard deviation of 4.5 (0.7) years.
The mood assessment of the patients was carried out
at both baseline and follow-up using the Beck Depression Inventory13 and the Hospital Anxiety and Depression Scale10.
Patients, specifically, underwent the neurologic examina -tion at two time points to identify the degree of physical dis-ability by completing the Expanded Disdis-ability Status Scale14 applied by the neurologist.
The healthy participants from the control group were
given a single neuropsychological assessment using the same instrument that was applied to the patient group (Table 1).
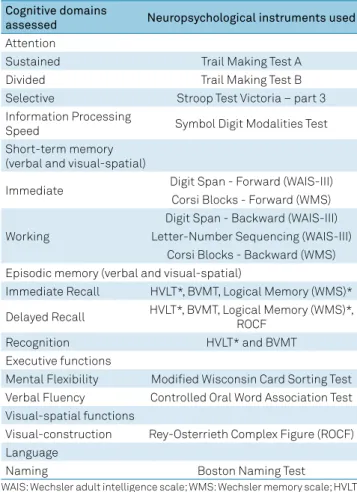
Table 1. Neuropsychological instruments used and cognitive domains assessed.
Cognitive domains
assessed Neuropsychological instruments used
Attention
Sustained Trail Making Test A
Divided Trail Making Test B
Selective Stroop Test Victoria – part 3
Information Processing
Speed Symbol Digit Modalities Test
Short-term memory (verbal and visual-spatial)
Immediate Digit Span - Forward (WAIS-III)
Corsi Blocks - Forward (WMS)
Working
Digit Span - Backward (WAIS-III) Letter-Number Sequencing (WAIS-III)
Corsi Blocks - Backward (WMS) Episodic memory (verbal and visual-spatial)
Immediate Recall HVLT*, BVMT, Logical Memory (WMS)*
Delayed Recall HVLT*, BVMT, Logical Memory (WMS)*, ROCF
Recognition HVLT* and BVMT
Executive functions
Mental Flexibility Modified Wisconsin Card Sorting Test Verbal Fluency Controlled Oral Word Association Test Visual-spatial functions
Visual-construction Rey-Osterrieth Complex Figure (ROCF) Language
Naming Boston Naming Test
Additional clinical data for the patients were drawn directly from medical records held at the neurology clinic of the Clínicas Hospital (Hospital das Clínicas) of the São Paulo University School of Medicine. All patients were using dis-ease modifying therapies, although there were some changes and interruptions during the follow-up period
(non-adher-ence to treatment) for different reasons such as the pres(non-adher-ence of collateral effects, pregnancy and due to patients seeking
alternative treatment.
All study participants signed the free and informed con-sent form when asked to undergo the examinations.
Statistical analysis
Statistical analyses were carried out using the SPSS V20 for Windows 8.1 software package. Cognitive data extracted from the sample were expressed as mean, standard deviation, median and measures of spread. Raw scores were converted into Z-scores to allow comparison of the data. Data on the use of medication by patients were expressed as absolute medians. Sociodemographic data for the control and patient groups were compared using the Student’st-test.
The normality of cognitive data extracted from the neuro -psychological tests of patients was analyzed by the Shapiro-Wilktest. Given that most of the variables exhibited a non-nor-mal distribution, non-parametric statistical tests were applied.
Cognitive data collected from patients at the first and sec -ond neuropsychological assessments were analyzed using the
Wilcoxon paired statistical test. The Mann Whitney statistical
test was used to compare the cognitive data from the baseline neuropsychological assessments of patients versus controls.
Spearman’s correlation was used to better characterize
patient deficits in VEM at the baseline assessment and to
determine a possible relationship or interdependence among the clinical, sociodemographic and physical disability vari-ables of patients for VEM.
The following clinical variables were investigated: dis -ease duration, time since last relapse, number of relapses, use of disease modifying therapies, and use of antidepressants.
Sociodemographic variables were: age, education and gen -der. Lastly, the variable for physical disability was assessed by the EDSS (Expanded Disability Status Scale).
Because executive functioning and attention play a role in the memorization and learning process, instruments assessing these cognitive domains were also correlated with the VEM tests using Spearman’s correlation. Variables showing a level of
significance of p ≤ 0.05 on this statistical test were included in the covariance analysis. Thus, it was possible to check whether differences between patient and control performances on the VEM test persisted even after controlling for the effects of the
attention and executive functioning tests.
RESULTS
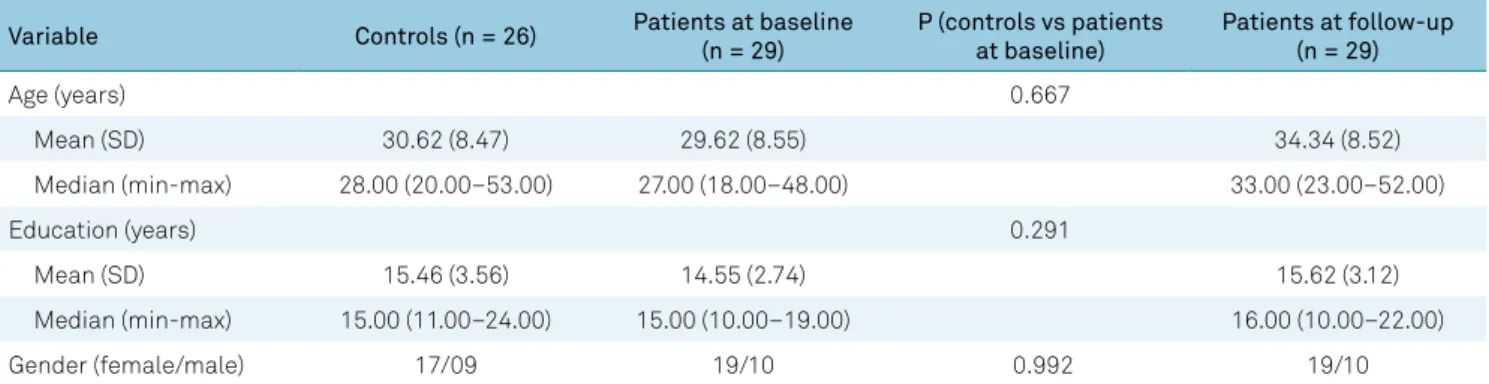
Sociodemographic data for the control and patient
groups are given in Table 2. There was no statistically sig
-nificant difference between the groups for age, educational
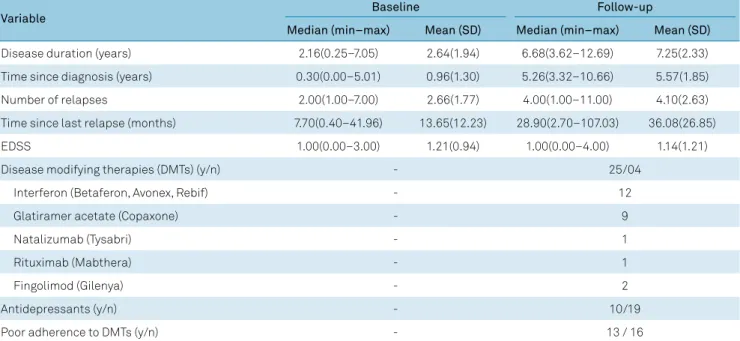
level or gender. Clinical and physical disability data for the patient group at the baseline assessment are given in Table 3. At the follow-up, mean disease duration was 7.25 years (SD = 2.33), time since diagnosis was 5.57 years (SD = 1.85) and the mean number of relapses was 4.10 (SD = 2.63).
Twenty-five patients were on a disease modifying drug and 13 out of the 29 patients discontinued this. Ten patients were using an
antidepressant at the follow-up.
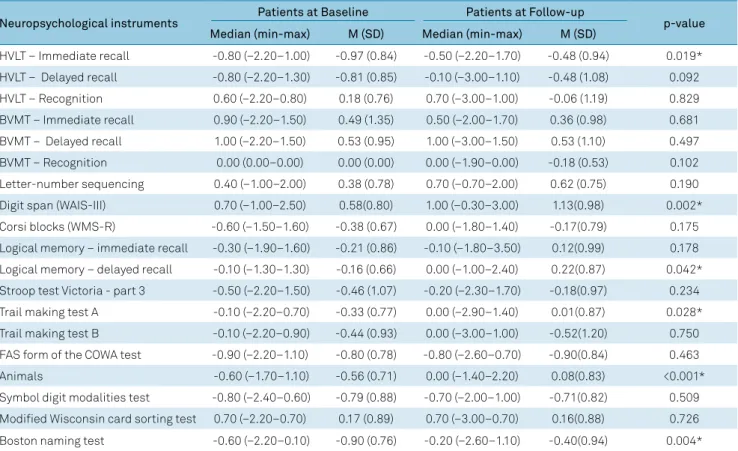
The results of the longitudinal analysis, shown in Table 4, indicate patient stability in VEM, with statistically significant
improvement on the immediate recall of the Hopkins Verbal
Learning Test (p = 0.019) and delayed recall of the Logical
Memory test (p = 0.042). In addition, there were statistically
significant improvements by patients on the tests assessing
sustained attention (Trail Making Test A) and working mem-ory (WAIS-III Digit span), as well as on the semantic verbal
fluency (animals) and naming tasks (Boston Naming Test). At
the follow-up, patient scores on the MMSE ranged from 27 to
30 points, with a mean and standard deviation of 29.17 (0.84). The results of the baseline assessment of control partic -ipants were statistically better than those of the patients.
The patients had worse performance than the controls on
the VEM tests for the immediate recall task of the Hopkins Verbal Learning Test (p = 0.001; p = 0.006) and for the delayed recall of the Logical Memory test (p = 0.013; p = 0.003).
Table 2. Sociodemographic data of sample of patients and controls.
Variable Controls (n = 26) Patients at baseline
(n = 29)
P (controls vs patients at baseline)
Patients at follow-up (n = 29)
Age (years) 0.667
Mean (SD) 30.62 (8.47) 29.62 (8.55) 34.34 (8.52)
Median (min-max) 28.00 (20.00–53.00) 27.00 (18.00–48.00) 33.00 (23.00–52.00)
Education (years) 0.291
Mean (SD) 15.46 (3.56) 14.55 (2.74) 15.62 (3.12)
Median (min-max) 15.00 (11.00–24.00) 15.00 (10.00–19.00) 16.00 (10.00–22.00)
Gender (female/male) 17/09 19/10 0.992 19/10
The statistically significant poorer performances of patients also occurred in the attention, semantic verbal fluency and
naming processes. Comparison of quantitative results for the sample of patients and controls on the neuropsychological test battery is given in Table 5.
Also, regarding the VEM, no statistically significant difference
in the recognition phase of the Hopkins Verbal Learning Test was evident on comparison of the patient and control groups, or comparison of the longitudinal performance of patients.
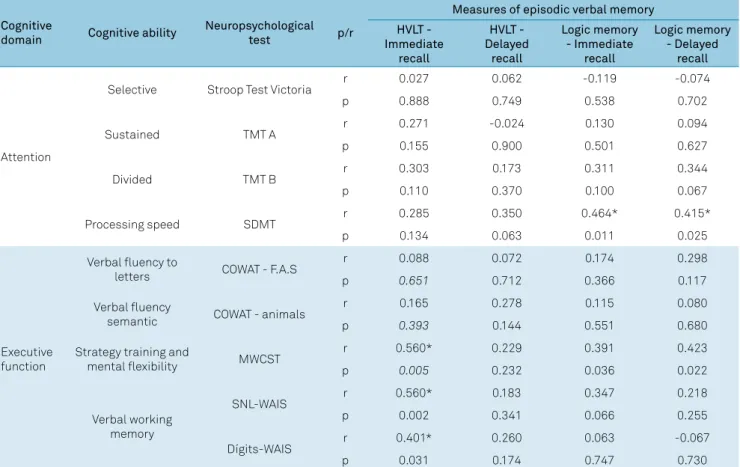
Spearman’s analysis revealed a strong positive correlation between attention and executive tasks with VEM tasks, suggest-ing that mnemonic impairments were accompanied by
atten-tional and executive deficits (Table 6). The executive function tests exhibiting this correlation were the Modified Wisconsin Card Sorting Test (assessing strategy and mental flexibility) and
the Letter-Number Sequencing and Digit Span subtests of the WAIS-III (both assessing verbal working memory). One atten-tion test (Symbol Digit Modalities Test) correlated with the VEM
tests. The Symbol Digit Modalities Test provides a more accu -rate assessment of information processing speed.
On the analysis of covariance using the attention and
execu-tive function tests cited above (Modified Wisconsin Card Sorting
Test, Letter-Number Sequencing, Digit Span, and Symbol Digit
Modalities Test), the patient group at baseline differed from the
control group on the VEM tests even when including the atten-tion and executive funcatten-tioning measures (Table 7).
No correlation was found between VEM and sociode-mographic status or clinical and physical disability data for patients at baseline or follow-up.
With regard to mood, patients in the sample had mean
scores below the cut-off point on the scales assessing this
parameter at both baseline and follow-up.
At the baseline, only three patients (3%) had mild
depres-sion while the remainder were classified as having minimal or nonsignificant depression with a mean and standard devi
-ation of 6.68 (5.22), where a score of up to 10 points defines minimal depression/nonsignificant.
At the follow-up, the mean score for the sample was below
the cut-off point for mood, i.e. no significant symptoms of
anxiety (mean = 7.14, SD = 3.20) or depression (mean = 5.15, SD = 3.04).
DISCUSSION
In the present study, the group of RRMS patients showed
VEM deficits at the baseline assessment compared to the group of healthy controls. These changes were characterized
by poor patient performance on encoding (immediate recall) and retrieval (delayed recall) of information on VEM tasks.
The groups did not differ statistically on the recognition stage
assessing storage. According to a systematic review on the subject1, this result can be expected for the
neuropsychologi-cal profile of MS, but the nature of decline in episodic mem -ory, however, is controversial.
Chiaravalloti e DeLuca1 discussed whether the nature of
VEM impairment is characterized by ineffective performance
at the stages of information encoding, retrieval or both these stages5. There is evidence in the literature showing that impair -ments in working memory15, processing speed1, strategies16 and resistance to distractibility5 can negatively impact
epi-sodic memory functioning. Other studies have shown deficits in delayed recall, even in patients receiving sufficient help to
assimilate the information at the encoding stage, suggesting
Table 3. Clinical data of patients at baseline and follow-up.
Variable Baseline Follow-up
Median (min–max) Mean (SD) Median (min–max) Mean (SD)
Disease duration (years) 2.16(0.25–7.05) 2.64(1.94) 6.68(3.62–12.69) 7.25(2.33)
Time since diagnosis (years) 0.30(0.00–5.01) 0.96(1.30) 5.26(3.32–10.66) 5.57(1.85)
Number of relapses 2.00(1.00–7.00) 2.66(1.77) 4.00(1.00–11.00) 4.10(2.63)
Time since last relapse (months) 7.70(0.40–41.96) 13.65(12.23) 28.90(2.70–107.03) 36.08(26.85)
EDSS 1.00(0.00–3.00) 1.21(0.94) 1.00(0.00–4.00) 1.14(1.21)
Disease modifying therapies (DMTs) (y/n) - 25/04
Interferon (Betaferon, Avonex, Rebif) - 12
Glatiramer acetate (Copaxone) - 9
Natalizumab (Tysabri) - 1
Rituximab (Mabthera) - 1
Fingolimod (Gilenya) - 2
Antidepressants (y/n) - 10/19
Poor adherence to DMTs (y/n) - 13 / 16
Table 4. Data in Z-scores obtained by patients on cognitive tests – baseline vs. follow-up.
Neuropsychological instruments Patients at Baseline Patients at Follow-up p-value
Median (min-max) M (SD) Median (min-max) M (SD)
HVLT – Immediate recall -0.80 (–2.20–1.00) -0.97 (0.84) -0.50 (–2.20–1.70) -0.48 (0.94) 0.019*
HVLT – Delayed recall -0.80 (–2.20–1.30) -0.81 (0.85) -0.10 (–3.00–1.10) -0.48 (1.08) 0.092
HVLT – Recognition 0.60 (–2.20–0.80) 0.18 (0.76) 0.70 (–3.00–1.00) -0.06 (1.19) 0.829
BVMT – Immediate recall 0.90 (–2.20–1.50) 0.49 (1.35) 0.50 (–2.00–1.70) 0.36 (0.98) 0.681
BVMT – Delayed recall 1.00 (–2.20–1.50) 0.53 (0.95) 1.00 (–3.00–1.50) 0.53 (1.10) 0.497
BVMT – Recognition 0.00 (0.00–0.00) 0.00 (0.00) 0.00 (–1.90–0.00) -0.18 (0.53) 0.102
Letter-number sequencing 0.40 (–1.00–2.00) 0.38 (0.78) 0.70 (–0.70–2.00) 0.62 (0.75) 0.190
Digit span (WAIS-III) 0.70 (–1.00–2.50) 0.58(0.80) 1.00 (–0.30–3.00) 1.13(0.98) 0.002*
Corsi blocks (WMS-R) -0.60 (–1.50–1.60) -0.38 (0.67) 0.00 (–1.80–1.40) -0.17(0.79) 0.175
Logical memory – immediate recall -0.30 (–1.90–1.60) -0.21 (0.86) -0.10 (–1.80–3.50) 0.12(0.99) 0.178
Logical memory – delayed recall -0.10 (–1.30–1.30) -0.16 (0.66) 0.00 (–1.00–2.40) 0.22(0.87) 0.042*
Stroop test Victoria - part 3 -0.50 (–2.20–1.50) -0.46 (1.07) -0.20 (–2.30–1.70) -0.18(0.97) 0.234
Trail making test A -0.10 (–2.20–0.70) -0.33 (0.77) 0.00 (–2.90–1.40) 0.01(0.87) 0.028*
Trail making test B -0.10 (–2.20–0.90) -0.44 (0.93) 0.00 (–3.00–1.00) -0.52(1.20) 0.750
FAS form of the COWA test -0.90 (–2.20–1.10) -0.80 (0.78) -0.80 (–2.60–0.70) -0.90(0.84) 0.463
Animals -0.60 (–1.70–1.10) -0.56 (0.71) 0.00 (–1.40–2.20) 0.08(0.83) <0.001*
Symbol digit modalities test -0.80 (–2.40–0.60) -0.79 (0.88) -0.70 (–2.00–1.00) -0.71(0.82) 0.509
Modified Wisconsin card sorting test 0.70 (–2.20–0.70) 0.17 (0.89) 0.70 (–3.00–0.70) 0.16(0.88) 0.726
Boston naming test -0.60 (–2.20–0.10) -0.90 (0.76) -0.20 (–2.60–1.10) -0.40(0.94) 0.004*
*p < 0.05; HVLT: Hopkins verbal learning test; BVMT: Brief visuospatial memory test; WAIS: Wechsler adult intelligence scale; WMS: Wechsler memory scale; HVLT: Hopkins verbal learning test-revised; BVMT: brief visuospatial memory test-revised; COWA: controlled oral word association.
Table 5. Cognitive data at baseline for patient vs.control groups.
Neuropsychological instruments Patients at Baseline Control p-value1
Median (min–max) M (SD) Median (min–max) M (SD)
HVLT – Immediate recall -0.80 (–2.20–1.00) -0.97 (0.84) 0.15 (–1.30–1.30) -0.05 (0.82) < 0.001*
HVLT – Delayed recall -0.80 (–2.20–1.30) -0.81 (0.85) 0.00 (–1.70–1.00) -0.08 (0.93) 0.006*
HVLT– Recognition 0.60 (–2.20–0.80) 0.18 (0.76) 0.80 (–0.80–0.80) 0.29 (0.65) 0.495
BVMT – Immediate recall 0.90 (–2.20–1.50) 0.49 (1.35) 0.80 (–2.20–2.00) 0.69 (0.89) 0.826
BVMT – Delayed recall 1.00 (–2.20–1.50) 0.53 (0.95) 1.05 (–2.20–1.50) 0.78 (0.81) 0.314
BVMT – Recognition 0.00 (0.00–0.00) 0.00 (0.00) 0.00 (0.00–0.00) 0.00 (0.00) > 0.999
Letter-number sequencing 0.40 (–1.00–2.00) 0.38 (0.78) 0.55 (–1.00–4.00) 0.81 (1.25) 0.300
Digit span (WAIS-III) 0.70 (–1.00–2.50) 0.58 (0.80) 0.70 (–1.00–4.00) 0.85 (1.11) 0.553
Corsi blocks (WMS-R) -0.60 (–1.50–1.60) -0.38 (0.67) 0.00 (–2.00–2.00) -0.12 (0.98) 0.184
Logical memory – immediate recall -0.30 (–1.90–1.60) -0.21 (0.86) 0.35 (–1.00–1.90) 0.38 (0.81) 0.013*
Logical memory – delayed recall -0.10 (–1.30–1.30) -0.16 (0.66) 0.50 (–1.30–2.40) 0.47 (0.81) 0.003*
Stroop test Victoria – part 3 -0.50 (–2.20–1.50) -0.46 (1.07) 0.55 (–2.10–2.50) 0.36 (0.89) 0.007*
Trail making test A -0.10 (–2.20–0.70) -0.33 (0.77) 0.05 (–2.20–1.60) -0.05 (0.95) 0.227
Trail making test B -0.10 (–2.20–0.90) -0.44 (0.93) 0.20 (–3.00–2.00) 0.12 (1.17) 0.023*
FAS form of the COWA test -0.90 (–2.20–1.10) -0.80 (0.78) -0.45 (–1.50–1.30) -0.40 (0.75) 0.050
Animals form of the COWA test -0.60 (–1.70–1.10) -0.56 (0.71) 0.05 (–1.70–2.30) 0.08 (0.98) 0.009*
Symbol digit modalities test -0.80 (–2.40–0.60) -0.79 (0.88) -0.40 (–1.50–1.60) -0.14 (0.90) 0.017*
Modified Wisconsin card sorting test 0.70 (–2.20–0.70) 0.17 (0.89) 0.70 (–1.60–0.70) 0.30 (0.70) 0.731
Boston naming test -0.60 (–2.20–0.10) -0.90 (0.76) -0.30 (–2.20–1.30) -0.37 (0.88) 0.007*
1: comparison between patient and control groups at baseline using the Mann Whitney test. *p < 0.05;
accelerated forgetting in MS5. Based on the current findings
of deficits at both the encoding and delayed recall stages, the
nature of the episodic memory impairment might be explained
in both phases by the brain areas affected5.
In the present study, the results on tests assessing pro-cessing speed, strategy building and working memory cor-related with those of VEM tests at the baseline assessment,
thereby corroborating the findings in the literature outlined
in the previous paragraph. However, the covariance analysis,
even when including the effects of the executive function and
attention tests on the VEM tests, revealed that the patient
and control groups differed at baseline. This finding may
be explained by other attentional and executive processes
that impact episodic memory but have yet to be correlated. Another hypothesis is that mnemonic impairments occur independently of attentional and executive processes.
The scores obtained by patients on VEM tasks showed no
correlation with sociodemographic status or with clinical and
physical disability data of patients at baseline or follow-up. These
variables have been the focus of studies to ascertain whether they impact cognitive functioning or otherwise, although a
review has shown conflicting results in the literature2.
In the longitudinal analysis of the present study, the patients showed stabilization or improvement in VEM performance,
cor-roborating the findings of some longitudinal studies17,18,19,20,21,22,23,24, yet contrasting with others showing decline4,6,25,26 in this domain. Table 6. Result of analysis of covariance between patient groups baseline vc controls corrected by neuropsychological tests Digits, SNL, SDMT and MWCST.
Variable
Working memory Information
processing speed
Executive
function p group
p Dígitos p SNL p SDMT p MWCST
HVLT - Immediate recall 0.112 0.016* 0.948 0.310 0.001*
HVLT - Delayed recall 0.911 0.060 0.596 0.028* 0.028*
Logic Memory - Immediate recall 0.084 0.094 0.568 0.068 0.068
Logic Memory - Delayed recall 0.715 0.172 0.698 0.017* 0.017*
SNL: Sequence of numbers and letters; SDMT: Symbol Digit Modalities Test; MWCST: Modified Wisconsin Card Sorting Test. *: p > 0.05.
Table 7. Impact of the functioning of the other cognitive areas on the verbal episodic memory of the patients in the baseline
Cognitive
domain Cognitive ability
Neuropsychological
test p/r
Measures of episodic verbal memory HVLT -
Immediate recall
HVLT - Delayed
recall
Logic memory - Immediate
recall
Logic memory - Delayed
recall
Attention
Selective Stroop Test Victoria r 0.027 0.062 -0.119 -0.074
p 0.888 0.749 0.538 0.702
Sustained TMT A r 0.271 -0.024 0.130 0.094
p 0.155 0.900 0.501 0.627
Divided TMT B r 0.303 0.173 0.311 0.344
p 0.110 0.370 0.100 0.067
Processing speed SDMT r 0.285 0.350 0.464* 0.415*
p 0.134 0.063 0.011 0.025
Executive function
Verbal fluency to
letters COWAT - F.A.S
r 0.088 0.072 0.174 0.298
p 0.651 0.712 0.366 0.117
Verbal fluency
semantic COWAT - animals
r 0.165 0.278 0.115 0.080
p 0.393 0.144 0.551 0.680
Strategy training and
mental flexibility MWCST
r 0.560* 0.229 0.391 0.423
p 0.005 0.232 0.036 0.022
Verbal working memory
SNL-WAIS r 0.560* 0.183 0.347 0.218
p 0.002 0.341 0.066 0.255
Dígits-WAIS r 0.401* 0.260 0.063 -0.067
p 0.031 0.174 0.747 0.730
These incongruent findings have been reported in recently-pub -lished systematic reviews on the subject1,2,3.
In the longitudinal studies cited in the preceding para-graph, part of the sample that showed a worsening of VEM over time comprised participants who evolved or were
diag-nosed with more progressive clinical forms of MS. The pres -ent sample was homogenous for the clinical form of the
dis-ease. This might explain the cognitive stability of the patients
studied, given that cognitive impairment tends to be milder in the relapsing-remitting form of MS.
Another aspect that supports the stability and cognitive improvement of the present sample over time is the mech-anism of brain neuroplasticity. A recent systematic review on functional magnetic resonance imaging related to the execution of neuropsychological tasks27 has shown that MS
patients without cognitive dysfunction had different brain dynamics from control participants. The patients had greater
brain activation, widely-distributed cortical recruitment and changes in functional connectivity in cognition-related
regions. These findings suggest that increased recruitment
of important cortical networks can attenuate the negative
effect of MS on cognitive function.
On the other hand, episodic memory deficits, and like -wise for other cognitive dysfunctions, are heterogeneous
in MS where their degree of severity varies significantly
between patients5. Based on this variability, in the present
sample specifically, the patients did not show a relevant
decline in VEM.
One point to consider that may influence the detection
of cognitive impairments is the time interval between
neuro-psychological assessments. The short follow-up of the pres -ent study, coupled with the low rate of VEM impairm-ent in the patients, may explain the longitudinal stability observed.
However, studies in the literature have shown that varia-tion in follow-up time is an incongruent factor in terms of the impact of evolution of cognitive impairment. Some studies have detected cognitive impairments within follow-up periods of two years16,24,26,28,29, reporting impairments in VEM and, particularly, attentional processes. Conversely, a systematic review3 found
that studies with a follow-up of three to five years showed incon -sistent and slow cognitive changes, whereas a longer follow-up
period (10-18 years) was needed to detect deficits.
In summary, the incongruence of the cognitive findings in patients with MS is due to the many different limitations inherent in longitudinal studies. These limitations include different criteria for determining cognitive impairment parameters, possible practice effects on the neuropsycholog -ical tests given the number of assessments administered per
time interval, the choice of tests involving different levels of difficulty, and heterogeneous samples in terms of the clinical
forms of the disease.
As outlined above, the healthy controls were not
reas-sessed to better define the parameters of VEM impairments
in the patients over time. In addition, the high cognitive vari-ability among individuals with MS requires a larger sample size for greater representativeness of the data.
In conclusion, the results of this study revealed that the
patients showed ineffective VEM relative to controls at the
baseline assessment and attained improvement and stability
in this cognitive domain over time. The clinical, sociodemo -graphic and physical disability variables showed no correlation with patient performance on the VEM tests. An impact of the attention and executive functioning tests on VEM in the
infor-mation encoding and retrieval stages was evident. The present
sample was homogenous for the clinical form of the disease, a factor that may have enhanced the reliability of the results.
References
1. Chiaravalloti ND, DeLuca J. Cognitive impairment in multiple sclerosis. Lancet Neurol. 2008 Dec;7(12):1139-51. https://doi.org/10.1016/S1474-4422(08)70259-X
2. Jongen PJ, Ter Horst AT, Brands AM. Cognitive impairment in multiple sclerosis. Minerva Med. 2012 Apr;103(2):73-96.
3. Amato MP, Zipoli V, Portaccio E. Multiple sclerosis-related cognitive changes: a review of cross-sectional and longitudinal studies. J Neurol Sci. 2006 Jun;245(1-2):41-6. https://doi.org/10.1016/j.jns.2005.08.019
4. Moccia M, Lanzillo R, Palladino R, Chang KC, Costabile T, Russo C et al. Cognitive impairment at diagnosis predicts 10-year multiple sclerosis progression. Mult Scler. 2016 Apr;22(5):659-67. https://doi.org/10.1177/1352458515599075
5. Brissart H, Morele E, Baumann C, Debouverie M. Verbal episodic memory in 426 multiple sclerosis patients: impairment in encoding, retrieval or both? Neurol Sci. 2012 Oct;33(5):1117-23. https://doi.org/10.1007/s10072-011-0915-7
6. Strober LB, Rao SM, Lee JC, Fischer E, Rudick R. Cognitive impairment in multiple sclerosis: An 18 year follow-up study. Mult Scler Relat Disord. 2014 Jul;3(4):473-81. https://doi.org/10.1016/j.msard.2014.03.004
7. Polman CH, Reingold SC, Banwell B, Clanet M, Cohen JA, Filippi M et al. Diagnostic criteria for multiple sclerosis: 2010 revisions to the McDonald criteria. Ann Neurol. 2011 Feb;69(2):292-302. https://doi.org/10.1002/ana.22366
8. Ringe WK, Saine KC, Lacritz LH, Hynan LS, Cullum CM. Dyadic short forms of the Wechsler Adult Intelligence Scale-III. Assessment. 2002 Sep;9(3):254-60. https://doi.org/10.1177/1073191102009003004
9. Brucki SM, Nitrini R, Caramelli P, Bertolucci PH, Okamoto IH. [Suggestions for utilization of the mini-mental state examination in Brazil]. Arq Neuropsiquiatr. 2003 Sep;61(3B):777-81. Portuguese. https://doi.org/10.1590/S0004-282X2003000500014
10. Zigmond AS, Snaith RP. The hospital anxiety and depression scale. Acta Psychiatr Scand. 1983 Jun;67(6):361-70. https://doi.org/10.1111/j.1600-0447.1983.tb09716.x
11. Brandt JB, Benedict RH. Hopkins verbal learning test-revised: professional manual. Lutz: Psychological Assessment Resource; 2001.
13. Gorenstein C, Wang YP, Argimon IL, Werlang BS. Manual do inventário de depressão de Beck - BDI-II. São Paulo: Casa do Psicólogo; 2011. 14. Kurtzke JF. Rating neurologic impairment in multiple sclerosis:
an expanded disability status scale (EDSS). Neurology.
1983 Nov;33(11):1444-52. https://doi.org/10.1212/WNL.33.11.1444 15. Fuso SF, Callegaro D, Pompéia S, Bueno OF. Working memory
impairment in multiple sclerosis relapsing-remitting patients with episodic memory deficits. Arq Neuropsiquiatr. 2010 Apr;68(2):205-11. https://doi.org/10.1590/S0004-282X2010000200010
16. Faglioni P, Bertolani L, Botti C, Merelli E. Verbal learning strategies in patients with multiple sclerosis. Cortex. 2000 Apr;36(2):243-63. https://doi.org/10.1016/S0010-9452(08)70527-6
17. Bergendal G, Fredrikson S, Almkvist O. Selective decline in information processing in subgroups of multiple sclerosis: an 8-year longitudinal study. Eur Neurol. 2007;57(4):193-202. https://doi.org/10.1159/000099158 18. Jønsson A, Andresen J, Storr L, Tscherning T, Soelberg Sørensen P, Ravnborg M. Cognitive impairment in newly diagnosed multiple sclerosis patients: a 4-year follow-up study. J Neurol Sci.
2006 Jun;245(1-2):77-85. https://doi.org/10.1016/j.jns.2005.09.016 19. Schwid SR, Goodman AD, Weinstein A, McDermott MP, Johnson KP;
Copaxone Study Group. Cognitive function in relapsing multiple sclerosis: minimal changes in a 10-year clinical trial. J Neurol Sci. 2007 Apr;255(1-2):57-63. https://doi.org/10.1016/j.jns.2007.01.070 20. Glanz BI, Healy BC, Hviid LE, Chitnis T, Weiner HL. Cognitive
deterioration in patients with early multiple sclerosis: a 5-year study. J Neurol Neurosurg Psychiatry. 2012 Jan;83(1):38-43. https://doi.org/10.1136/jnnp.2010.237834
21. Nygaard GO, Celius EG, Benavent SAR, Sowa P, Gustavsen MW, Fjell AM et al. A longitudinal study of disability, cognition and gray matter atrophy in early multiple sclerosis patients according to evidence of disease activity. PLoS One. 2015 Aug;10(8):e0135974. https://doi.org/10.1371/journal.pone.0135974
22. Nourbakhsh B, Nunan-Saah J, Maghzi AH, Julian LJ, Spain R, Jin C et al. Longitudinal associations between MRI and cognitive
changes in very early MS. Mult Scler Relat Disord. 2016 Jan;5:47-52. https://doi.org/10.1016/j.msard.2015.10.010
23. Hankomäki E, Multanen J, Kinnunen E, Hämäläinen P. The progress of cognitive decline in newly diagnosed MS patients. Acta Neurol Scand. 2014 Mar;129(3):184-91. https://doi.org/10.1111/ane.12161 24. Zivadinov R, Sepcic J, Nasuelli D, De Masi R, Bragadin LM, Tommasi
MA et al. A longitudinal study of brain atrophy and cognitive disturbances in the early phase of relapsing-remitting multiple sclerosis. J Neurol Neurosurg Psychiatry. 2001 Jun;70(6):773-80. https://doi.org/10.1136/jnnp.70.6.773
25. Piras MR, Magnano I, Canu ED, Paulus KS, Satta WM, Soddu A et al. Longitudinal study of cognitive dysfunction in multiple sclerosis: neuropsychological, neuroradiological, and neurophysiological findings. J Neurol Neurosurg Psychiatry. 2003 Jul;74(7):878-85. https://doi.org/10.1136/jnnp.74.7.878
26. Pereira AG. Evolução das funções cognitivas psíquicas e motoras dos pacientes portadores de esclerose múltipla [tese].
Porto Alegre: Pontifícia Universidade Católica do Rio Grande do Sul; 2013.
27. Rocca MA, Amato MP, De Stefano N, Enzinger C, Geurts JJ, Penner IK et al.; MAGNIMS Study Group. Clinical and imaging assessment of cognitive dysfunction in multiple sclerosis. Lancet Neurol. 2015 Mar;14(3):302-17. https://doi.org/10.1016/S1474-4422(14)70250-9
28. López-Góngora M, Querol L, Escartín A. A one-year follow-up study of the Symbol Digit Modalities Test (SDMT) and the Paced Auditory Serial Addition Test (PASAT) in relapsing-remitting multiple sclerosis: an appraisal of comparative longitudinal sensitivity. BMC Neurol. 2015 Mar;15:40. https://doi.org/10.1186/s12883-015-0296-2 29. Amato MP, Portaccio E, Goretti B, Zipoli V, Iudice A, Della