INTRODUCTION
Hepatitis C virus (HCV) infection is a serious public health problem, that affects approximately 170 million people worldwide(1). It continues to be the leading cause of death from liver disease and, despite recent medical advances in HCV therapy, it is the principal indication for liver transplantation in the United States(2,3). Eighty-five percent of the infected people fail to achieve clearance of the virus and become chronically infected(4). Approximately 20% may develop hepatic cirrhosis within 20 years, characterized by progressive replacement of the functional hepatic architecture by non-functional fibrotic tissue. Each year, 6% of cirrhotic patients are expected develop terminal hepatic disease, and 4% to develop hepatocellular carcinoma (HCC)(5,6).
Chronic HCV infection is associated with hepatic insulin resistance (IR) and an increased risk of diabetes in HCV-infected patients has been well described(7). This large prevalence of type
Insulin resistance reduction after sustained
virological response with direct acting antiviral:
not every population improves
Vanessa Gutierrez de
ANDRADE
, Fábio da Silva
YAMASHIRO
, Cássio Vieira
OLIVEIRA
, Alecsandro
MOREIRA
,
Fernanda Cristina
WINCKLER
and Giovanni Faria
SILVA
Received 28/3/2018 Accepted 15/8/2018
ABSTRACT – Background – Hepatitis C virus (HCV) infection is a serious public health problem, that affects approximately 170 million people worldwide. Chronic HCV infection is associated with hepatic insulin resistance and an increased risk of diabetes HCV-infected patients has been well documented.
Objective – To assess the homeostasis model assessment of insulin resistance (HOMA-IR) index in patients treated with direct acting antiviral (DAAs) medication in the sustained virological response (SVR), categorized by the presence or absence of cirrhosis. Methods – A prospective study was conducted. Data were collected at the beginning of treatment (t-base) and in the twelfth week after the completion of treatment (t-SVR12). The inclusion criteria were presence of: HCV infection (RNA-HCV positive), age ≥18 years, completion of DAAs’ therapy, and presence of diabetes with use of oral hypoglycemic agents. All samples were collected during the study period. The exclusion criteria were: presence of HBV/HIV co-infection, hepatocellular carcinoma at baseline, diabetic patients taking insulin and transplanted patients (liver/kidney). Fibrosis was assessed by hepatic elastog-raphy or biopsy (METAVIR). Cirrhosis was determined by clinical results or imaging. HOMA-IR was calculated as fasting insulin (μU/mL) × fasting glucose (mmol/L)/22.5) The patients were divided into two groups: the general study population (all patients, including the diabetic patients) and the special population (patients with normal values of HOMA-IR, which is >2.5, and without diabetes). The delta HOMA-IR value was calculated as: HOMA-IR at t-base – HOMA-IR at t-SVR12. For the descriptive statistical analysis, the paired t-test and generalized linear model assuming the log binding function were performed. A P value of < 0.05 was considered significant. Results – We included 150 patients, and 75 were cirrhotic. The mean age was 55.3±9.97 and body mass index was 27.4±5.18. Twenty-two (14.67%) were diabetic patients using oral hypoglycemic agents, and 17 (11%) were cirrhotic. In the general study population, the mean glucose and HOMA-IR values increased at t-SVR12, but insulin decreased. Delta HOMA-IR was negative at t-SVR12, but there was no significant difference. Excluding diabetic patients and those with normal HOMA-IR values (<2.5), mean glucose, insulin and HOMA-IR decreased at t-SVR12. Delta HOMA-IR decreased significantly at t-SVR12 (P: 0.02). Conclusion – In the general population, glucose and HOMA-IR values increased at t-SVR12, but insulin decreased. In the special population, glucose, insulin, HOMA-IR and Delta HOMA-IR decreased at t-SVR12.
HEADINGS – Hepatitis C. Insulin resistance. Antiviral agents.
Declared conflict of interest of all authors: none.
Disclosure of funding: Vanessa Gutierrez de Andrade CNPq scholarship.
Universidade Estadual Paulista (UNESP), Faculdade de Medicina, Departamento de Clínica Médica, Botucatu, SP, Brasil. Corresponding author: Giovanni Faria Silva. Orcid: 0000-0001-6129-7045 E-mail: giovanni@fmb.unesp.br.
2 diabetes (T2DM) in HCV remains even when cirrhotic patients are excluded from the analysis(8-10), indicating that cirrhosis could be diabetogenic by itself(11). Although insulin resistance (IR) has also been detected also in subjects with minimal or no fibrosis, an increase of homeostatic model assessment of insulin resist-ance (HOMA-IR) has been associated with the presence of more advanced fibrosis(12). Other studies confirmed these findings and showed a correlation between the degree of fibrosis and IR(13,14). T2DM and IR were observed to be independent predictors of liver-related mortality(15,16), moreover IR was associated with fibrosis progression and the stage of fibrosis(12).
Arq Gastroenterol • 2018. v. 55 nº 3 jul/set • 275
IFN based therapy improved the IR in SVR(20), however, it is unclear if this effect occurs during direct acting antiviral therapy. Thus, our aim was to assess HOMA -IR behavior in patients treated with DAAs that reached the SVR, categorized by the presence or absence of cirrhosis.
METHODS
In this prospective study, we assessed patients treated with inter-feron free therapy from 2015 to 2017. The study was conducted at the Viral Hepatitis Outpatient Clinic of Botucatu Medical School and was approved by the Committee on Ethics in Research of the Botucatu Medical School. The data were collected at the begin-ning of treatment (baseline: t-base) and in the twelfth week after treatment was completed (t-SVR12).
The inclusion criteria were: presence of chronic hepatitis C infection (presence of RNA-HCV); age ≥18 years; completion of DAAs’ therapy; presence of diabetes with intake of oral hypogly-cemic agents, and samples collected during the study period. The exclusion criteria were as follows: HBV and/or HIV co-infection; hepatocellular carcinoma at baseline; diabetic patients taking insulin and transplanted patients (liver and kidney).
Fibrosis was assessed by hepatic elastography or biopsy (METAVIR classification)(21). Cirrhosis was determined clinically or by imaging examination. HOMA-IR was calculated as fasting insulin (μU/mL) × fasting glucose (mmol/L)/22.5)(22). To determine the delta HOMA-IR value, the difference was calculated as the HOMA-IR at t-base – HOMA-IR at t-SVR12.
Descriptive statistical analyses were performed to establish a comparison of the delta HOMA-IR between the groups: the general study population (all patients, including diabetics patients) and the special population (We excluded patients with normal values of IR, which is <2.5, and with diabetes). For delta HOMA-IR, delta insulin and delta glucose, the paired t test was performed. A generalized linear model assuming log-binding function was performed for delta HOMA-IR evaluated by fibrosis. A P-value of <0.05 was considered significant.
RESULTS
Of the 274 consecutive patients, 150 were included, and 75 were cirrhotic. Six patients died during the treatment period,15 were excluded for taking insulin, 10 did not achieve SVR, 3 had a hepatic nodule at baseline, 7 underwent kidney or liver trans-plantation and 83 did not have data for HOMA-IR in all the periods indicated.
The mean age was 55.3±9.97 and body mass index (BMI) was 27.4±5.18. Twenty-two (14.67%) were diabetic patients who required oral hypoglycemic agents, and 17 (11%) were cirrhotic (P=0.01).
In TABLE 1 the baseline results of the general study population are provided. Mean glucose and HOMA-IR increased at t-SVR12 (102.36±24.52 and 3.72±3.26 respectively), but insulin decreased (14.03±10.32).
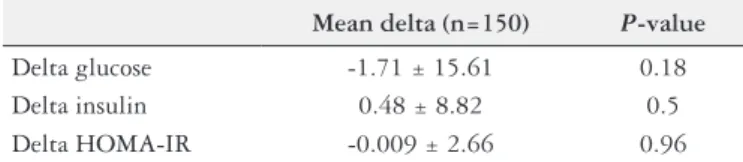
In TABLE 2 the changes in of delta glucose, delta insulin and delta HOMA-IR values are provided.
Altough the delta HOMA-IR was negative at t-SVR12, there was no statistical difference. When we evaluated the delta HOMA-IR based on the presence of advanced fibrosis or not, no statistical difference was found either. (P=0.58).
Analyses of special population – when we excluded patients with normal values of HOMA-IR, which is <2.5 and with diabetes.
Excluding diabetic patients and those who had normal HOMA-IR values (HOMA-HOMA-IR <2.5) there were 75 patients in total, 21 (28%) were F≤2, 12 (16%) were F3 and 42 (56%) were F4 (TABLE3).
In this population, the mean glucose, insulin and HOMA-IR values decreased at t-SVR12 (98.25±14.58, 16.56±7.64, 4.09±2.13), respectively.
TABLE 1. Baseline results in the general population.
t-base (n=150)
Age 55.3 ± 9.97
BMI 27.4 ± 5.18
F≤2 / F3 / F4(%) 54(36%) / 21(14%) / 75(50%) Diabetics taking oral
hypoglycemic agents 14.67% / F≤3 (3%) / F4 (11%)
Glucose 100.65 ± 19.7
Insulin 14.46 ± 10.26
HOMA-IR 3.69 ± 2.99
t-base: baseline; BMI: body mass index; HOMA-IR: homeostasis model assessment of insulin resistance.
TABLE 2. Values of delta glucose, delta insulin and delta HOMA-IR in the general population.
Mean delta (n=150) P-value
Delta glucose -1.71 ± 15.61 0.18 Delta insulin 0.48 ± 8.82 0.5 Delta HOMA-IR -0.009 ± 2.66 0.96
Delta: t-base–t-SVR; HOMA-IR: homeostasis model assessment of insulin resistance; t-base: baseline; t-SVR12: sustained virological response.
TABLE 4. Values of delta glucose, delta insulin and delta HOMA-IR in patients with values of HOMA-IR >2.5 and non-diabetics.
Mean delta (n=75) P-value
Delta glucose 2.6 ± 12.49 0.07 Delta insulin 2.9 ± 9.88 0.01
Delta HOMA-IR 0.76 ± 2.81 0.02
Delta: t-base–t-SVR; HOMA-IR: homeostasis model assessment of insulin resistance; t-base: baseline; t-SVR: sustained virological response.
TABLE 3. Baseline results in the population without diabetic patients and normal values of HOMA-IR TW0.
t-base (n=75)
Age 55.98 ± 9.47
BMI 28.66 ± 5.18
F≤2 / F3 / F4(%) 21(28%) / 12(16%) / 42(56%) Glucose 100.85 ± 15.09
Insulin 19.46 ± 8.92
HOMA-IR 4.86 ± 2.44
t-base: baseline; BMI: body mass index; HOMA-IR: homeostasis model assessment of insulin resistance.
DISCUSSION
Numerous studies suggest that HCV can harm insulin signaling and increase the onset of T2DM(23,24). In HCV-infected patients the reported prevalence of IR has increased from 30% to 70%, irrespec-tive of the severity of hepatic disease, and is genotype-specific(2,13). In our study, the incidence of T2DM was 14.6%, and 11% of patients were cirrhotic and 3.33% were non cirrhotic (P<0.01).
Diabetes mellitus caused by cirrhosis is called hepatogenous diabetes. This type of diabetes is most likely caused by IR with a lower hepatic extraction of insulin or by some dysfunction of pancreatic beta cells; however, this mechanism is not completely understood(25). Classification of patients according to hepatogenous
diabetes or hereditary T2DM to better determine the effect of HCV eradication in these conditions, would be beneficial(26). However, this is not always possible because there is no standard definition of hepatogenous diabetes, even in international guidelines.
The impact of IR on the treatment efficacy of DAAs has greatly reduced because of the recent development of high potency antivi-rals(16).However, post-treatment outcomes with respect to glucose
abnormalities have rarely been investigated. Thus, the correlation and/or changes of IR with treatment efficacy of DAAs in a real-world scenario needs more assessment.
Our data showed that the delta HOMA-IR increased at SVR12, but the result was not statistically significant, when the general study population, including diabetic patients, were studied. Ad-ditionally, there was no association between HOMA-IR and low and high levels of fibrosis. In this population, there was a slight increase of glucose and HOMA-IR, while the insulin levels de-creased. A study by Jeef-Fu Huang et al.(19), that included 65 native Tawainese patients with chronic hepatitis C treated with DAAs assessing IR, it was observed that, the levels of HOMA-IR decreased at SVR12, compared to baseline, even though there was no statistical difference. In addition, the mean glucose levels decreased in diabetic patients at SVR12. The study did not show the level of fibrosis in the patients. Another study that consisted of 110 patients with chronic hepatitis C, advanced fibrosis and T2DM that analyzed the impact of SVR on fasting glucose and glycated hemoglobin, also showed a significant reduction in fasting glucose, as SVR12 was the only factor associated with this improvement(27).
However, they did not evaluate HOMA-IR.
There is no consensus regarding the cut-off value for diagnosing IR(28,29). Some studies use a HOMA-IR value between 1.5 and 3.0 to
determine insulin resistance(17,30-32). In our study, we used HOMA-IR >2.5 for the diagnosis of insulin resistance. In Brazil, there was a populational study of non-diabetic patients without HCV infection from the Brazilian Study of Metabolic Syndrome(32).In this study the optimal diagnostic level of HOMA-IR was between 2.3 and 2.7, which is close to the level used in our study.
In our study, on excluding diabetic patients and those with a HOMA-IR <2.5 (special population), a decrease in glucose, insulin and HOMA-IR values at t-SVR12 was observed. A study of 133 HCV genotype 1 patients with advanced liver fibrosis without T2DM(33) that evaluated the impact of HCV clearance by anti-viral treatments on IR and glycemic control, showed similar results to ours. Glucose, insulin and HOMA-IR values decreased at the end of treatment, resulting in values that remained con-stant after SVR12. The HOMA-IR values were associated with advanced liver fibrosis, however in our study, we did not find a significant association between the delta HOMA-IR and fibrosis stage. This might be attributable to the small study population of 75 patients after excluding diabetic patients and those with HOMA-IR <2.5.
CONCLUSION
Glucose and HOMA-IR increased at t-SVR12, but insulin de-creased in the general population. The delta HOMA-IR inde-creased, but there was no association with the stage of fibrosis. Excluding diabetic patients and those who had normal values of HOMA-IR, glucose, insulin, HOMA-IR and delta HOMA-IR decreased at t-SVR12. In addition, no association with fibrosis was found.
ACKNOWLEDGEMENT
Study Group of HCV: Liciana Vaz Silveira, Vanessa Nogueira da Silva Paixão, Mari Nilce Peres, Walnei Fernandes Barbosa, Letícia Lastória Kurozawa, Flávia Chiacchio, Rejane Maria Tom-masini Grotto, Maria Inês de Moura Campos Pardini. All of them performed the reasearch.
Authors’ contribution
Arq Gastroenterol • 2018. v. 55 nº 3 jul/set • 277 REFERENCES
1. Lavanchy D. Evolving epidemiology of hepatitis C virus. Clin Microbiol Infect. 2011;17:107-15.
2. Moucari R, Asselah T, Cazals-Hatem D, Voitot H, Boyer N, Ripault MP, et al. Insulin resistance in chronic hepatitis C: association with genotypes 1 and 4, serum HCV RNA level, and liver fibrosis. Gastroenterology. 2008;134:416-23. 3. Negro F. Abnormalities of lipid metabolism in hepatitis C virus infection. Gut.
2010;59:1279-87.
4. Wasley A, Alter MJ. Epidemiology of hepatitis C: geographic differences and temporal trends. Semin Liver Dis. 2000;20:1-16.
5. Kiyosawa K, Sodeyama T, Tanaka E, Gibo Y, Yoshizawa K, Nakano Y, et al. Interrelationship of blood transfusion, non A, non B hepatitis and hepatocellular carcinoma: analysis by detection of antibody to hepatitis C virus. Hepatology. 1990;12:671-5.
6. Alter HJ, Seeff LB. Recovery, persistence, and sequelae in hepatitis C virus infection: A perspective on longterm outcome. Semin Liver Dis. 2000;20:17-35. 7. G Gastaldi G, Goossens Nb, Clement S, Negro F. Current level of evidence on causal association between hepatitis C virus and type 2 diabetes: a review. J Adv Res. 2017;8:149-59.
8. Allison ME, Wreghitt T, Palmer CR, Alexander GJ. Evidence for a link between hepatitis C vírus infection and diabetes mellitus in a cirrhotic population. J Hepatol. 1994;21:1135-9.
9. Grimbert S, Valensi P, Levy-Marchal C, Perret G, Richardet JP, Raffloux C, et al. Prevalence of diabetes mellitus in patients with chronic hepatitis C: a case-control study. Gastroenterol Clin Biol. 1996;20:544-8.
10. Knobler H, Schihmanter R, Zifroni A, Fenakel G, Strathdee AS. A increased risk of type 2 diabetes in noncirrhotic patients with chronic hepatitis C virus infection. Mayo Clin Proc. 2000;75:355-9.
11. Parise ER, Oliveira AC. Insulin resistance in chronic hepatitis C. Arq Gastroen-terol. 2007;44:178-84.
12. Hui JM, Sud A, Farrell GC, Bandara P, Byth K, Kench JG, et al. Insulin resistance is associated with chronic hepatitis C virus infection and fibrosis progression [corrected]. Gastroenterology. 2003;125:1695-704.
13. Petit JM, Bour JB, Galland-Jos C, Minello A, Verges B, Guiguet M, et al. Risk factors for diabetes mellitus and early insulin resistance in chronic hepatitis C. J Hepatol. 2001;35:279-83.
14. Hickman IJ, Powell EE, Prins JB, Clouston AD, Ash S, Purdie DM, et al. In overweight patients with chronic hepatitis C, circulating insulin is associated with hepatic fibrosis: implications for therapy. J Hepatol. 2003;39:1042-8.
15. Stepanova M, Rafiq N, Younossi ZM. Components of metabolic syndrome are independent predictors of mortality in patients with chronic liver disease: a population-based study. Gut. 2010;59:1410-5.
16. Younossi Z, Negro F, Serfaty L, Pol S, Diago M, Zeuzem S, et al. Homeostasis model assessment of insulin resistance does not seem to predict response to telaprevir in chronic hepatitis C in the REALIZE trial. Hepatology. 2013;58:1 897-906.
17. Romero-Gomez M, Viloria MDM, Andrade RJ, Salmerón J, DIago M, Fernán-dez-Rodríguez CM, et al. Insulin Resistance impairs sustained response rate to peginterferon plus ribavirin in chronic hepatitis C patients. Gastroenterology. 2005;128:636-41.
18. Willemse SB, Baak LC, Kuiken SD, van der Sluys Veer A, Lettinga KD, van der Meer JT, et al. Sofosbuvir plus simeprevir for the treatment of HCV genotype 4 patients with advanced fibrosis or compensated cirrhosis is highly efficacious in real life. J Viral Hepat. 2016;23:950-954.
19. Huang JF, Huang CF, Yeh ML, Dai CY, Hsieh MH, Yang JF, et al. The outcomes of glucose abnormalities in chronic hepatitis C patients receiving interferon-free direct antiviral agents. Kaohsiung J Med Sci. 2017;33:567e571.
20. Romero-Gomez M. Insulin resistance and hepatitis C. World J Gastroenterol. 2006;12:7075-80.
21. Bedossa P, Poynard T. An algorithm for the grading of activity in chronic hepatitis C. Hepatology. 1996;24:289-93.
22. Bonora E, Targher G, Alberiche M, Bonadonna RC, Saggiani F, Zenere MB, et al. Homeostasis model assessment closely mirrors the glucose clamp technique in the assessment of insulin sensitivity: studies in subjects with various degrees of glucose tolerance and insulin sensitivity. Diabetes Care. 2000;23:57-63. 23. White DL, Ratziu V, El-Serag HB. Hepatitis C infection and risk of diabetes: a
systematic review and meta-analysis. J Hepatol. 2008;49:831-44.
24. Negro F. Facts and fictions of HCV and comorbidities: steatosis, diabetes mellitus, and cardiovascular diseases. J Hepatol. 2014;61:S69-S78.
Andrade VG, Yamashiro FS, Oliveira CV, Moreira A, Winckler FC, Silva GF. Redução da resistência à insulina após resposta virológica sustentada com agentes antivirais diretos: nem toda população melhora. Arq Gastroenterol. 2018,55(3):274-8.
RESUMO – Contexto – A infecção pelo vírus da hepatite C (VHC) é um grave problema de saúde pública, que afeta aproximadamente 170 milhões de pessoas no mundo. A infecção crônica pelo VHC está associada à resistência à insulina hepática e a um risco aumentado de diabetes. Os doentes infe-tados pelo VHC foram bem documeninfe-tados. Objetivo – Avaliar o modelo de avaliação da homeostase do índice de resistência à insulina (HOMA-IR) em pacientes tratados com medicação antiviral de ação direta na resposta virológica sustentada (RVS), categorizada pela presença ou ausência de cirrose. Métodos – Foi realizado um estudo prospectivo. Os dados foram coletados no início do tratamento (t-base) e na décima segunda semana após o término do tratamento (t-RVS12). Os critérios de inclusão foram presença de: infecção pelo VHC (RNA-VHC positivo), idade ≥18 anos, conclusão da terapia de antivirais de ação direta e presença de diabetes com uso de hipoglicemiantes orais. Todas as amostras foram coletadas durante o período do estudo. Os critérios de exclusão foram: presença de coinfecção VHB/HIV, carcinoma hepatocelular no início do estudo, pacientes diabéticos em uso de insulina e pacientes transplantados (fígado/rim). A fibrose foi avaliada por elastografia hepática ou biópsia (METAVIR). A cirrose foi determinada por resultados clínicos ou exames de imagem. O HOMA-IR foi calculado como insulinemia de jejum (μU/mL) x glicemia de jejum (mmol/L) /22,5). Os pacientes foram divididos em dois grupos: a população geral do estudo (todos os pacientes, incluindo os diabéticos) e a população especial (pacientes com valores normais de HOMA-IR, que é <2,5 e sem diabetes). O valor do delta HOMA-IR foi calculado como: HOMA-IR no t-base – HOMA-IR no t-RVS12. Para a análise estatística descritiva, foram utilizados o teste t pareado e o modelo linear generalizado, assumindo a função de ligação logarítmica. Um valor de P<0,05 foi considerado significativo. Resultados – Foram incluídos 150 pacientes e 75 eram cirróticos. A idade média foi de 55,3±9,97 e o índice de massa corpórea foi de 27,4±5,18. Vinte e dois (14,67%) eram pacientes diabéticos em uso de hipoglicemiantes orais e 17 (11%) eram cirróticos. Na população geral do estudo, os valores médios de glicose e HOMA-IR aumentaram na t-SVR12, mas a insulina diminuiu. O delta HOMA-IR foi negativo em t-SVR12, mas não houve diferença significativa. Excluindo pacientes diabéticos e aqueles com valores normais de HOMA-IR (<2,5), a média de glicose, insulina e HOMA-IR diminuiu no t-RVS12. O delta HOMA-IR diminuiu significativamente em t-RVS12 (P: 0,02). Conclusão – Na população geral, os valores de glicose e HOMA-IR aumentaram no t-RVS12, mas a insulina diminuiu. Na população especial, glicose, insulina, HOMA-IR e delta HOMA-IR diminuíram no t-RVS12.
25. Garcia-Compean D, Jaquez-Quintana JO, Gonzalez-Gonzalez JA, Maldona-do-Garza H. Liver cirrhosis and diabetes: risk factors, pathophysiology, clinical implications and management: World J Gastroenterol. 2009;15:280-8. 26. Dawood AA, Nooh MZ, AElgamal AA. Factors Associated with Improved
Glycemic Control by Direct-Acting Antiviral Agent Treatment in Egyptian Type 2 Diabetes Mellitus Patients with Chronic Hepatitis C Genotype 4. Diabetes Metab J. 2017;41:316-21.
27. A Ciancio, R Bosio, S Bo, M Pellegrini, M Sacco, E Vogliotti, et al. Significant improvement of glycemic control in diabetic patients with HCV infection re-sponding to direct-acting antiviral agents. J Med Virol. 2018;90:320-7. 28. Veldt BJ, Poterucha JJ, Watt KD, Wiesner RH, Hay JE, Rosen CB, et al. Insulin
resistance, serum adipokines and risk of fibrosis progression in patients trans-planted for hepatitis C. Am J Transplant. 2009;9:1406-13.
29. Eslam M, Kawaguchi T, Del Campo JA, Sata M, Khattab MAE, Romero-Gomez M. Use of HOMA-IR in hepatitis C. J Viral Hepat. 2011;18:675-84.
30. Grasso A, Malfatti F, Leo P, Martines H, Fabris P, Toscanini F, et al. Insulin resistance predicts rapid virological response in non-diabetic, non-cirrhotic genotype 1 HCV patients treated with peginterferon alpha-2b plus ribavirin. J Hepatol. 2009;51:984-90.
31. Pais R, Rusuc E, Zilisteanu D, Circiumaru A, Micu L, Voiculescu M, et al. Prevalence of steatosis and insulin resistance in patients with chronic hepatitis B compared with chronic hepatitis C and non-alcoholic fatty liver disease. Eur J Intern Med. 2015;26:30-6.
32. Geloneze B, Vasques ACJ, Stabe CFC, Pareja JC, Rosado LEFPL, Queiroz EC, et al. HOMA1-IR and HOMA2-IR indexes in identifying insulin resistance and metabolic syndrome – Brazilian Metabolic Syndrome Study (BRAMS). Arq Bras Endocrinol Metab. 2009;53:281-7.