AR
TICLE
Healthy Eating Index: adaptation for children aged 1 to 2 years
Abstract The goal was to adapt the Healthy Eat-ing Index (HEI) to the US Dietary Guidelines for Brazilian children. Cross-sectional study conduct-ed in a population-basconduct-ed sample of 1185 children 13-35 months old of São Luís municipality (MA). A 24-hour dietary recall Survey measured the food consumption and set the intrapersonal vari-ance diet. We evaluated the construct validity by Principal Component Analysis and the Pearson correlation coefficient to see whether the index measures the quality of independent dietary ener-gy consumed. We evaluated the reliability for the analysis of internal consistency, by calculating the alpha coefficient Conbrach and the correlations between each component and the total score. The correlations between the scores of components and energy were low (r ≤ 0.29). Four factors with eigenvalues > 1 were retained with cumulative variance of 58%. Cronbach’s alpha was 0.48. The variety of the diet (r = 0.77) and vegetables and legumes (r = 0.60) had higher positive correla-tions with the total score (p < 0.05). The average of the HEI was 74.8 (± 13.2) points to 58.7% of children with diets that needed improvement. The adapted HEI proved to be valid to assess the over-all quality of the diet of children.
Key words Food consumption, Diet, Eating
hab-its, Indexes
Sueli Ismael Oliveira da Conceição ¹ Bianca Rodrigues de Oliveira ² Marta Rizzin ²
Antônio Augusto Moura da Silva ²
1 Departamento de Ciências Fisiológicas. Curso de Nutrição, Universidade Federal do Maranhão (UFMA). Av. dos Portugueses, Bacanga. 65085-580 São Luís MA Brasil.
C
onc
eição SIO
Introduction
Poor nutrition in the early years of life is correlat-ed with the early onset of overweight, obesity1,
other non-communicable chronic diseases (NC-CDs)², and specific micronutrient deficiencies in children¹.
The association between the intake of some nutrients, food products, or food groups and several NCCDs can be determined using dietary instruments that comprehensively assess diet, and the scientific literature has proposed several indexes for this purpose3.
Among the 25 indices that assess dietary quality, the Healthy Eating Index (HEI)4
devel-oped by Kennedy et al. is among the most com-monly used in international studies4. The HEI
considers the food pyramid recommendations and American dietary guidelines5.
The HEI contains ten components that char-acterize different aspects of a healthy diet: five food groups that should be consumed propor-tionately (cereals, breads and tubers; vegetables; fruits; milk and dairy products; and meat, eggs, and leguminous plants), four nutrients that should be consumed in moderation (total fat, saturated fats, cholesterol, and sodium), and di-etary variety. The score of each component varies from zero to ten, and a maximum score of 100 indicates a good-quality diet6.
The HEI is a brief instrument that allows the classification of individuals into consump-tion categories. Its other advantages are that 1) it reflects the nutritional requirements by estab-lishing correlations among various dietary com-ponents, 2) it can monitor consumption trends, and 3) it is useful for evaluating nutritional in-terventions3.
A review study of food standards in children aged 1 to 5 years living in North America, Eu-rope, South Africa, and Latin America indicated that among the dietary indices used in 23 studies, the HEI was most commonly used (34.8%) to evaluate the global diet7.
In Brazil, as of 2014, 32 studies applied the HEI to different age groups. In five of these stud-ies, the HEI was applied to children aged 2 to 6 years8, and two studies adapted this index for use
in Brazil. One study adapted the HEI to a sam-ple of 94 children living in impoverished areas in Campinas, São Paulo state (SP), Brazil9. Another
study used a hospital-based sample and included only children of low socioeconomic status living in São Leopoldo, Rio Grande do Sul state (RS), Brazil, but the food servings did not comply with
the Brazilian recommendations10. Therefore, we
did not find population-based studies conducted in Brazil that adapted the North American HEI to Brazilian dietary recommendations for chil-dren younger than 2 years of age.
Considering the need to evaluate the overall quality of children’s diets to identify health risks and the fact that dietary recommendations for the population living in the United States differ from those of the Brazil population, the present study aimed to adapt the North American HEI to the Brazilian dietary recommendations for chil-dren aged 1 to 2 years living in the municipality of São Luís, Maranhão State (MA), and deter-mine the validity and reliability of this index.
Methods
This cross-sectional study was part of a pro-spective cohort study entitled “The etiology of preterm birth and the effect of perinatal factors on infant health: Birth cohorts in two Brazilian cities, São Luís (MA) and Ribeirão Preto (SP) - BRISA” (“Fatores etiológicos do nascimento pré-termo e consequências dos fatores perina-tais na saúde da criança: Coortes de nascimen-tos em duas cidades brasileiras, São Luís (MA) e Ribeirão Preto (SP) – BRISA”), developed at the Federal University of Maranhão (Universidade Federal do Maranhão - UFMA) and the School of Medicine of Ribeirão Preto of the University of São Paulo (Universidade de São Paulo). The BRISA cohort study was conducted from January 2010 to March 2013.
The study population consisted of 21,401 live births (from the BRISA birth cohort) in the mu-nicipality of São Luís (MA). The sampling pro-cess of this study has been described previous-ly11. The cost-benefit was optimized by applying
e C
ole
tiv
a,
23(12):4095-4106,
2018
be pre-term, twins, and/or would present low birth weight, 900 controls (corresponding to 1.5 controls per case) would need to be interviewed to reach a sample size of 1,500 children.
Because the DR was administered to all in-fants who were preterm and/or low birthweight and/or twins (853) plus 1.5 times the number of controls (1,282), the resulting subsample includ-ed 2,135 children. Sample loss was 41.8% because of non-return for the interviews; therefore, the food intake of 1,242 children was assessed. After the exclusion of 4.6% of children whose food in-takes the day before the interview were atypical and those with incomplete food surveys, the final study sample included 1,185 children aged 13 to 35 months (Figure 1).
All the children from the birth cohort sub-sample selected to complete the nutritional sur-vey were included in this study. Children whose food intake on the day before the interview was atypical (i.e., those who had consumed unusual food products at houses other than their own, at parties, or at other places), those with illnesses or other complications, and those with incom-plete nutritional surveys were not included in the study.
Considering that the probability of selecting children who were born preterm, were twins, and/or had low birthweights was distinct from the probability of selecting children who were born at term, were not twins, and had normal birthweights, the sample was weighted according
Figure12. Flowchart of the sample selection process from the adapted HEI. São Luís (MA), 2010–2013.
21,401 births in 2010
7,133 births (1 of every 3
drawn)
5,475 eligible children from families living in São Luís (MA), Brazil.
5,236 live births and stillbirths
5,166 live births
2,135 children
Subsample for food consumption assessment (853 preterm and/or low birthweight and/or twin births plus 1.5 times (1282) that number of children born at term, with normal birthweight, and non-twin
births
1,242 children with one RI
1,185 children One typical RI
Sample loss of 4.4% (discontinuation
and mother’s
Exclusion of 70 stillbirths
3,031 not selected
Sample loss of 41.8% because of
non-return (893) Sample loss of 4.6% because of
atypical and incomplete DR
C
onc
eição SIO to the design effect of the study. After that, data
regarding socioeconomic status, demograph-ics, prenatal care, and the lifestyle of the moth-er-child pairs were compared between those who participated (1,185) and those who did not participate in the study (3,981). The intergroup differences for the variables twin birth, low birth-weight, preterm birth, maternal education, and socioeconomic status were significant (p<0.05). These differences resulted from the children who were not selected for the subsample (3031), losses due to non-attendance of the interviews (893), and atypical or incomplete DRs (57). For this reason, the sample was also weighted accord-ing to the inverse of the probability of selection based on the lack of responses.
The number of children who completed the dietary surveys was sufficient for the purposes of this study. Using an error of 3%, an expected prevalence of children9,10 whose diets required
improvement of approximately 75%, and a 95% confidence interval, the required sample size was 797 children.
The interviews were conducted in the child-care sector of the University Hospital of the Fed-eral University of Maranhão or during home visits by appointment when it was not possible for the participants to visit the hospital. Trained interviewers administered this instrument to the children’s mothers or guardians.
Structured questionnaires were used to col-lect data on socioeconomic status, demograph-ics, prenatal care, lifestyle, and food consump-tion. Demographic data included the child’s sex and age in months (13–23 or 24–35); the mother’s age (<20 or ≥20 years), self-reported ethnicity (Caucasian, Black, Mixed, or others), education (≤9, >9 and ≤12, or >12 years), marital status (with or without partner), paid work (yes or no), and parity (primiparous or multiparous); whether the child was a twin pregnancy (yes or no), preterm birth (yes or no), or had low birth-weight (yes or no); maternal smoking (yes or no) and alcohol consumption (yes or no); number of residents in the child’s home (1–3, 4–5, or >5); and family income in minimum wages (up to 1, >1 to ≤3, or >3). The socioeconomic status of the families was determined using the economic classification criteria of Brazil12 and was
catego-rized as A/B, C, or D/E.
Th Data pertaining to the food products, food preparations, and beverages that the child consumed the day before the interviews, from the first to the last meal were collected. The amounts of salt and oil added to the preparations were
not considered. To help the parents/guardians describe the size of each serving, a photo album depicting food portions, utensils, and standard measurements was used13. The amounts of food
and beverages consumed were estimated as home measurements and converted to weight or vol-ume measurement units using a specific instru-ment14 and food labels.
Because of the difficulty mothers have deter-mining how much milk their child consumes, the methodology proposed by Drewett et al.15 was
adopted to minimize underreporting. This meth-od is inexpensive, easy to use, and determines the volume of breast milk consumed based on complementary feeding (in kilocalories) and the child’s age (in days).
The nutritional composition of each partic-ipant’s diet was calculated using Virtual Nutri Plus® software, version 2010. The software da-tabase was adapted by changing the nutritional compositions of some food products and add-ing information about missadd-ing food products by consulting composition tables for Brazilian foods14,16 and food labels.
A single DR does not represent normal in-dividual consumption. For this reason, we used The Multiple Source Method® (MSM®) software version 1.0.117 to adjust for the intrapersonal variability of food consumption to obtain more accurate estimates. A non-probabilistic sample of 206 children from the BRISA birth cohort was used, and their food intake was determined by administering three DRs to each child.
The North American HEI developed by Ken-nedy et al.5 was adapted to accommodate the
di-etary guidelines for Brazilian children. Then, the quality of the study group’s diet was evaluated. The HEI score was determined by summing ten components that characterize different aspects of a healthy diet and that have different recom-mended amounts according to the energy needs of each age group6. This study considered an
en-ergy requirement of 1,300 kcal per child18. Table
1 describes all the components and the HEI score criteria adapted for children aged 1 to 2 years.
To adapt the North American HEI, the “Food Guide for Children: Ten Steps to Healthy Eating” (“Guia Alimentar para Crianças: dez passos para uma alimentação saudável”), proposed by the Ministry of Health19, was used as a parameter for
e C
ole
tiv
a,
23(12):4095-4106,
2018
were classified into their respective food groups, and the number of servings recommended per day was determined. Food preparations that in-cluded more than one food group, such as soups, sandwiches, and pizza, were deconstructed, and their ingredients were classified into the corre-sponding food groups.
Because the original HEI was based on the eating habits of the North American population, the food groups were adjusted to meet the di-etary recommendations for Brazilian children19.
In the food pyramid designed for American chil-dren20, leguminous plants are part of the meats
and vegetables group, and potatoes and other tubers are included in the vegetables group. In the adapted HEI, leguminous plants were kept in the meat group because they contribute to pro-tein consumption, and tubers were included in the cereals and breads group because they are a source of starch.
Fried products and fat-rich foods (potato chips, snacks, bacon), sweet foods and sugary drinks (candies, milk drinks, sandwich cookies, stuffed cakes, honey, soft drinks, ice cream, pro-cessed juices) and propro-cessed meat products (pro-sciutto, sausage, nuggets, ham, franks) were not included in the food groups because they contain a large amount of sugar and fat.
The number of servings of each type of food consumed was calculated as defined in the “Food Guide for Children: Ten Steps to Healthy Eating” (“Guia Alimentar para Crianças: dez passos para uma alimentação saudável”)19 and the
recom-mendations of the Brazilian Society of Pediat-rics18. The total number of servings of each food
group was determined by summing the number
of servings of all food products of that group. A score of 10 was assigned when the amount the child consumed was equal to or higher than the recommendations for each food group, and a score of 0 was assigned when a certain food group was not consumed at all. The consump-tion of an intermediate number of servings was scored accordingly.
Components six to nine of the HEI corre-spond to products that should be consumed in moderation, including total fats, saturated fats, cholesterol (mg), and sodium (mg). A score of 10 corresponded to a diet containing up to 30% of total energy from total fats, 10% of total en-ergy from saturated fats, 300 mg of cholesterol, and 1000 mg of sodium per day. A score of zero corresponded to a diet containing ≥ 45% of the total energy from fats, 15% of total energy from saturated fats, 450 mg of cholesterol, and 1500 mg of sodium per day. Component 10 assessed dietary variety by determining the number of different food products consumed each day. Foods were included in this count if at least 50% of a recommended serving was consumed, and similar foods (such as different cuts of meat and cheese types) and the same food product pre-pared in various ways (baked, fried, roasted) were grouped and counted as a single item. Therefore, the consumption of up to three different foods was given a score of 0, and the consumption of at least eight different foods received a score of 10. The consumption of intermediate amounts of the evaluated components received proportional scores. We applied the criteria recommended by Basiotis et al.6 to analyze components six, seven,
eight, and ten. We adopted the Brazilian
Minis-Table 1. Components and criteria for scoring the Healthy Eating Index for children aged 1 to 2 years. São Luís
(MA), 2010–2013.
Components
Minimum score criteria (score = 0)
Maximum score criteria (score = 10)
Cereals, bread and tubers (servings per day) 0 5
Vegetables (servings per day) 0 3
Fruits (servings per day) 0 4
Milk and dairy products (servings per day) 0 3
Meat, eggs, and leguminous plants (servings per day) 0 4
Total fat (% energy) ≥ 45 ≤30
Saturated fat (% energy) ≥ 15 < 10
Cholesterol (mg per day) ≥ 450 ≤ 300
Sodium (mg per day) ≥ 1,500 ≤ 1,000
C
onc
eição SIO try of Health recommendation19 to determine
the maximum score for component nine and the “Tolerable Upper Intake Levels, Elements” rec-ommended by the National Academies Institute of Medicine21 to determine the minimum score.
The score for each component of the adapt-ed HEI variadapt-ed between zero (minimum) and ten (maximum). Therefore, the sum of the scores ranged from 0 to 100 points. In the dietary qual-ity assessment, scores higher than 80 indicated adequate diets, scores between 51 and 80 indi-cated diets that needed improvement, and scores lower than 51 indicated poor diets6.
Socioeconomic and demographic data were processed using Excel software version 2010. All the data were analyzed using STATA software version 12.0®. Descriptive analysis and the Shap-iro-Wilk test were used to assess the normality of the quantitative variables. Categorical variables are presented as frequencies and percentages, and quantitative variables are presented as the means, standard deviations, medians, and percentiles.
The performance of the adapted HEI was as-sessed in terms of construct validity and reliabil-ity, as proposed by Guenther et al.22.
Principal component analysis (PCA) was used to determine whether the structure of the index has more than one food intake dimension. This analysis was based on the correlation be-tween the ten components of the adapted HEI. The matrix was obtained using Varimax rotation. Based on the graphical interpretation of the scree plot23, eigenvalues greater than one were used to
calculate the number of factors to maintain. Construct validity assesses the index’s abili-ty to measure what it intends to measure; in this case, the quality of the diet. Because the nutrient intake is positively correlated with the amount of energy consumed, the HEI may overestimate high-calorie diets22. To evaluate whether the
adapted HEI assessed the dietary quality regard-less of the amount of energy consumed, Pearson’s coefficient was used to determine the correlation between the scores for each HEI component and energy intake.
The reliability of the index was evaluated by analyzing the internal consistency of its compo-nents. The Cronbach alpha coefficient based on the average inter-item correlations was calculat-ed. An alpha value greater than 0.7 indicated ac-ceptable reliability23. We also assessed the effect of
each component on the total score by examining the relationship between each component and the total score of the adapted HEI22.
The significance level was 0.05. All analyses considered the complex sample design and were weighted.
The BRISA project was approved by the Re-search Ethics Committee of the Presidente Dutra University Hospital at UFMA under Opinion No. 223/2009 and complied with the requirements of National Health Council Resolution 196/96. All the participants signed an informed consent form.
Results
Among the 1,185 children evaluated, males (51.3%) and ages 13 to 23 months (85.4%) were predominant. The median age was 16.7 months. Regarding the mothers, 71.4% had more than 9 years of education, with a mean education of 10.9 ± 2.2 years. Additionally, 89.1% of the mothers lived with a partner, and 53.7% belonged to so-cioeconomic class C (data are not included in the table).
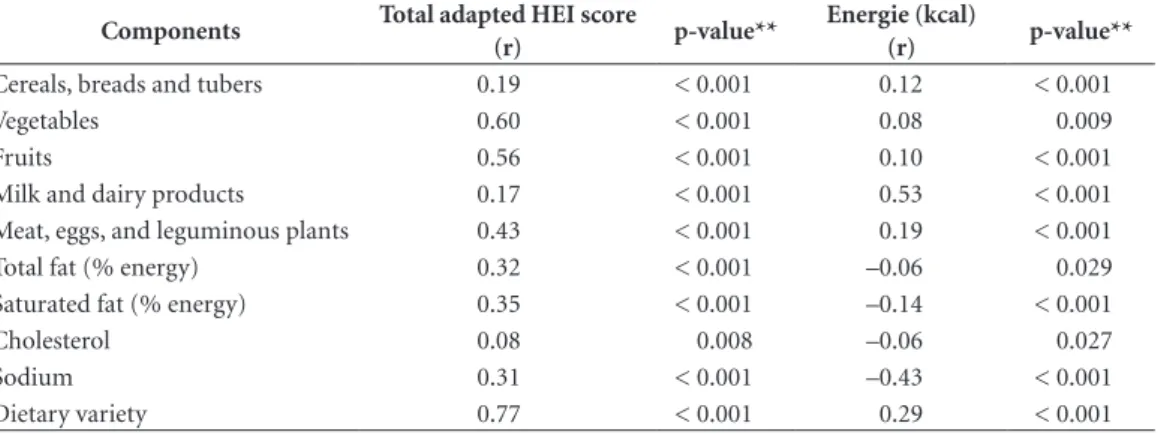
The scores for the adapted HEI components presented low correlations with energy intake (r ≤ 0.29), and the correlation with individual food types was moderate (r = 0.53) except in the case of milk and milk products. The correlations were negative for total fat, saturated fats, sodium, and cholesterol (p < 0.05; Table 2).
The scree plot of the PCA (Figure 2) showed four components with eigenvalues greater than one, representing 58% of the total variance of the adapted HEI.
In the reliability analysis, Cronbach’s alpha coefficient was 0.48. The scores for the adapted HEI indicated a high positive correlation with di-etary variety (r = 0.77) and vegetable consump-tion (r = 0.60). For the other components of the index, the correlations ranged from moderate to low (p < 0.05; Table 2).
e C
ole
tiv
a,
23(12):4095-4106,
2018
Table 2. Correlation between the component scores of the adapted Healthy Eating Index, the total score, and the
energy intake of children aged 1 to 2 years old. São Luís (MA), 2010–2013.
Components Total adapted HEI score
(r) p-value**
Energie (kcal)
(r) p-value**
Cereals, breads and tubers 0.19 < 0.001 0.12 < 0.001
Vegetables 0.60 < 0.001 0.08 0.009
Fruits 0.56 < 0.001 0.10 < 0.001
Milk and dairy products 0.17 < 0.001 0.53 < 0.001
Meat, eggs, and leguminous plants 0.43 < 0.001 0.19 < 0.001
Total fat (% energy) 0.32 < 0.001 –0.06 0.029
Saturated fat (% energy) 0.35 < 0.001 –0.14 < 0.001
Cholesterol 0.08 0.008 –0.06 0.027
Sodium 0.31 < 0.001 –0.43 < 0.001
Dietary variety 0.77 < 0.001 0.29 < 0.001
** The p-value took into account the standard error.
Discussion
The adapted HEI was valid for assessing the over-all dietary quality of Brazilian children and can be used as a marker of nutritional risk in chil-dren.
Regarding the validation of the adapted HEI, the low correlation between its component scores
and energy intake suggests that the index assess-es dietary quality regardlassess-ess of energy intake. Therefore, the scores of calorie-rich diets were not overestimated by this index. These findings are similar to those of the validation and reliabil-ity studies for HEI versions 200522 and 201024.
The four factors identified by the PCA were similar to those found in Andrade et al.’s25
evalu-Figure 2. Screen plot of the principal component analysis of the adapted Healthy Eating Index. São Luís (MA),
2010–2013.
0 2 4 6 8 10 Number
E
ig
en
val
ues
2
1.5
1
.5
C
onc
eição SIO
ation of the validity and reliability of the Revised Brazilian Quality Index of Diet (RQID) for indi-viduals aged 2 years or older. In the adapted HEI, the total variance explained was 58%, compared with 67% for the RQID25; however, it was not
possible to compare this variance with that of the HEI 2005 and 2010 because those values were not reported22,24.
The PCA revealed that several components are included in the adapted HEI and that no lin-ear combination of these components resulted in a significant change in the evaluated dietary recommendations. It is worth noting that the Food Guide for Children recommends the con-sumption of different food products19 because
a high-quality diet requires the consumption of adequate amounts of several food products and nutrients.
The internal consistency of the adapted HEI was low ( = 0.48), but its alpha coefficient was higher than that found in the validation of the original HEI ( = 0.28) and the HEI 2005 ( = 0.43). The low alpha coefficient was expected; in-ternal consistency is not a requirement of the HEI but does affect the reliability of the total score24.
This result can be attributed to the complex and multidimensional nature of dietary quality and because individuals tend not to comply with all dietary recommendations22. For example, an
in-dividual’s diet may meet the recommendations for meat and bean consumption but not for fruit consumption. The elimination of any of the components of the adapted HEI did not improve its internal consistency, indicating the impor-tance of the ten components to its composition. The analysis of the scores for each compo-nent provides additional information about the dietary quality and the total index score because changes in the total score of the adapted HEI reflect variations in the components that have higher correlations with the total score. The cor-relations found in this study were higher than those observed for each component of the orig-inal HEI22. The components dietary variety,
veg-etable consumption, and fruit consumption had higher correlations with the total score; therefore, children with high scores on the adapted HEI presented a varied diet and adequate vegetable and fruit consumption.
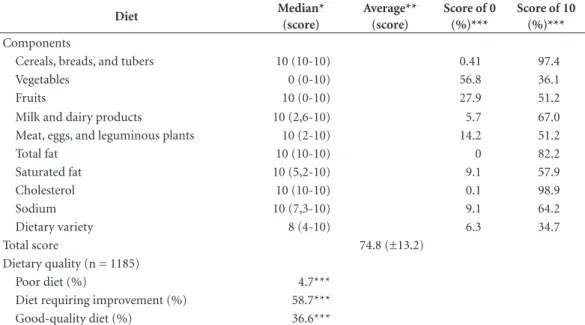
In the dietary quality analysis, the mean HEI score was lower than 80, indicating a need for dietary improvements. This value was sim-ilar to that found by other authors in national studies9,10,26 and international studies6,27 in which
the mean HEI values ranged from 73.9 to 75.7 points, thus indicating that the dietary quality of the children in those studies also needed im-provement.
Table 3. Descriptive measures for the scores of each component and the total Healthy Eating Index score,
percentage of children who obtained the minimum (0) or maximum score (10), and classification of dietary quality. São Luís (MA), 2010–2013.
Diet Median*
(score)
Average** (score)
Score of 0 (%)***
Score of 10 (%)***
Components
Cereals, breads, and tubers 10 (10-10) 0.41 97.4
Vegetables 0 (0-10) 56.8 36.1
Fruits 10 (0-10) 27.9 51.2
Milk and dairy products 10 (2,6-10) 5.7 67.0
Meat, eggs, and leguminous plants 10 (2-10) 14.2 51.2
Total fat 10 (10-10) 0 82.2
Saturated fat 10 (5,2-10) 9.1 57.9
Cholesterol 10 (10-10) 0.1 98.9
Sodium 10 (7,3-10) 9.1 64.2
Dietary variety 8 (4-10) 6.3 34.7
Total score 74.8 (±13.2)
Dietary quality (n = 1185)
Poor diet (%) 4.7***
Diet requiring improvement (%) 58.7***
Good-quality diet (%) 36.6***
e C
ole
tiv
a,
23(12):4095-4106,
2018
The dietary quality classification indicated a higher percentage of children with healthy diets than that found in other studies. Domene et al.9
applied the HEI to 94 children aged 2 to 6 years in Campinas (SP) and found that 70% needed to improve their diets. Rauber et al.10 reported that
the diets of 79.7% of 345 children aged 3 to 4 years old in São Leopoldo (RS) needed improve-ment and that only 9.6% had healthy diets.
The cereals, bread, and tubers group was the largest contributor to the high scores in the adapted HEI. This finding contradicts the results of Domene et al.9, who reported a low
consump-tion of cereals by children. In this study, a high percentage (42.1%) of children had a saturated fat intake that was higher than recommended; however, this percentage was lower than that observed by other authors (57.3%)9. Compared
with the findings of Rauber et al.28, a higher
per-centage of the children in our study consumed the recommended amounts of eight components of the HEI. A higher proportion of the children from these other studies obtained maximum scores for the consumption of milk and dairy products (72.5%) and sodium (71.0%).
A child’s diet changes with age and tends to become more diversified29. However, in Brazil,
children younger than 5 years old are consuming low nutritional quality foods, including instant noodles, processed yogurts, cookies, and snacks, among other products containing high amounts of added sugar, sodium, and saturated fats1,30.
Therefore, the improved diet quality in the study group may be the result of lower consumption of unhealthy foods, considering the lower age of this group compared with the broader age groups evaluated in previous studies9,10. In turn, the
differences in results could be attributed to the diverse socioeconomic statuses, cultural back-grounds, and eating habits31 of the northeastern
population compared with the population living in southeastern and southern Brazil.
The evaluation of the components of the adapted HEI indicated that a high percentage of the children did not consume vegetables, corrob-orating the findings of other authors who also observed insufficient vegetable consumption in their assessments of the overall quality of chil-dren’s diets9,28,32. The fruit group was the HEI
component with the second highest frequency of zero scores, indicating low fruit consumption by the children. In contrast to our results, Leal et al.26 found that a high percentage (86%) of
chil-dren aged 2 to 5 years old living in Pelotas (RS) consumed the recommended amount of fruits;
their rate of consumption was 34.8% higher than that found in our study.
Because fruits and vegetables are sources of vitamins, minerals, and fiber, the adequate con-sumption of these food products seems to have a protective effect against NCCDs33, diseases that
currently affect Brazilian children younger than 5 years old2,34. Therefore, the low consumption
of fruits and vegetables is a cause for concern because of the risk of developing obesity, high blood pressure, and specific nutritional deficien-cies, including vitamin A deficiency and iron deficiency anemia, which are considered public health problems in Brazil1.
It should be noted that meat and legumes were consumed in insufficient amounts and were not eaten by a high percentage of the children (48.8%). This finding poses a health risk because it is associated with a low intake of iron, folic acid, and fiber26.
Our study group presented limited dietary variety. The most frequently consumed food groups were cereals, bread, and tubers (which in-cludes the thickeners used to prepare porridges), followed by milk and dairy products, indicating that a porridge-based milk diet predominated among the children. These findings agree with those of previous studies and indicate that the dietary variety of children changes with age30 and
that, during the first two years of life, the diet is minimally diversified and is composed primarily of milk and dairy products35.
A high proportion of milk and thickeners in the diet was also observed among children aged 6 to 35 months in Aracaju, Sergipe state (SE)36,
indicating food monotony. In this respect, a milk-based diet is a negative finding for our study group because this dietary pattern provides a low concentration of nutrients and is a risk factor for anemia and deficiencies in zinc and other micro-nutrients. Because no single food product con-tains all necessary nutrients, dietary diversity is essential to supply the energy and nutrients need-ed for a child’s growth and healthy development. A high percentage of children consumed the recommended amount of total fat. However, only 57.9% of the study group consumed ade-quate amounts of saturated fats, indicating inad-equacies of dietary quality. There is a consensus that saturated fats are unhealthy because they are atherogenic and are associated with the risk of cardiovascular disease; thus, they should be con-sumed in moderation33.
interview-C
onc
eição SIO er’s assessment and the interviewees’ recall. For
this reason, DR may underestimate or overes-timate actual food consumption; furthermore, DRs do not reflect eating habits when they are only administered once. These limitations were minimized by applying the following strategies: training interviewers, standardizing food mea-surements, using a food photo album to help the respondents recall the amounts consumed, evaluating the consistency of data from the ques-tionnaires and database, adjusting the nutritional data acquired from food banks, and adjusting the intrapersonal variability of food consumption.
A limitation of the HEI was that excessive consumption of food groups was not scored, which prevented the assessment of overfeeding. Excessive consumption was not scored because of the lack of consensus on the maximum num-ber of recommended servings for each food group that comprises the HEI. However, given the tendency toward a continuous increase in the prevalence of obesity from 4.1% to 16.6% for boys and from 2.4% to 11.8% for girls younger than 5 years between 1989 and 2008–200937, the
scientific community of Brazil needs to discuss and establish maximum food consumption lim-its for children.
In this study, we chose to adapt the original version of the HEI6. We chose not to use the HEI
2005 or the HEI 2010 because these versions in-cluded whole grains among their components, and this food group is not generally consumed by Brazilian children10, particularly those
en-gaged in complementary feeding. In addition, a high percentage of the study group was aged 13 to 23 months, and the Brazilian guidelines19
do not include recommendations regarding the
consumption of whole grains for this age group, which prevented us from adapting these later versions of the HEI.
The strengths of this study were its popula-tion-based nature, its use of random sampling, and the sufficient number of children sampled in São Luís in 2010. The sample was weighted to accommodate the study design and sample loss and to minimize selection bias. Intrapersonal variability in food consumption was adjusted to obtain more accurate estimates. It is worth not-ing that this study is the first to assess the validity of the HEI for Brazilian children aged 1 to 2 years old.
Therefore, the adapted HEI can be used to assess overall dietary quality and support the implementation of strategies to promote healthy eating and improve the diet habits and health conditions of children.
Conclusions
e C
ole
tiv
a,
23(12):4095-4106,
2018
Collaborations
SIO Conceição conceived the study, reviewed the literature, performed the analyzes and in-terpretation of the data, drafted the manuscript, contributed with the writing and approval of the final version to be published. BR Oliveira performed the analysis and interpretation of the data, drafted the manuscript, contributed with the writing and approval of the final version to be published. AAM Silva coordinated the project, carried out the analyzes and interpretation of the data, contributed with the writing and approval of the final version to be published.
References
1. Brasil. Ministério da Saúde (MS). Pesquisa Nacional de Demografia e Saúde da Criança e da Mulher – PNDS 2006: dimensões do processo reprodutivo e da saúde da criança. Brasília: MS; 2009. [Série G. Estatística e Infor-mação em Saúde].
2. Nobre LN, Lamounier JA, Franceschini SCC. Determi-nantes sociodemográficos, antropométricos e alimen-tares de dislipidemia em pré-escolares. J Pediatr 2013; 89(5):462-469.
3. Volp ACP. Revisão sobre os índices e instrumentos die-téticos para determinação da qualidade de dietas. Rev Bras Promoç Saúde 2011; 24(4):404-414.
4. Wirt A, Collins CE. Diet quality – what is it and does it matter? Public Health Nutrition 2009; 12(12):2473-2492.
5. Kennedy ET, Ohls J, Carlson S, Fleming K. The Healthy Eating Index: design and applications. J Am Diet Assoc
1995; 95(10):1103-1108.
6. Basiotis PP, Carlson A, Gerrior SA, Juan WY, Lino M.
The Helthy Eating Index: 1999-2000. Washington: U.S. Department of Agriculture. Center for Nutrition Policy and Promotion; 2002. [Publication. CNPP-12]. 7. Smithers LG, Golley RK, Brazionis L, Lynch JW.
Char-acterizing whole diets of young children from devel-oped countries and the association between diet and health: a systematic review. Nutr Rev 2011; 69(8):449-467.
8. Moreira PRS, Rocha NP, Milagres PC, Novaes JF. Análi-se crítica da qualidade da dieta da população brasileira segundo o Índice de Alimentação Saudável: uma revi-são sistemática. Cien Saude Colet 2015; 20(12):3907-3923.
9. Domene SMA, Jackix EA, Raposo HF. Adaptação das diretrizes alimentares para a população brasileira e o estabelecimento do Índice de Alimentação Saudável para pré-escolares de 2 a 6 anos. Nutrire: rev Soc Bras Alim Nutr 2006; 31(2):75-90.
10. Rauber F, Louzada MLC, Vitolo MR. Healthy Eating Index Measures Diet Quality of Brazilian Children of Low Socioeconomic Status. J Am Coll Nutr 2014; 33(1):26-31.
11. Silva AAM, Batista RFL, Simões VMF, Thomaz EBAF, Ribeiro CCC, Lamy-Filho F, Lamy ZC, Alves MTSSB, Loureiro FHF, Cardoso VC, Bettiol H, Barbieri MA. Mudanças na saúde perinatal em duas coortes de nas-cimento (1997/1998 e 2010) em São Luís, Maranhão, Brasil. Cad Saude Publica 2015; 31(7):1437-1450. 12. Associação Brasileira de Empresas de Pesquisa (ABEP).
Critério de classificação econômica Brasil. [página da in-ternet]. Brasil; 2012. [acessado 2012 jul 15]. Disponível em: file:///C:/Users/HP/Downloads/09_cceb_2012.pdf 13. Zabotto CB, Viana RPT, Gil MF. Registro fotográfico
para inquéritos dietéticos: utensílios e porções. Campi-nas, Goiânia: UNICAMP, UFG; 1996.
14. Pinheiro ABV, Lacerda EMA, Benzecry EH, Gomes MCS, Costa VM. Tabela para avaliação de consumo ali-mentar em medidas caseiras. 5ª ed. São Paulo: Atheneu; 2004.
C
onc
eição SIO 16. Núcleo de Estudos e Pesquisas em Alimentação e
Uni-versidade Estadual de Campinas (NEPA-UNICAMP).
Tabela brasileira de composição de alimentos - TACO. 4ª ed. Campinas: NEPA-UNICAMP; 2011.
17. Hartting U, Haubrock J, Knuppel S, Boeing H. The MSM program: web-based statistics package for esti-mating usual dietary intake using the Multiple Soure Method. Euro Clin Nutr 2011; 65(Supl. 1):S87-S91. 18. Sociedade Brasileira de Pediatria (SBP). Departamento
de Nutrologia. Manual de orientação para a alimenta-ção do lactente, do pré-escolar, do escolar, do adolescente e na escola. 3ª ed. Rio de Janeiro: SBP; 2012.
19. Brasil. Ministério da Saúde (MS). Dez passos para uma alimentação saudável: guia alimentar para crianças me-nores de dois anos - um guia para o profissional da saúde na Atenção Básica. 2ª ed. Brasília: MS; 2013.
20. United States Department of Agriculture (USDA). Center for Nutrition Policy and Promotion. Tips for using the food guide pyramid for Young children 2 to 6 years old. [página da internet]. 1999 Mar. [acessado 2015 Out 10]. Disponível em: http://www.cnpp.usda. gov/sites/default/files/archived_projects/FGP4Kids-TipsBook.pdf
21. Institute of Medicine of the National Academies. Food and Nutrition Board. Dietary Reference Intakes for Wa-ter, Potassium, Sodium, Chloride, and Sulfate. [página da internet]. Washington: National Academy Press; 2005. [acessado 2016 Mar 15]. Disponível em: http:// www.nap.edu/read/10925/chapter/1
22. Guenther PM, Reedy J, Krebs-Smith SM, Reeve BB. Evaluation of the Healthy eating index-2005. J Am Die-tetic Assoc 2008; 108(11):1854-1864.
23. Damasio BF. Uso da análise fatorial exploratória em psicologia. Avaliação Psicológica 2012; 11(2):213-228. 24. Guenther PM, Kirkpatrick SI, Reedy J, Krebs-Smith
SM, Buckman DW, Dodd KW, Casavale KO, Carroll RJ. The Healthy Eating Index – 2010 is a valid and reliable mensure of diet quality according to the 2010 Dietary Guidelines for Americans. J Nutr 2014; 144(3):399-497 25. Andrade SC, Previdelli NA, Marchioni DML, Fisberg,
RM. Avaliação da confiabilidade e validade do Índice de Qualidade da Dieta Revisado. Rev Saude Publica
2013; 47(4):675-683.
26. Leal KK, Schneider BC, França GVA, Gigante DP, San-tos I, Assunção MCF. Qualidade da dieta de pré-esco-lares de 2 a 5 anos residentes na área urbana da cidade de Pelotas, RS. Rev Paul Pediatr [página da internet]. 2015; 33(3):1-8.[acessado 2015 Out 17]. Disponível em: http://dx.doi.org/10.1016/j.rpped.2015.05.002 27. Carlson A, Lino M, Gerrior S, Basiotis PP. Report
card on the diet quality of children ages 2 to 9. Nutrition Insights. Center for Nutrition Policy and Promotion. United States Department of Agriculture [página da internet]. 2001 Sept; 25. [acesso 2016 jan 15]. Disponí-vel em: http://origin.www.cnpp.usda.gov/Publications/ NutritionInsights/ Insight 25.pdf
28. Rauber F, Costa Louzada ML, Feldens CA, Vitolo MR. Maternal and family characteristics associated with the Healthy Eating Index among low socioeconomic status Brazilian children. J Hum Nutr Diet 2013; 26(4):369-379.
29. Erkkola M, Kittälä P, Takkinen HM, Kronberg-Kippilä C, Nevalainen J, Simell O, Ilonen J, Veijola R, Kinip M, Virtanen SM. Nutrient intake variability and number of days needed to assess intake in preschool children.
Br J Nutr 2011; 106(1):130-140.
30. Toloni MHA, Longo-Silva G, Goulart RMM, Taddei JAAC. Introdução de alimentos industrializados e de alimentos de uso tradicional na dieta de crianças de creches públicas no município de São Paulo. Rev Nutr
2011; 24(1):61-70.
31. Silva TA, Vasconcelos FAG. Procedimentos metodoló-gicos empregados em questionários de frequência ali-mentar elaborados no Brasil: uma revisão sistemática.
Rev Nutr 2012; 25(6)785-797.
32. Manios Y, Kourlaba G, Kondaki K, Grammatikaki E, Birbilis M, Oikonomou E, Roma-Giannikou E. Diet quality of preschoolers in Greece based on the Healthy Eating Index: the GENESIS study. J Am Diet Assoc 2009; 109(4):616-623.
33. Whord Health Organization (WHO). Diet, nutrition and the prevention of chronic diseases. Geneva: WHO Library; 2003. [WHO Technical Report Series; 916]. 34. Crispim PAA, Peixoto MRG, Jardim PCBV. Fatores de
risco associados aos níveis pressóricos elevados em crianças de dois a cinco anos. Arq Bras Cardiol 2014; 102(1):39-46.
35. Laningan JA, Wells JCK, Lawson MS, Cole TJ, Lucas A. Number of days nedded to assess energy and nutrient intake in infants and young children between 6 months and 2 years of age. Eur J Clin Nutr 2004; 58(5):745-750. 36. S-Filha EO, Araújo JS, Barbosa JS, Gaujac DP, Santos
CFS, Silva DG. Consumo dos grupos alimentares em crianças usuárias da rede pública de saúde do mu-nicípio de Aracaju, Sergipe. Rev Paul Pediatr 2012; 30(4):529-536.
37. Monteiro CA, Levy RB. Velhos e novos males da saúde no Brasil: de Geisel a Dilma. São Paulo: Hucitec, NUPENS/ USP; 2015.
Article submitted 05/04/2016 Approved 22/11/2016
Final version submitted 24/11/2016
This is an Open Access article distributed under the terms of the Creative Commons Attribution License BY