RevPaulPediatr.2015;33(3):310---317
www.rpped.com.br
REVISTA
PAULISTA
DE
PEDIATRIA
ORIGINAL
ARTICLE
Diet
quality
of
preschool
children
aged
2
to
5
years
living
in
the
urban
area
of
Pelotas,
Brazil
Katharine
Konrad
Leal
∗,
Bruna
Celestino
Schneider,
Giovanny
Vinicius
Araújo
Franc
¸a,
Denise
Petrucci
Gigante,
Iná
dos
Santos,
Maria
Cecília
Formoso
Assunc
¸ão
UniversidadeFederaldePelotas(UFPel),Pelotas,RS,Brazil
Received16June2014;accepted17September2014
Availableonline28June2015
KEYWORDS
Preschool; Indexes; Foodhabits; Diet
Abstract
Objective: ToassessthedietaryqualityofpreschoolchildrenintheurbanareaofPelotas,Rio GrandedoSul,southernBrazil.
Methods: DietaryqualitywasmeasuredaccordingtotheHealthyEatingIndex(HEI),adapted toBrazil.FoodconsumptionwasobtainedusingtheFoodFrequencyQuestionnaire(FFQ).The indexscorewasobtainedbyascore,rangingfrom0to100,distributedin13foodgroupsthat characterizedifferentcomponentsofahealthydiet.Thebetterthequalityofthediet,the closerthescoreisto100.
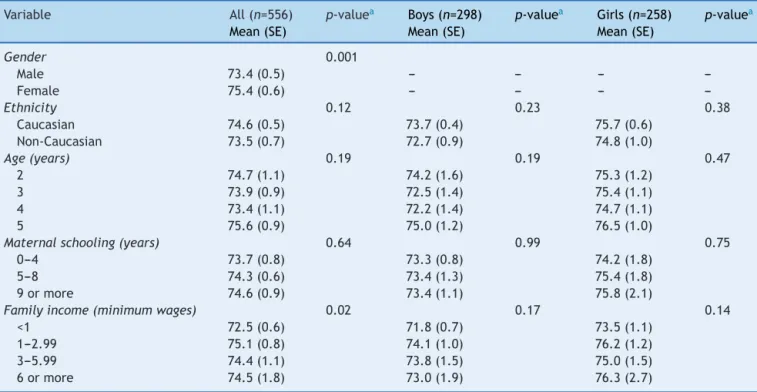
Results: Dietary quality was evaluated in556preschoolers. The meanHEI score value was 74.4points,indicatingthatdietsneedimprovement.Themeanscoresweresignificantlyhigher amonggirlsandinchildrenfromfamilieswithincomebetweenoneandlessthanthreeminimum wages.
Conclusions: Thechildrenshowedvegetableconsumptionbelowtherecommendedlevel,while foodsofthefoodgroupofoilsandfats,aswellasthegroupofsugars,candies,chocolatesand snacks,wereconsumedinexcess.Itisimportanttoreinforceguidelinestopromotehealthier eatinghabits,whichmaypersistlaterinlife.
© 2015Sociedadede Pediatria de SãoPaulo. Published by Elsevier Editora Ltda.All rights reserved.
PALAVRAS-CHAVE
Pré-escolar; Índices;
Hábitosalimentares; Dieta
Qualidadedadietadepré-escolaresde2a5anosresidentesnaáreaurbanada cidadedePelotas,RS
Resumo
Objetivo: Avaliaraqualidadedadietadepré-escolaresresidentesnaáreaurbanadacidade dePelotas,RioGrandedoSul,Brasil.
DOIoforiginalarticle:http://dx.doi.org/10.1016/j.rpped.2015.05.002
∗Correspondingauthor.
E-mail:[email protected](K.K.Leal).
Métodos: AqualidadedadietafoiavaliadadeacordocomoÍndicedeAlimentac¸ãoSaudável (IAS),adaptadopara oBrasil.OconsumoalimentarfoimedidopormeiodeQuestionáriode FrequênciaAlimentar.Oescoredoíndicefoiobtidoporumapontuac¸ãodistribuídaem13grupos alimentares,quecaracterizamdiferentesaspectosdeumadietasaudável,variac¸ãode0a100 pontos.Quantomaispróximode100,melhorseráaqualidadedadieta.
Resultados: Aqualidadedadietafoiavaliadaem556pré-escolares.Ovalormédiodoescore doIASfoide74,4pontos.Issoindicaqueasdietasnecessitamsermelhoradas.Asmédiasdos escoresforamsignificativamentemaioresentreasmeninaseentrecrianc¸asprovenientesde famíliascomrendafamiliarentreumemenosdetrêssaláriosmínimosmensais.
Conclusões: As crianc¸as apresentaram consumo de verduras e legumes abaixo da recomendac¸ão, enquanto osalimentos do grupo dosóleos e gorduras,bem como dogrupo dos ac¸úcares,balas, chocolatesesalgadinhos,foramconsumidosem excesso. Éimportante reforc¸arorientac¸õesparapromoverumhábitoalimentarmaissaudável,quepoderáperdurar emetapasposterioresdavida.
© 2015Sociedadede Pediatriade SãoPaulo. Publicado porElsevier Editora Ltda.Todosos direitosreservados.
Introduction
Adequatenutritioninchildhoodhasanimpactonthechild’s growthandphysiologicaldevelopment,healthandwelfare. Atthisphase,abalanceddietbecomesveryimportant,as theyaregoingthroughaphaseofgrowth,development,and formationofpersonalityandeatinghabits.1
Parents influence the development of their children’s eating habits, as they are responsible for the process of introducingfoods,thedietarypatternofferedtothechild and their attitudes toward food.2 Children’s food
prefer-ences are learned from repeated experiences during the consumptionofcertainfoods.Thesehabitshaveaneffect on their food intake, subject to the physiological conse-quences and the social context in which the child lives. Inthis phasetheypreferhigh-caloriefoods, astheybring greatersatietyandensurethenecessaryenergysupplyfor basicneeds.3
Inthelastfewdecades,thepopulation’sfoodqualityhas beenevaluatedthroughdietaryindexes.Theseconsistofa foodanalysismethodaimingtodetermineitsqualitythrough oneormoreparameterssimultaneously:adequatenutrient intake,number of servings consumed by each food group andtheamountofdifferentfooditemspresentinthediet.4
MostoftheseindicesweredevelopedintheUnitedStates, andarebeingadaptedandusedinothercountries.5Among
themostoftencitedintheliteratureare:nutrientcontent,6
dietaryvarietyscore,7theHouseholdDietaryDiversityScore
(HDDS),8theDietQualityIndex(DQI),4the HealthyEating
Index(HEI),9andtherevisedDietQualityIndex.10
The HEI wascreated in 1995 bythe US Departmentof Agriculture, with the goal of building a global diet qual-ityindexthatwouldincorporatethenutritionalneedsand dietaryguidelinesforUSconsumers inasinglemeasure.11
TheHEIconsistsoftenitems,whicharebasedondifferent aspectsofahealthydiet,andwasadaptedtoBrazilbasedon theDietaryGuidelinesfortheBrazilianPopulation(DAPBs)12
byDomeneetal.13forusewithpreschoolchildrenagedtwo
tosixyears.
This studyevaluates thedietaryqualityof asample of preschoolersinPelotas,stateofRioGrandedoSul,Brazil, usingtheHEI.
Method
Thisstudyusesdataonthedietofpreschoolersparticipating inapopulation-basedcross-sectionalstudy,whichconsisted asthefourth assessmentof atimeseriesaimingtoassess theeffectofironfortificationofwheatflourandcornmeal onanemiainchildrenaged<sixyears,carriedoutinPelotas, Brazilin2008.14Methodologicaldataaredescribedina
pre-viouspublication.14
The interview wascarried outby trainednutritionists, withthechild’smotherorguardian,usingapre-coded ques-tionnaire. Demographic variables were collected (gender andageofthechildreninmonths)aswellassocio-economic (familyincomeinminimumwages),maternal schooling(in years)anddietaryvariables.Foodfrequencyquestionnaire (FFQ),aquantitativetoolwith56fooditemsdistributedin cereals,legumes,vegetables,fruits,dairy products,meat and meat products, fats, sugars and other foods, with a recallperiodofoneyear,wasdevelopedforthestudy,and usedto assess food consumption and the dietary quality. The FFQ was validated using three 24-h recalls. The de-attenuatedPearson’scorrelationcoefficientswereallequal toor greater than 0.50 for macronutrients calcium, iron, sodium, vitamin C, cholesterol and saturated fat (unpub-lisheddata).
Dietary quality was analyzed using the Healthy Eating Index(HEI)proposedbyDomeneetal.13 Thus,ascorewas
312 LealKKetal.
fivedietarygroups,aproportionalreductioninthesumof thepossiblenumberofpointswasperformedfrom80to50. Theotherfivecomponents,whichcontributedtheremaining 50%ofthescore,were:(9)totalfat;(10)saturatedfat;(11) cholesterol;(12)sodium,and(13)dietvariety.
Toscorecomponents1---8,theidealnumberofservings tobeconsumeddailywasdeterminedbytheratiobetween theenergyrequirementsoftheagerangeandthenumberof servingssuggestedbytheDietaryGuidelinesfortheBrazilian Population(DAPBs),12whichhavebeenadaptedaccordingto
theageandtherecommendationsoftheBrazilian Society ofPediatrics(SBP).15 Eachfoodconsumedreceivedascore
accordingtothesizeoftheconsumedserving,asshownin
Table1. Inthis chart,somecomponents arerepeated,as somerecommendationsaredifferentforboysandgirls.
Thescoreofcomponents9---13requirednoadjustments andwascarriedoutusingthesameparametersindicatedby Bowmanetal.9Fortheintakeoftotalfatandsaturatedfat,
thescorecriterionusedwasthepercentageofdailyenergy providedbythesenutrients. Themaximum score(10)was attributedtovalues≤30% for totaland10% for saturated
fat,whilefortheminimumscorecriterion(zero),the val-uesof45%and15%wereusedfor totalandsaturatedfat, respectively. Forcholesteroland sodiumintake,the max-imumscore of 10 wasattributed tothose whoconsumed 300mgor lessofcholesteroland2400mgor lessofsodium perday.Theminimumscoreofzerowasgiventothosewho consumed450mgormoreofcholesteroland4800mgormore ofsodiumperday.Finally,forthescoringofdietvariety,only foodsfromthefirstsixgroupswereconsidered, excluding foodclassifiedasoil andfatsor ascandyandsnacks.The maximumscoreof10wasobtainedwhenthechildhad con-sumedatleastahalfservingofeightormoredifferenttypes offoodin aday. Aminimumscore ofzero wasattributed whenthechildhadconsumedthreeorlesstypesoffoodin aday.Intermediatevalueswereattributedtoallevaluated components,asshowninTable1.
HEIfinal scorewas attainedby addingthe 13assessed components, with 50% of the score being obtained from components1---8,andtheotherhalffromcomponents9---13. Whenscoring,thefollowingintervalswereconsidered: val-ues≥80pointscharacterizedthedietasadequate;between
51and80points,asneedingimprovement,andascore<51 characterizedapoordiet.9
Demographic, socioeconomic and frequency of food intakedatawereprocessedthroughdoubleentrywith con-sistencycheckingofinformationusingEpiInfo6.0software program.Foodsandfoodpreparationsrecordedinthefood frequency questionnaires (FFQs) were analyzed for their nutritionalcompositionusingtheHHHQprogram---DietSys AnalysisSoftware,release4.02,National CancerInstitute, 1999.This informationwasanalyzed using Stata software program,release11.1.Descriptiveanalyseswereperformed tocharacterize the sample. Student’s t test was used to compareHEImeansbygender.Finally,wecarriedout bivari-ateanalysesbetween exposuresandHEI meansby simple linearregression.
Allanalysesconsidereda valueofp<0.05 forstatistical significance.Samplevariationwasshownasstandarderror, astheanalysistookintoaccountthesamplingdesign (svy commandinStatasoftwareprogram,release11.1.), consid-eringthatthesamplingprocesswascarriedoutinmultiple
stages.14 The standard error of the mean is obtained by
dividing thesamplestandard deviationby thesquareroot ofthenumberofobservations, andit indicates,similarto thestandarddeviation,theinaccuracyassociatedwiththe estimationofmeans.
The children’s parents or guardiansgave their written consentbeforethecollectionofinformation.Thisstudywas submittedtotheInstitutionalReviewBoardofthe Universi-dadeFederaldePelotas,andwasapprovedundersubmission number011/08.
Results
The original studyassessed 799children agedzerotofive years.These accounted for 94%of the initiallycalculated sample, which yielded a low percentage of losses and refusals.14 Afterexcluding 243 children youngerthan two
yearsold,thedietof556childrenaged2---5yearswas eval-uated.Themeanagewasfouryears(SE=0.5);mostofthem weremales(53.6%),Caucasians(75.8%),whosemothershad nineormoreyearsofschooling(44.9%),andwhosefamilies hadamonthlyincomebetweenoneand<3minimumwages (48.4%),asshowninTable2.
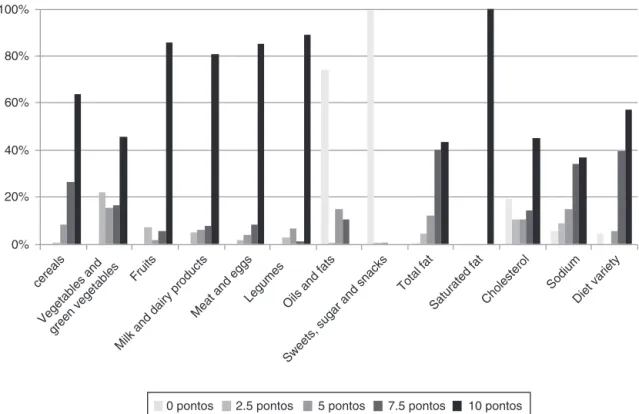
Foods less often consumed by the preschoolers were vegetables/greenvegetablesandcereals,withrespectively 45.7% and 64.0%of children having consumed the recom-mendeddailyamount.Themostoftenconsumedwerethose belongingtothegroupofsweets,sugarsandsnacks,being consumedby99.6%ofchildren.Foodsfromthegroupofoils andfatshadahigherconsumptionthanthatrecommended by74.3%ofchildren.Foodsfromthegroupofmeatandeggs, legumes,fruits,milkanddairyproductsshowedanadequate intake,rangingbetween81.1%and89.2%(Fig.1).
A high score was observed in the evaluation regarding components 9---12 (total fat, saturated fat, cholesterol and sodium), with 100% of children reach-ing the score of 10 in saturated fat consumption. Regarding the diet variety component, 57.4% of the childrenconsumedeightormoredifferenttypesoffoodsin oneday(Fig.1).
Table3showsthemeanscoreforeachofthe13 compo-nentsoftheHEIaccordingtothechildren’sgender.Ofthe10 attainablepointsin eachofthecomponents,we observed thatgirlsachievedhigherscoresthanboysforthe consump-tionofvegetablesandgreenvegetables(8.0vs.6.4),fruits (9.5vs.9.0),milkanddairyproducts(9.4vs.8.9),legumes (9.7vs.9.2),andtotalfat(8.3vs.7.7).
quality
of
preschool
children
aged
2
to
5
years
living
in
the
urban
area
of
P
elotas,
Brazil
313
Table1 CriteriafortheHealthyEatingIndex(HEI)scoreinpreschoolchildrenaccordingtocomponents1---13.
Component/food Recommendation Score
Girls Boys 0 2,5 5,0 7,5 10
1.Cereals 4 4 <1 1serving 2servings 3servings 4servings
2.Vegetablesand greenvegetables
0.5 0 >0and<0.25
serving
0.25serving >0.25and<0.5 serving
0.5serving
2.Vegetablesand greenvegetables
1 <0.25 0.25serving 0.5serving 0.75serving 1serving
3.Fruitandfruit juice
1 <0.25 0.25serving 0.5serving 0.75serving 1serving
3.Fruitandfruit juice
2 <0.5 0.5serving 1serving 1.5serving 2servings
4.Milkanddairy products
1 <0.25 0.25serving 0.5serving 0.75serving 1serving
4.Milkanddairy products
2 <0.5 0.5serving 1serving 1.5serving 2servings
5.Meatandeggs 1 1 <0.25 0.25serving 0.5serving 0.75serving 1serving
6.Legumes 0.5 0 >0and<0.25
serving
0.25serving >0.25and<0.5 serving
0.5serving
6.Legumes 1 <0.25 0.25serving 0.5serving 0.75serving 1serving
7.Oilsandfats 1 1 <0.25 0.25serving 0.5serving 0.75serving 1serving
8.Sugars,candy, chocolatesand snacks
1 1 <0.25 0.25serving 0.5serving 0.75serving 1serving
9.Totalfat 30% 30% 45%ormore >37.5%and<45% 37.5% >30%and<37.5% 30%orless
10.Saturatedfat 10% 10% 15%ormore >12.5%and<15% 12.5% >10%and<12.5% 10%orless
11.Cholesterol 300mg 300mg 450mgormore >375mgand
<450mg
375mg >300mgand
<375mg
300mgorless
12.Sodium 2400mg 2400mg 4800mgormore >3600mgand
<4800mg
3600mg >2400mgand
<3600mg
2400mgorless
13.Dietvariety 8or+different typesoffoods
8or+different typesoffoods
3orless differenttypes ofdifferent foodsinaday
4or5different typesof differentfoods inaday
6differenttypes ofdifferent foodsinaday
7differenttypes ofdifferent foodsinaday
314 LealKKetal.
0% 20% 40% 60% 80% 100%
cereals
Vegetables and green vegetables
Fruits
Milk and dairy products Meat
and eggs
LegumesOils and fa ts
Sweets, sugar an
d snacks Total fat Saturate
d fat
Cholestero l
Sod ium
Diet variety
0 pontos 2.5 pontos 5 pontos 7.5 pontos 10 pontos
Figure1 Frequencyofconsumptionofcomponents1---13accordingtothecategorizedHEIscoreofthepreschoolers.
Table2 Descriptionofthesample ofpreschoolchildren by gender, age, ethnicity, family income and maternal education.
Variable n %
Gender
Female 258 46.4
Male 298 53.6
Age(years)
2 116 20.9
3 140 25.2
4 159 28.6
5 141 25.4
Ethnicity
Caucasian 420 75.8
Non-Caucasian 134 24.2
Familyincome(minimumwages)
<1 134 24.2
1---2.99 268 48.4
3---5.99 99 17.9
6ormore 53 9.6
Maternalschooling(years)
0---4 87 15.7
5---8 218 39.4
9ormore 249 44.9
Discussion
Thispopulation-basedstudy,carriedoutinamedium-sized cityofsouthernBrazil,showedthatthechildren’sdietneeds improvement.AsimilarresultwasfoundbyDomeneetal.13
inastudythatassessedthedietof94preschoolersaged2---6 yearslivinginpoverty-strickenareasinthecityofCampinas, where70%ofchildrenhadtheirdietsclassifiedbetween51 and80points.
Approximatelytwo-thirdsofthechildren(64%)achieved themaximumscoreinthegroupofcereals,eatingfour serv-ingsaday.Barbosaetal.16inastudywithchildrenaged2---3
years attending a nonprofit day care center in the island ofPaquetá,stateofRiodeJaneiro,foundthatonly20%of themconsumedcerealsadequately.
Regarding the consumption of vegetables and green vegetables,only 45.7% ofthe children consumedthe rec-ommendedservingsestablished inthe HEI,whicharetwo servings for boys and one serving for girls. The opposite wasobservedforadequate fruitconsumption(2servingsa dayforboysandoneforgirls),as86%ofthechildren con-sumed the recommendedservings. Fruits, vegetables and greenvegetablesaresourcesofdietaryfiber,withapositive impacton bodyweight, blood glucoselevels and concen-trationsofblood lipids,inadditiontoincreasingthefecal bolus,preventingintestinalconstipation,17andbeing
excel-lentsourcesofvitaminsandminerals.18
Aconsiderable consumptionof milkanddairy products wasobserved,as81.1%ofchildrenreachedthe recommen-dationforthisgroup,whichare2dailyservingsforboysand oneforgirls.Thisfindingcorroboratesthestudycarriedout byValenteetal.19with39preschoolchildrenfromadaycare
Table3 MeanHEIscoreforeachcomponentaccordingtopreschoolers’gender.
HEIcomponents Boys(n=298) Girls(n=258) p-valuea
1.Cereals 8.9 8.8 0.61
2.Vegetablesandgreenvegetables 6.4 8.0 <0.001
3.Fruits 9.0 9.5 0.002
4.Milkanddairyproducts 8.9 9.4 0.030
5.Meatandeggs 9.3 9.5 0.22
6.Legumes 9.2 9.7 0.003
7.Oilsandfats 1.5 1.5 0.98
8.Sugars,candy,chocolatesandsnacks <1.0 <1.0 0.62
9.Totalfat(%TEV) 7.7 8.3 0.005
10.Saturatedfat(%TEV) 10 10
---11.Cholesterol(mg) 6.3 6.6 0.34
12.Sodium(mg) 7.1 7.2 0.75
13.Dietvariety 8.43 8.5 0.70
a TestetdeStudent.HEI,HealthyEatingIndex;TEV,totalenergyvalue.
Regarding theconsumption ofmeatandeggs, 85.4%of thechildren consumedtherecommended amount(1 daily serving).InthestudyperformedbyCastroetal.20halfofthe
preschoolchildren (53.8%)consumed meatsoncetothree timesaweek.Meats,especiallyredmeat,arerichiniron, acomponentofenzymesthatparticipateintheprocessof cellularrespiration and areessential for the transportof oxygenandcarbondioxideinblood.Itsdeficiencycanlead toanemia,withconsequentgrowthandcognitive develop-mentimpairment.20,21
Asforlegumes,agroupevaluatedthroughthe consump-tionofbeans,theyareimportantsourcesofiron,folicacid and dietary fibers, and were present in the daily diet of
89.2%ofchildren,whoreachedthehighestscoreinthisfood group.
Theconsumptionofsugar,candies,chocolatesandsnacks wasabovetherecommendedamount,as99.6%ofthe chil-drendailyconsumedmorethan1servingoffoodsfromthis group. Valente et al.19 in the study carried out in Santa
Maria,observed that over half of the children consumed chocolatemilkoneor moretimesaday.This product usu-allycontains morethan70%of sucrosein itscomposition; sucrose being the most cariogenic carbohydrate, as it is agreat substrate for pathogenic oral microorganisms.3 In
a study carried out by Barbosa et al.22 sugar
consump-tionwasthreetimeshigherthantherecommendedamount
Table4 MeanHEIscorebasedonthevariablesofinterestforallpreschoolersstratifiedbygender.
Variable All(n=556) p-valuea Boys(n=298) p-valuea Girls(n=258) p-valuea
Mean(SE) Mean(SE) Mean(SE)
Gender 0.001
Male 73.4(0.5) --- --- ---
---Female 75.4(0.6) --- --- ---
---Ethnicity 0.12 0.23 0.38
Caucasian 74.6(0.5) 73.7(0.4) 75.7(0.6)
Non-Caucasian 73.5(0.7) 72.7(0.9) 74.8(1.0)
Age(years) 0.19 0.19 0.47
2 74.7(1.1) 74.2(1.6) 75.3(1.2)
3 73.9(0.9) 72.5(1.4) 75.4(1.1)
4 73.4(1.1) 72.2(1.4) 74.7(1.1)
5 75.6(0.9) 75.0(1.2) 76.5(1.0)
Maternalschooling(years) 0.64 0.99 0.75
0---4 73.7(0.8) 73.3(0.8) 74.2(1.8)
5---8 74.3(0.6) 73.4(1.3) 75.4(1.8)
9ormore 74.6(0.9) 73.4(1.1) 75.8(2.1)
Familyincome(minimumwages) 0.02 0.17 0.14
<1 72.5(0.6) 71.8(0.7) 73.5(1.1)
1---2.99 75.1(0.8) 74.1(1.0) 76.2(1.2)
3---5.99 74.4(1.1) 73.8(1.5) 75.0(1.5)
6ormore 74.5(1.8) 73.0(1.9) 76.3(2.7)
316 LealKKetal.
(1serving),mainlyduetothehighconsumptionofartificial fruitjuices,softdrinks,candyandaddedsugar.
All children in this study consumed servings from the group of oils and fats above the recommended amount, whichisonedailyserving.Thismaycontributetothe devel-opmentof Chronic Noncommunicable Diseases (CNDs). Of thechildren,43%achievedtherecommendationfortotalfat component,thatis,an intakelowerthan 30%ofthedaily totalenergyvalue(TEV)derivedfromthisnutrient.In rela-tiontosaturatedfat,100%ofthechildrenhadintakesthat represented 10% or less of caloric intake of this nutrient inthe TEV.The adequate consumption of this typeof fat reducestheriskofheartdiseaseanddyslipidemia.Fatsare sourcesofessentialfattyacidsandfat-solublevitamins(A, D,E and K),which must necessarily be supplied byfood, asthebodycannotproducethem.Thus,allhumanbeings needfoodsourcesoffat.Itisimportanttodifferentiatethe healthierones,whichareessentialforadequatebody func-tions,fromthosetobeavoidedastheydamagehealth,in additiontoconsumingthemwithintherecommendedranges forgoodnutrition.12
As for the sodium and cholesterol components, 36.9% and45.1%ofthechildren,respectively, attainedthe high-estscore,ingesting≤2400mgofsodiumdailyand≤300mgof
cholesteroldaily.Frequentandhighconsumptionoffatsand saltincreasestheriskofdiseasessuchasobesity, hyperten-sionandheartdisease.Cholesterolis acomponentofcell wallsandprecursorofmanyhormones(estrogenand testos-terone)and bileacids, andit also participates in the fat absorptionandvitaminDsynthesisprocesses;however,its excessiveconsumptioncarrieshealthrisks.12
As for the diet variety, the results indicated a varied diet,as97.3%ofthechildrenattainedmorethan7pointsin thiscomponent,astheyconsumedsevenormoretypesof fooddaily.Thisfindingcorroboratesthestudycarriedoutby Domeneetal.13inwhich81%ofthechildrenobtainedmore
than6points,characterizingavarieddiet.
The mean HEI score was higher in girls than in boys (75.4and 73.4, respectively), in contrasttothe study by Domeneetal.13Childrenfromfamilieswithincomebetween
1and<3minimumwagesachievedhigherscoreswhen com-pared to those whose income was lower or greater than thatcategory.Thismayberelatedtothefactthatpoorer familieshavelittleaccesstofoods suchasfruits, vegeta-bles,meatandmilk,whereaschildrenfromhigherincome familiesconsume more processed foods. In this sense, in addition to the family, the school’s role becomes impor-tant,asitinstructsontheimportanceofthenutrientintake andoffers,inabalancedway,thefoodsthatprovidethese nutrients.23
ThereareadvantagesinapplyingtheHEItotheBrazilian population,asitisbasedontheconsumptionoffoodgroups andnotonlyofnutrients.TheHEIallowsthemeasurementof thecomplexityofdifferenteatingpatternsasscoreditems andtheanalysisconsumptiontrends,ifappliedrepeatedly.24
Moreover,becausethescore wasadapted totheassessed agegroup,theresultsadequatelyreflectthequalityofthe dietassessed.
The study assessed diet quality using a FFQ tool built especiallyfor this research,and therefore suitedtolocal reality.Themainlimitationoftheuseofthisindexisthat excessiveconsumptionofcertainfoodgroupsisnotscored
separately,thusnotmakingitpossibletodifferentiate ben-eficialorharmfulexcessiveconsumption.
This study showed that, according with the HEI, the children’sconsumptionofvegetablesandgreenvegetables wasbelowtherecommendedlevel,whereasfoodsfromthe groupofoilsandfats,aswellasfromthegroupofsugars, candies, chocolates andsnackswere consumedin excess. Thesefoods arecaloricallydenseandnutrient-poor,being part of poor eating habits. In this sense, to know about the child’sdietquality andthen reinforcingguidelineson healthyeatingmightbeawaytoimprovethedietof chil-drenandpromotehealthiereatinghabits,whichmaypersist inlaterlife.
Funding
ThisstudywasfundedbytheMinistryofHealth,Brazil.
Conflicts
of
interest
Theauthorsdeclarenoconflictsofinterest.
References
1.Alves FS, Albiero KA. Building and development of food habits in children through nutritional education. Nutric¸ão em Pauta. 2007;15:1676---2274. Available from: http://www. nutricaoempauta.com.br/layoutimpressao.php?cod=554
[accessed30.07.14].
2.Juswiak CR, Comelli FA. Nutric¸ão na escola: projeto vida saudável colégio Jean Piaget. Revista Nutric¸ão Funcional. 2004:5. Available from: https://www.vponline.com.br/site/ revistatextoanterior.php?materiasaibamais=ok&revista codigo=17&materiacodigo=144[accessed30.07.14].
3.VitoloMR.Nutric¸ão:dagestac¸ãoaoenvelhecimento.3rded. RiodeJaneiro:Rubio;2008.
4.Patterson RE, Haines PS, Popkin BM. Diet quality index: capturing a multidimensional behavior. J Am Diet Assoc. 1994;94:57---64.
5.DrewnowskiA,HendersonAS,DriscollA,RollsBJ.Thedietary varietyscore:assessingdietqualityinhealthyyoungandolder adults.JAmDietAssoc.1997;97:266---71.
6.JenkinsRM,Guthrie HA.Identification ofindexnutrients for dietaryassessment.JNutrEduc.1984;16:15---8.
7.Krebs-SmithSM,Smiciklas-WrightH,GuthrieHA,Krebs-SmithJ. Theeffectsofvarietyinfoodchoicesondietaryquality.JAm DietAssoc.1987;87:897---903.
8.DrewnowskiA,HendersonAS,ShoreAB,FischlerC,PreziosiP, HercbergS.DietqualityanddietarydiversityinFrance: implica-tionsfortheFrenchparadox.JAmDietAssoc.1996;96:663---9.
9.BowmanAS,LinoM,GerriorAS,BasiotisPP.Thehealthyeating index:1994---96.FamEconRev.1998;11:2---14.
10.Haines PS, Siega-Riz AM, Popkin BM.The diet quality index revised:ameasurementinstrumentforpopulations.JAmDiet Assoc.1999;99:697---704.
11.CoxDR,SkinnerJD,CarruthBR,MoranJ3rd,HouckKS.Afood varietyindexfortoddlers(VIT):developmentandapplication. JAmDietAssoc.1997;97:1382---8.
13.DomeneSM,Jackix EA,RaposoHF.Adaptationofthedietary guidelinesfor Brazilianpopulationandtheapplicationofthe healthyeatingindexforpreschoolagedbetween2and6years. NutrireRevSocBrasAlimentNutr.2006;31:75---90.
14.Assunc¸ãoMC,SantosIS,BarrosAJ,GiganteDP,VictoraCG.Flour fortificationwithironhasnoimpactonanaemiainurban Brazil-ianchildren.PublicHealthNutr.2012;15:1796---801.
15.SociedadeBrasileiradePediatria;DepartamentodeNutrologia. Manualdeorientac¸ãoparaaalimentac¸ãodolactente,do pré-escolar,doescolar,doadolescenteenaescola.3rded.Riode Janeiro:SBP;2012.
16.BarbosaRM,CarvalhoCG,FrancoVC,Salles-CostaR,SoaresEA. Avaliac¸ãodoconsumoalimentardecrianc¸aspertencentesauma crechefilantrópicanaIlhadePaquetá,RiodeJaneiro,Brasil. RevBrasSaudeMaterInfant.2006;6:127---34.
17.CuppariL.Guiadenutric¸ão:nutric¸ãoclínicanoadulto.2nded. Barueri:Manole;2005.
18.CagliariMP,PaivaAA,QueirozD,AraujoES.Foodconsumption, anthropometryandmorbidityinpreschoolchildrenfrompublic daycarecentersCampina Grande,Paraíba. Nutrire:Rev Soc BrasAlimNutr.2009;34:29---43.
19.ValenteTB,HecktheuerLH,BrasilCC.Foodhabitsand socio-economicconditionsofpreschoolchildrenbelongingtoaday carecenterinRioGrandedoSul,Brazil.BrazJFoodTechnol. 2010;3:71---4.
20.Castro TG, Novaes JF, Silva MR, et al. Characteristics of dietaryintake,socioeconomicenvironmentandnutritional sta-tusofpreschoolersatpublickindergartens.RevNutr.2006;18: 321---30.
21.CruzGF,SantosRS,CarvalhoCM,MoitaGC.Dieteticevaluation inmunicipalday-carecentersinTeresina,Piaú,Brazil.RevNutr. 2001;14:21---32.
22.BarbosaRM,CrocciaC,CarvalhoCG,FrancoVC,Salles-Costa R, Soares EA. Food intake bychildren based on the Brazil-ianfoodguidepyramidforyoungchildren.RevNutr.2005;18: 633---41.
23.AbreuM.Alimentac¸ãoEscolar:combateàdesnutric¸ãoeo fra-cassoescolaroudireitodacrianc¸aeatopedagógico?EmAberto. 1995;15:21---32.