Apolipoprotein B and angiotensin-converting enzyme
polymorphisms and aerobic interval training:
randomized controlled trial in coronary artery
disease patients
N.Y. Tamburus
1, R. Verlengia
2, V.C. Kunz
1,3, M.C. César
2and E. Silva
1 1Núcleo de Pesquisa em Exercício Físico, Departamento de Fisioterapia, Universidade Federal de São Carlos, São Carlos, SP, Brasil 2Laboratório de Performance Humana, Faculdade de Ciências da Saúde, Universidade Metodista de Piracicaba, Piracicaba, SP, Brasil 3Centro Universitário Adventista de São Paulo, Engenheiro Coelho, SP, BrasilAbstract
Physical training has been strongly recommended as a non-pharmacological treatment for coronary artery disease (CAD). Genetic polymorphisms have been studied to understand the biological variability in response to exercise among individuals. This study aimed to verify the possible influence of apolipoprotein B (ApoB: rs1042031 and rs693) and angiotensin-converting enzyme (ACE-ID: rs1799752) genotypes on the lipid profile and functional aerobic capacity, respectively, after an aerobic interval training (AIT) program in patients with CAD and/or cardiovascular risk factors. Sixty-six men were randomized and assigned to trained group (n=32) or control group (n=34). Cardiopulmonary exercise test was performed to determine the ventilatory anaerobic threshold (VAT) from cardiorespiratory variables. The AIT program, at an intensity equivalent to %VAT (70–110%), was conducted three times a week for 16 weeks.ApoBgene polymorphisms (–12669C4T (rs1042031) and
–7673G4A (rs693)) were identified by real-time polymerase chain reaction (PCR). I/D polymorphism in the ACE gene
(rs1799752) was identified through PCR and fragment size analysis. After 16 weeks, low-density lipoprotein (LDL) levels increased in the trained and control groups with the GA+AA genotype (–7673G4A) of theApoBgene. Trained groups with
ACE-IIandACE-IDgenotypes presented an increase in oxygen consumption (VO2VAT) and power output after the AIT program.
The presence of the ACE I-allele was associated with increased aerobic functional capacity after the AIT program. Increased LDL levels were observed over time in patients with the –7673G4A polymorphism of the ApoB gene. Trial Registration
Information: ClinicalTrials.gov: NCT02313831
Key words: Physical training; Lipids; Apolipoprotein B polymorphism; Angiotensin-converting enzyme polymorphism; Aerobic capacity
Introduction
Coronary artery disease (CAD) is a multifactorial disease influenced by a wide range of modifiable risk factors (dyslipidemia, hypertension, obesity, diabetes, and physical inactivity) as well as non-modifiable factors (age and genetic profile) (1). Exercise practice has been strongly recom-mended for the management of CAD and control of modi-fiable risk factors in the context of cardiac rehabilitation, given the benefits on the cardiovascular system and con-trol of modifiable risk factors (2). Randomized controlled trials and meta-analyses have shown that aerobic interval training (AIT) is recommended for this population due to its effectiveness in improving aerobic functional capacity compared to continuous and moderate physical training (3–5). However, changes in serum lipids are small and
have a limited effect on low-density lipoproteins (LDL), putting to question the effects of exercise training on lipid abnormalities (6,7). This inter-individual variability in adap-tive responses and change in the lipid profile with physical training may be associated with genetic polymorphisms, which may alter cardiovascular and metabolic adaptations to exercise. Consequently, personalized medicine and inter-individual differences in response to an exercise training program have received increased scientific interest.
Among several single nucleotide polymorphisms (SNP), two genes that might play a role in regulating the physical function and indirectly impact the lipid profile are the angiotensin-converting enzyme (ACE) and apolipoprotein B (ApoB) polymorphisms, respectively. Particularly, LDLs are
Correspondence: N.Y. Tamburus:<[email protected]> Received October 18, 2017 | Accepted March 9, 2018
atherogenic and their levels depend on genetics and life-style factors such as diet and exercise (8). When expressed, theApoBgene has been linked to concentrations of serum lipids in CAD. SNP rs1042031 (–12669C4T– nucleotide substitution of cytosine for thymine), located at exon 29 of theApoBgene, and SNP rs693 (–7376G4A–nucleotide substitution of guanine for adenine), located at exon 26, have an additive effect on total cholesterol, apoliprotein B, triglycerides, and LDL levels in different populations (9,10). TheACEgene is expressed in many tissues, such as in skeletal muscle and cardiovascular system.ACEinsertion/ deletion (I/D) of 287 base pairs in intron 16 - rs1799752 polymorphism has been associated with improvements in performance and exercise duration in different populations (11–14). The presence of the I-allele has resulted in lower ACE activity in blood serum and a reduced expression of the
ACEgene transcript and capacity for angiotensin II produc-tion (15). Subjects carrying the D allele have approximately 30% (ACE I/D) and 60% (ACE-DD) higher serum and tissue ACE activity, and more serum angiotensin I is converted via ACE into angiotensin II in relation to subjects with the ACE-II genotype (16). Thefindings highlight the important role of the
ACEI- allele in the improvement of aerobic performance after a physical training program (11,14,17). Meanwhile, theACE
D-allele has been associated with increased muscle strength (13,14,18) and anaerobic performance (12).
In this context, it was hypothesized that the significant changes in the lipid profile are related to polymorphisms of theApoBgene (rs1042031 and rs693), and the improve-ment of the aerobic functional capacity is associated with theACEI-allele in patients with CAD and/or cardiovascular risk factors submitted to the AIT program. Therefore, the aim of this study was to verify the possible influence of
ApoBandACEgenotypes on the lipid profile and functional aerobic capacity, respectively, after the AIT program in patients with CAD and/or cardiovascular risk factors.
Material and Methods
Study design and participants
The present study was a randomized controlled clinical trial conducted between February 2011 and May 2014 at the Federal University of São Paulo and Methodist University of Piracicaba, São Paulo, Brazil.
A sample of 149 male patients was recruited at the Hemodynamics Center of the local Hospital. Sixty-eight patients (34 patients with stable CAD and 34 without CAD), originally from the southeastern region of Brazil, were considered eligible for this study.
All patients met three or more inclusion criteria, such as: myocardial infarction (MI) in the previous 6 months, percutaneous coronary intervention and coronary artery bypass graft in the previous 3 months, obesity (body mass index430 kg/m2), sedentary lifestyle according to the
Inter-national Physical Activity Questionnaire version 6, hyper-tension, diabetes mellitus (type 2–non-users of insulin),
and dyslipidemia. The exclusion criteria consisted of severe cardiac arrhythmias, chronic obstructive pulmonary dis-ease, unstable angina, osteomuscular disorders, diabetes mellitus (insulin users), renal failure, sequelae associated with stroke, chest pain, and incapability to perform the cardiopulmonary exercise test (CPET) until the ventilatory anaerobic threshold (VAT).
Patients were randomly assigned into trained (n=34) or control group (n=34). Randomization sequence with a 1:1 allocation ratio was performed by an independent researcher who was not involved in the recruitment of partici-pants. Allocation codes were concealed in sequentially numbered, sealed, opaque envelopes by the same investi-gator who created the randomization sequence.
All participants signed a written consent form prior to participating in the study, which was approved by the Ethics Committee of the Universidade Metodista de Piracicaba, Brazil (Protocol 04/09). The study was registered on clinical trials.gov with the identification code NCT02313831. The authors confirm that all ongoing and related trials for this intervention are registered.
Measurements
Measurements were made at baseline and after 16 weeks of treatment. Prior to the start of the AIT program, patients were required to attend the laboratory on two occasions. The first visit included height and body mass assess-ments. In this visit, all subjects were familiarized with the equipment and experimental protocol to be used to reduce anxiety. Subjects were instructed to avoid the use of stimu-lants (coffee, tea, soft drinks) and alcoholic beverages 24 h prior to the tests to avoid exhaustion. The second visit included venous blood sample collection. All partici-pants were then interviewed and examined before submaximal CPET to check health status and to confirm compliance with previously given instructions.
The assessments described above were collected prior to and 48 h after the last day of the AIT program. Controls were retested 16 weeks after the completion of baseline testing.
Lipid profile
After an overnight 12-h fasting period, venous blood samples were collected to analyze the following parameters: total cholesterol (using the autoanalyzer method), high- and low-density lipoprotein (HDL and LDL) cholesterol (using enzymatic colorimetry), triglycerides (using automated enzy-matic methods), and apolipoprotein A1 and B (nephelometry).
Cardiopulmonary exercise test (CPET)
The test started with 1 min of baseline recording followed by 4 min of unloaded warm-up. Intensity was individually increased according to formula proposed by Wasserman et al. (19) (power output (W) = [(height–age)
20]–[150+(6 body mass)] / 100). For all patients, CPET was interrupted when submaximal heart rate (HR), obtained by Karvonen’s formula (85% of maximum HR, attenuated by beta-blocker dose), was reached or sur-passed the VAT level visually determined. Ventilatory and metabolic measurements were obtained on a breath-by-breath basis using a metabolic analyzer (CPX-D, Medical Graphics, USA). Electrocardiograms and HR were con-tinuously recorded throughout the test using a 12-lead electrocardiogram (Welch Allyn CardioPerfect Workstation, USA), and blood pressure (BP) was measured manually.
VAT was determined from the loss of parallelism between oxygen uptake (VO2) and carbon dioxide production (VCO2)
by three properly trained observers, as previously described by Zamunér et al. (20) and Higa et al. (21).
Genotyping
Genomic DNA was isolated from EDTA-treated peripheral blood leukocyte cells using Illustra blood genomicPrep Mini Spin kit (GE HealthCare, USA) according to the manu-facturer’s instructions. Polymorphisms of theApoBgene were determined by real-time PCR (ABI 7500 fast, Applied Biosystems, USA), using the TaqMan Universal PCR Master Mix (Applied Biosystems, USA), genomic DNA template (20 ng), and specific TaqMan probe assay [APOB: rs104 2031 (–12669C4T; assay ID: C___7615381_20) and rs693 (–7673G4A; assay ID: C___7615420_20)]. Each probe was labeled with a differentfluorophore (Vic or Fam, Figure S1). Vic dye is linked to the 50-end of allele 1 probe
(reporter) indicating homozygosity for alleles‘‘C’’in rs104 2031 (–12669C4T) and‘‘A’’in rs693 (–7673G4A). Fam dye is linked to the allele 2 probe indicating homozygosity for alleles ‘‘T’’ in rs1042031 (–12669C4T) and ‘‘G’’ in rs693 (–7673G4A). The presence of both fluorescent signals indicated heterozygosity. The presence of a non-fluorescent quencher at the 30-end of the probe allows for
the detection of the dyefluorescence reporter with greater sensitivity.
TheACE(rs1799752) polymorphism was determined by PCR and fragment analysis as previously described by Verlengia et al. (22). PCR primer sequences were: sense 50-CTG GAG ACC ACT CCC ATC CTT TCT-30and
anti-sense 50-GAT GTG GCC ATC ACA TTC AGA T-30. PCR
assays were carried out in a thermocycler (T-Gradient, Whatman Biometra, Germany) and ACE polymorphism fragments were visualized using 1.5% agarose gel after electrophoresis. The second PCR assay was performed in samples initially classified as DD in order to avoid mis-classification of ID samples. In this step, sequences of PCR primers were: sense 50-CTG GAG ACC ACT CCC
ATC CTT TCT-30and anti-sense 50- GAT GTG GCC ATC
ACA TTC GTC AGAT-30. To determine reproducibility and
quality control, 10% of samples were randomly re-evaluated. All genotyping was performed by the same researcher who was blinded to subject data.
Aerobic interval training program
The AIT program was individualized and administered three times per week (on alternate days) for 16 weeks. Exercise intensities were considered moderate and pre-scribed according to VAT (70, 80, 100, and 110% of power output reached at VAT) (23,24). Each exercise session lasted about 60 min and comprised the following steps: 1) Warm-up (10 min): stretching and low-intensity exercises (walking); 2) Exercise protocol (30–40 min): patients performed exercise training on a stationary cycle ergom-eter, and this period was divided into 6 steps. Step 1: 5 min at moderate intensity with the aim of reaching 80% of power output reached at VAT; Step 2 and 4: 5 min progressing up to 10 min at moderate intensity with the aim of reaching 100% of power output reached at VAT; Step 3 and 5: 5 min at moderate intensity with the aim of reaching 110% of power output reached at VAT; Step 6: 5 min at moderate intensity with the aim of reaching 70% of power output reached at VAT. The Borg CR-10 scale was used to measure the perceived exertion rate after each step. 3) Cool-down (10 min): consisted of stretching and respiratory exercises to allow BP and HR to return to near-basal values. During exercise training sessions, BP was measured by the auscultatory method and HR was monitored with intermittent verification by HR monitors (Polar Team System, Finland) to ensure that patients exercised at the target training intensity.
Subjects assigned to the control group were told to continue their daily life activities. They were contacted by telephone every month to check if there had been changes in medication and if new cardiac events had occurred. All subjects were instructed to maintain their usual diet without standardized caloric restriction.
Exercise intensity was adjusted on a monthly basis, according to methodology proposed by Sirol et al. (23) and Pithon et al. (24) by determination of the anaerobic threshold from the HR response.
Statistical analysis
After genotype analyses, patients were divided into three groups according to genotype: –12669C4T (rs1042031) (CC, CT or TT group); 7376G4A (rs693) (CC, GA or AA
group); I/D (rs1799752) (II, ID, and DD). Allele frequencies and genotype distributions were determined by directly counting the alleles, and a Hardy-Weinberg equilibrium was verified using the chi-squared test with Arlequin v3.11 software, which applies the expectation-maximization algo-rithm (25).t-tests were used to compare age and hemo-dynamic variables and the chi-squared test was applied for categorical variables. A two-way ANOVA (group
anthropometric, lipid profile, and cardiorespiratory variables. Three-way ANOVA (group time genotype) was used to compare anthropometric and hemodynamic variables at rest, as well as metabolic and cardiorespiratory variables. When significant interaction was observed, the main effects were not considered and multiple comparisons were per-formed. The relationship between cardiorespiratory vari-ables andACEgenotypes was analyzed using the Pearson correlation coefficient. Correlation coefficients were inter-preted as follows: r=0.4 to 0.5 weak correlation; r=0.6 to 0.7 moderate correlation; rX0.8 strong correlation).
Results
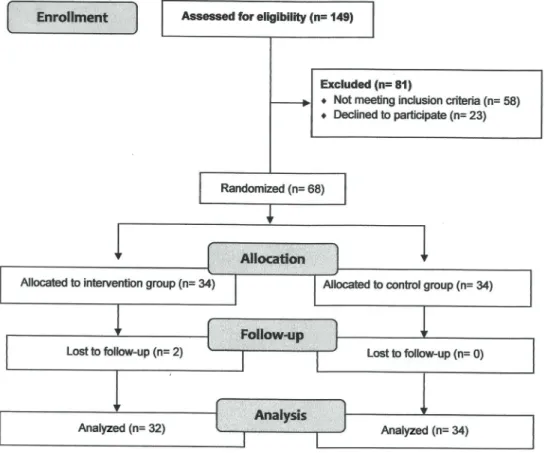
Figure 1 shows the study flow diagram. Initially, 149 patients were interviewed. Of these, 81 patients did not meet the inclusion criteria or refused to participate, and after randomization, two patients dropped out of the intervention program. Thus, 66 patients completed all study stages.
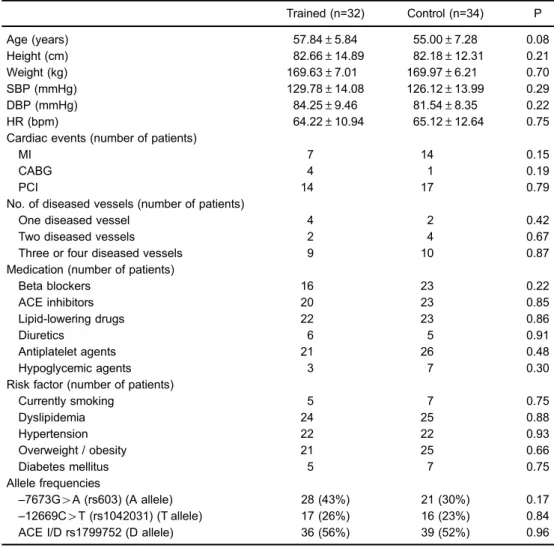
Table 1 presents age, anthropometric, and hemody-namic variables, cardiac events, number of diseased vessels, medications, risk factors, and allele frequencies of study groups. There were no differences between groups for any variables under study (P40.05). The dosage of
medi-cations remained the same during the study. The observed
genotype frequencies were in agreement with the Hardy-Weinberg equilibrium in both the trained group (–12669C4T w2=0.05, P=0.81;–7376G4Aw2=0.008, P=0.92;ACE I/D
w2=2.33, P=0.12) and control group (–1266C4T w2= 0.003, P=0.95;–7376G4Aw2=0.003, P=0.84;ACE I/Dw2= 0.0005, P=0.98). The genotypes and allele frequencies of
ApoB and ACEgenes did not differ between trained and control groups (P40.05).
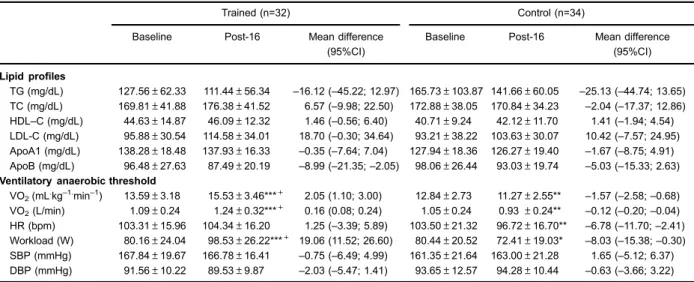
Table 2 shows lipid profile and cardiorespiratory variables obtained at VAT. No significant group time interaction was observed. However, after 16 weeks, apolipoprotein B levels decreased (main time effect; F1.62=5.20; P=0.02), while LDL levels increased (main time effect; F1.62=6.98; P=0.01) in both groups.
Cardiorespiratory variables obtained at the VAT showed significant group time interaction for VO2VAT (F1.62=
30.21, Po0.001), workload (F1.62=25.43, Po0.001), and
HRVAT (F1.62=6.40, P=0.01). Planned pairwise
com-parisons revealed a significant increase in workload and VO2VAT for the trained group after the AIT (Po0.05).
On the other hand, control group showed a significant reduction of VO2VAT, workload, and HRVAT (Po0.05).
In addition, the trained group showed higher VO2VAT
and workload compared to control group after the AIT (Po0.05).
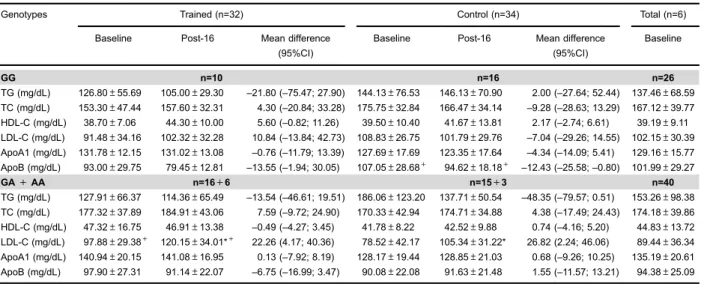
Lipid profiles at baseline and after 16 weeks according toApoBpolymorphisms are presented in Table 3 (12669C4T
-rs1042031) and Table 4 (–7673G4A - rs693). Considering the small number of patients with TT genotype (–12669C4T), these patients were combined with CT genotype (–12669C4T) (co-dominant model) and AA genotype (–7673G4A) was com-bined with GA genotype (–7673G4A) (dominant model).
No significant group genotype time interactions were observed for any of the study variables for 12669C4T
of the ApoB gene (P40.05) (Table 3). However, after 16
weeks, LDL levels significantly increased (main time effect; F1.62=6.68, P=0.01) in both control and trained groups and
in CC and CT+TT genotypes. Moreover, triglyceride levels were higher in the control group than in the trained group
in both genotypes (CC and CT+TT) at baseline and after 16 weeks (main group effect; F1.62=4.54, P=0.01).
Regarding the polymorphism–7673G4A of theApoB gene (Table 4), there was significant genotype time interaction for the LDL levels (F1.62=4.25; P=0.04). After
16 weeks, control and trained groups with GA+AA geno-type presented significantly increased LDL levels (Po0.05).
Significant group genotype interaction for LDL (F1.62=
4.05; P=0.04) and apolipoprotein B levels (F1.62=4.00;
P=0.04) was also observed. Both at baseline and after 16 weeks, LDL levels were higher in the trained group com-pared to the control group with GA+AA genotype (Po0.05),
whereas apolipoprotein B levels were lower in the trained group compared to the control group with GG genotype (Po0.05).
Table 1. Anthropometric and hemodynamic variables, cardiac events, number of diseased vessels, medications, risk factors, and allele frequencies of groups studied at baseline.
Trained (n=32) Control (n=34) P
Age (years) 57.84±5.84 55.00±7.28 0.08
Height (cm) 82.66±14.89 82.18±12.31 0.21
Weight (kg) 169.63±7.01 169.97±6.21 0.70
SBP (mmHg) 129.78±14.08 126.12±13.99 0.29
DBP (mmHg) 84.25±9.46 81.54±8.35 0.22
HR (bpm) 64.22±10.94 65.12±12.64 0.75
Cardiac events (number of patients)
MI 7 14 0.15
CABG 4 1 0.19
PCI 14 17 0.79
No. of diseased vessels (number of patients)
One diseased vessel 4 2 0.42
Two diseased vessels 2 4 0.67
Three or four diseased vessels 9 10 0.87
Medication (number of patients)
Beta blockers 16 23 0.22
ACE inhibitors 20 23 0.85
Lipid-lowering drugs 22 23 0.86
Diuretics 6 5 0.91
Antiplatelet agents 21 26 0.48
Hypoglycemic agents 3 7 0.30
Risk factor (number of patients)
Currently smoking 5 7 0.75
Dyslipidemia 24 25 0.88
Hypertension 22 22 0.93
Overweight / obesity 21 25 0.66
Diabetes mellitus 5 7 0.75
Allele frequencies
–7673G4A (rs603) (A allele) 28 (43%) 21 (30%) 0.17
–12669C4T (rs1042031) (T allele) 17 (26%) 16 (23%) 0.84
ACE I/D rs1799752 (D allele) 36 (56%) 39 (52%) 0.96
Furthermore, at baseline and after 16 weeks, triglycer-ide levels (main group effect; F1.62=4:53, P=0.03) were
higher in the control group than in the trained group, while apolipoprotein A1 levels (main group effect; F1.62=4.88,
P=0.03) were higher in the trained group compared to the control in both genotypes (GG and GA+AA).
Cardiorespiratory variables obtained at VAT, baseline, and after 16 weeks, according toACE I/Dpolymorphisms are presented in Table 5. There was a significant group
genotypetime interaction for VO2VAT (F1.62=4.387, P=
0.01), power output (F1.62=6.801, P=0.002), and HRVAT
(F1.62=3.890, P=0.02). After the AIT program, VO2VATand
Table 2.Lipid profile and cardiorespiratory variables of the groups studied at baseline and after 16 weeks.
Trained (n=32) Control (n=34)
Baseline Post-16 Mean difference
(95%CI)
Baseline Post-16 Mean difference (95%CI)
Lipid profiles
TG (mg/dL) 127.56±62.33 111.44±56.34 –16.12 (–45.22; 12.97) 165.73±103.87 141.66±60.05 –25.13 (–44.74; 13.65) TC (mg/dL) 169.81±41.88 176.38±41.52 6.57 (–9.98; 22.50) 172.88±38.05 170.84±34.23 –2.04 (–17.37; 12.86) HDL–C (mg/dL) 44.63±14.87 46.09±12.32 1.46 (–0.56; 6.40) 40.71±9.24 42.12±11.70 1.41 (–1.94; 4.54) LDL-C (mg/dL) 95.88±30.54 114.58±34.01 18.70 (–0.30; 34.64) 93.21±38.22 103.63±30.07 10.42 (–7.57; 24.95)
ApoA1 (mg/dL) 138.28±18.48 137.93±16.33 –0.35 (–7.64; 7.04) 127.94±18.36 126.27±19.40 –1.67 (–8.75; 4.91)
ApoB (mg/dL) 96.48±27.63 87.49±20.19 –8.99 (–21.35;–2.05) 98.06±26.44 93.03±19.74 –5.03 (–15.33; 2.63)
Ventilatory anaerobic threshold
VO2(mL.kg–1.min–1) 13.59±3.18 15.53±3.46***+ 2.05 (1.10; 3.00) 12.84±2.73 11.27±2.55** –1.57 (–2.58;–0.68) VO2(L/min) 1.09±0.24 1.24±0.32***+ 0.16 (0.08; 0.24) 1.05±0.24 0.93±0.24** –0.12 (–0.20;–0.04) HR (bpm) 103.31±15.96 104.34±16.20 1.25 (–3.39; 5.89) 103.50±21.32 96.72±16.70** –6.78 (–11.70;–2.41)
Workload (W) 80.16±24.04 98.53±26.22***+ 19.06 (11.52; 26.60) 80.44±20.52 72.41±19.03* –8.03 (–15.38;–0.30)
SBP (mmHg) 167.84±19.67 166.78±16.41 –0.75 (–6.49; 4.99) 161.35±21.64 163.00±21.28 1.65 (–5.12; 6.37) DBP (mmHg) 91.56±10.22 89.53±9.87 –2.03 (–5.47; 1.41) 93.65±12.57 94.28±10.44 –0.63 (–3.66; 3.22)
Data are reported as means±SD (Baseline and Post-16); Mean difference (Post-16 values minus Baseline values) with 95% of confidence interval (CI); TG: triglycerides; TC: total cholesterol; HDL-C: high-density lipoprotein cholesterol; LDL-C: low-density lipoprotein cholesterol; ApoA1: apolipoprotein A1; ApoB: apolipoprotein B; VO2: oxygen consumption; VCO2: carbon dioxide production;
W: watts; HR: heart rate; bpm: beats per minute; SBP: systolic blood pressure; DBP: diastolic blood pressure. *Po0.05, Baselinevs
Post-16; **Po0.01, BaselinevsPost-16; ***Po0.001, BaselinevsPost-16;+Po0.05, Baseline (trained)vsBaseline (control); Post-16
(trained)vsPost-16 (control) (two-way ANOVA).
Table 3.Baseline and post-16 weeks lipid profile of trained and control groups according to–12669C4T (rs1042031) in theApoBgene.
Trained (n=32) Control (n=34) Total (n=66)
Baseline Post-16 Mean difference (95%CI)
Baseline Post-16 Mean difference (95%CI)
Baseline
CC n=17 n=19 n=36
TG (mg/dL) 111.12±66.94 105.18±60.24 –5.97 (–32.21; 44.09) 166.28±109.54 153.59±72.42 –12.69 (–56.80; 19.50) 139.49±94.29 TC (mg/dL) 172.82±46.11 188.12±47.25 15.29 (–4.02; 34.61) 175.06±40.50 178.06±28.91 3.00 (–17.96; 20.67) 175.17±42.68 HDL-C (mg/dL) 47.35±18.25 47.29±14.36 –0.059 (–4.38; 4.50) 40.56±9.10 41.93±10.94 1.37 (–3.51; 5.37) 43.92±14.29 LDL-C (mg/dL) 95.82±33.48 123.76±41.30 27.93 (6.92; 48.94) 96.63±38.39 107.11±22.64 10.48 (–10.27; 31.74) 96.10±36.08 ApoA1 (mg/dL) 146.53±17.24 145.69±14.91
–0.84 (–9.79; 8.11) 125.78±18.01 129.44±21.31 3.66 (–6.28; 11.62) 135.53±20.12 ApoB (mg/dL) 94.11±27.81 90.10±20.51
–4.00 (–15.89; 7.88) 95.20±22.30 94.32±19.35 –0.88 (–14.54; 9.23) 95.07±24.52
CT+TT n=13+2 n=13+2 n=30
TG (mg/dL) 146.20±52.73 118.53±52.74 –27.99 (–69.68; 12.95) 165.07±100.44 131.71±39.25 –33.36 (–50.55; 36.70) 155.63±79.40
TC (mg/dL) 166.40±37.81 163.07±30.16 –3.33 (–23.89; 17.32) 165.33±35.25 164.14±39.82 –1.19 (–28.70; 15.47) 166.87±35.92
HDL-C (mg/dL) 41.53±9.45 44.73±9.84 3.20 (–1.53; 7.93) 40.53±9.92 42.93±13.16 2.4 (–3.46; 6.69) 41.03±9.53
LDL-C (mg/dL) 95.95±28.00 104.17±19.85 8.22 (–14.13; 30.58) 89.11±38.95 100.16±39.11 11.05 (–18.67; 29.36) 92.53±33.51
ApoA1 (mg/dL) 126.58±15.86 129.15±13.44 2.56 (–6.96; 12.10) 130.80±19.61 123.09±17.55 –7.71 (–18.17; 2.31) 128.69±17.65
ApoB (mg/dL) 96.53±29.26 84.53±20.12 –12.00 (–24.66; 0.65) 100.77±31.89 92.54±21.18 –8.23 (–24.04; 2.79) 98.65±30.15
power output significantly increased in the trained group withACEII and ID genotypes, while for the trained group with ACE DD genotype, variables did not differ signifi -cantly after AIT (P40.05). The control group withACEII
and DD genotypes showed a significant decrease in VO2VAT
and HRVAT(Po0.05). Furthermore, the trained group with
ACEII genotype showed greater increase in VO2VATand
power output in response to AIT, compared to the other genotypes (Po0.05).
In the trained group, changes in VO2(r=–0.36; P=0.03: Figure 2A) and power output (r=–0.52, P=0.003: Figure 2B) at VAT were correlated with theACE I/Dpolymorphism.
Discussion
The present study showed that trained and control groups with polymorphism–7376G4A (rs693) of theApoB gene presented increased LDL-C levels after 16 weeks. After the AIT program, the increased functional aerobic capacity in the trained group was associated with theACE
I-allele (rs1799752).
To our knowledge, this was the first study that pro-vided evidence of changes in the lipid profile in relation to polymorphisms–7376G4A and–12669C4T of theApoB gene in response to an AIT program in patients with CAD and/or risk factors. However, serum lipid response was significantly different only in the presence of polymorphism
–7376G4A in both trained and control groups. Exercise training promotes reduction in LDL levels, however, in this study LDL levels increased in trained and control groups with the GA+AA genotype after 16 weeks. Although we
found no rational explanation for this result, it is possible that the lack of dietary intake control may have impaired the detection of exercise-induced changes in the lipid profile. To overcome these practical difficulties, measure-ments of the main apolipoprotein moieties of LDL, i.e. apo-lipoprotein B, have been proposed to serve as alternative surrogate markers. The molar amount of apolipoprotein B in whole serum has the desirable property of being an estimate of total LDL-C particles, since there is one apo-lipoprotein B molecule per LDL particle (26). In this study, changes in apolipoprotein B levels were lower and LDL levels were higher in trained and control group with GA +AA genotype. In this case, monitoring LDL-C to quantify improvements in the lipid profile should be replaced by apolipoprotein B when exercise is used for cardiovascular risk reduction.
The polymorphism –7376G4A of the ApoB gene is known to be a silent mutation. Thus, a change does not alter the amino acid sequence of apolipoprotein B. Con-sidering that this polymorphism cannot directly compro-mise lipid metabolism, Chiodini et al. (10) and Boekholdt et al. (27) suggested that it may be in linkage disequilibrium with other variants in theApoBgene itself or nearby, affect-ing the LDL-receptor-bindaffect-ing region of apolipoprotein B. This linkage disequilibrium has been reported by Machado et al. (9) between two ApoB polymorphisms [(Ins/Del – Insertion/Deletion (rs17240441) andXbaI–X+/X- (rs693)] in a Brazilian population. These authors observed that haplo-types formed by X+ and Del alleles (X+Del haplotype) were associated with significantly higher serum levels of total cholesterol, triglycerides, and LDL-cholesterol. In this
Table 4.Baseline and post-16 weeks lipid profile of trained and control groups according to–7376G4A (rs693) genotypes of theApoB
gene.
Genotypes Trained (n=32) Control (n=34) Total (n=6)
Baseline Post-16 Mean difference
(95%CI)
Baseline Post-16 Mean difference
(95%CI)
Baseline
GG n=10 n=16 n=26
TG (mg/dL) 126.80±55.69 105.00±29.30 –21.80 (–75.47; 27.90) 144.13±76.53 146.13±70.90 2.00 (–27.64; 52.44) 137.46±68.59
TC (mg/dL) 153.30±47.44 157.60±32.31 4.30 (–20.84; 33.28) 175.75±32.84 166.47±34.14 –9.28 (–28.63; 13.29) 167.12±39.77
HDL-C (mg/dL) 38.70±7.06 44.30±10.00 5.60 (–0.82; 11.26) 39.50±10.40 41.67±13.81 2.17 (–2.74; 6.61) 39.19±9.11
LDL-C (mg/dL) 91.48±34.16 102.32±32.28 10.84 (–13.84; 42.73) 108.83±26.75 101.79±29.76 –7.04 (–29.26; 14.55) 102.15±30.39
ApoA1 (mg/dL) 131.78±12.15 131.02±13.08 –0.76 (–11.79; 13.39) 127.69±17.69 123.35±17.64 –4.34 (–14.09; 5.41) 129.16±15.77
ApoB (mg/dL) 93.00±29.75 79.45±12.81 –13.55 (–1.94; 30.05) 107.05±28.68+ 94.62±18.18+ –12.43 (–25.58;–0.80) 101.99±29.27
GA+AA n=16+6 n=15+3 n=40
TG (mg/dL) 127.91±66.37 114.36±65.49 –13.54 (–46.61; 19.51) 186.06±123.20 137.71±50.54 –48.35 (–79.57; 0.51) 153.26±98.38
TC (mg/dL) 177.32±37.89 184.91±43.06 7.59 (–9.72; 24.90) 170.33±42.94 174.71±34.88 4.38 (–17.49; 24.43) 174.18±39.86
HDL-C (mg/dL) 47.32±16.75 46.91±13.38 –0.49 (–4.27; 3.45) 41.78±8.22 42.52±9.88 0.74 (–4.16; 5.20) 44.83±13.72
LDL-C (mg/dL) 97.88±29.38+ 120.15±34.01*+ 22.26 (4.17; 40.36) 78.52±42.17 105.34±31.22* 26.82 (2.24; 46.06) 89.44±36.34
ApoA1 (mg/dL) 140.94±20.15 141.08±16.95 0.13 (–7.92; 8.19) 128.17±19.44 128.85±21.03 0.68 (–9.26; 10.25) 135.19±20.61
ApoB (mg/dL) 97.90±27.31 91.14±22.07 –6.75 (–16.99; 3.47) 90.08±22.08 91.63±21.48 1.55 (–11.57; 13.21) 94.38±25.09
Data are reported as means±SD (Baseline and Post-16). Mean difference (Post-16 values minus Baseline) with 95% confidence interval (CI); TG: triglycerides; CT: total cholesterol; HDL-C: high-density lipoprotein cholesterol; LDL-C: low-density lipoprotein cholesterol; ApoA1: apolipoprotein A1; ApoB: apolipoprotein B. *Po0.05, baselinevsPost-16;+Po0.05, baseline (trained)vsbaseline
specific case, a single haplotype, X+Del may contribute to structural changes that occur in apolipoprotein B100 caused by this variation, compromising the interaction between apolipoproteins and LDL receptors, leading to the accumula-tion of LDL in circulaaccumula-tion (9,10,27,28).
In relation to the –12669C4T polymorphism, the exchange of cytosine by thymine leads to amino acid
sequence substitution, which may affect the tertiary struc-ture of apolipoprotein B and its interaction with LDL. Several studies have shown clear evidence of the asso-ciation between polymorphisms of the ApoB gene and changes in lipid profile, specifically with LDL (10,27,29,30). However, studies evaluating the functionality of structural domains of the apolipoprotein B100 protein highlighted
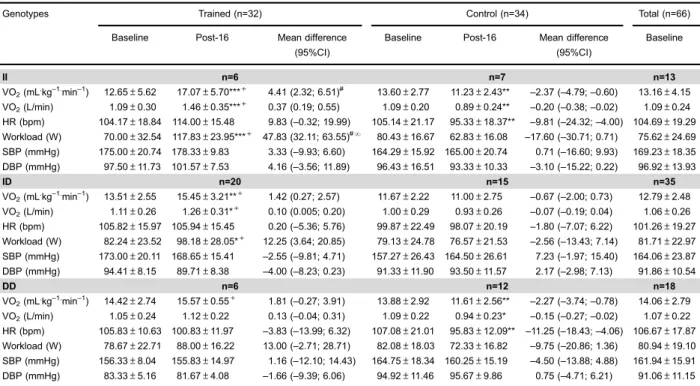
Table 5.Cardiorespiratory variables obtained at ventilatory anaerobic threshold in baseline and Post-16 weeks of trained and control groups according toACE I/D(rs1799752) genotypes.
Genotypes Trained (n=32) Control (n=34) Total (n=66)
Baseline Post-16 Mean difference
(95%CI)
Baseline Post-16 Mean difference
(95%CI)
Baseline
II n=6 n=7 n=13
VO2(mL.kg–1.min–1) 12.65±5.62 17.07±5.70***+ 4.41 (2.32; 6.51)# 13.60±2.77 11.23±2.43** –2.37 (–4.79;–0.60) 13.16±4.15
VO2(L/min) 1.09±0.30 1.46±0.35***+ 0.37 (0.19; 0.55) 1.09±0.20 0.89±0.24** –0.20 (–0.38;–0.02) 1.09±0.24
HR (bpm) 104.17±18.84 114.00±15.48 9.83 (–0.32; 19.99) 105.14±21.17 95.33±18.37** –9.81 (–24.32;–4.00) 104.69±19.29
Workload (W) 70.00±32.54 117.83±23.95***+ 47.83 (32.11; 63.55)#N
80.43±16.67 62.83±16.08 –17.60 (–30.71; 0.71) 75.62±24.69
SBP (mmHg) 175.00±20.74 178.33±9.83 3.33 (–9.93; 6.60) 164.29±15.92 165.00±20.74 0.71 (–16.60; 9.93) 169.23±18.35
DBP (mmHg) 97.50±11.73 101.57±7.53 4.16 (–3.56; 11.89) 96.43±16.51 93.33±10.33 –3.10 (–15.22; 0.22) 96.92±13.93
ID n=20 n=15 n=35
VO2(mL.kg–1.min–1) 13.51±2.55 15.45±3.21**+ 1.42 (0.27; 2.57) 11.67±2.22 11.00±2.75 –0.67 (–2.00; 0.73) 12.79±2.48
VO2(L/min) 1.11±0.26 1.26±0.31*+ 0.10 (0.005; 0.20) 1.00±0.29 0.93±0.26 –0.07 (–0.19; 0.04) 1.06±0.26
HR (bpm) 105.82±15.97 105.94±15.45 0.20 (–5.36; 5.76) 99.87±22.49 98.07±20.19 –1.80 (–7.07; 6.22) 101.26±19.27
Workload (W) 82.24±23.52 98.18±28.05*+ 12.25 (3.64; 20.85) 79.13±24.78 76.57±21.53 –2.56 (–13.43; 7.14) 81.71±22.97
SBP (mmHg) 173.00±20.11 168.65±15.41 –2.55 (–9.81; 4.71) 157.27±26.43 164.50±26.61 7.23 (–1.97; 15.40) 164.06±23.87
DBP (mmHg) 94.41±8.15 89.71±8.38 –4.00 (–8.23; 0.23) 91.33±11.90 93.50±11.57 2.17 (–2.98; 7.13) 91.86±10.54
DD n=6 n=12 n=18
VO2(mL.kg–1.min–1) 14.42±2.74 15.57±0.55+ 1.81 (–0.27; 3.91) 13.88±2.92 11.61±2.56** –2.27 (–3.74;–0.78) 14.06±2.79
VO2(L/min) 1.05±0.24 1.12±0.22 0.13 (–0.04; 0.31) 1.09±0.22 0.94±0.23* –0.15 (–0.27;–0.02) 1.07±0.22
HR (bpm) 105.83±10.63 100.83±11.97 –3.83 (–13.99; 6.32) 107.08±21.01 95.83±12.09** –11.25 (–18.43;–4.06) 106.67±17.87
Workload (W) 78.67±22.71 88.00±16.22 13.00 (–2.71; 28.71) 82.08±18.03 72.33±16.82 –9.75 (–20.86; 1.36) 80.94±19.10
SBP (mmHg) 156.33±8.04 155.83±14.97 1.16 (–12.10; 14.43) 164.75±18.34 160.25±15.19 –4.50 (–13.88; 4.88) 161.94±15.91
DBP (mmHg) 83.33±5.16 81.67±4.08 –1.66 (–9.39; 6.06) 94.92±11.46 95.67±9.86 0.75 (–4.71; 6.21) 91.06±11.15
Data are reported as means±SD (Baseline and Post-16). Mean difference (Post-16 values minus Baseline values) with 95% confidence interval (CI). ACE: angiotensin converting enzyme; I/D: insertion/deletion; VO2: oxygen consumption; VCO2: carbon dioxide production;
W: watts; HR: heart rate; bpm: beats per minute; SBP: systolic blood pressure; DBP: diastolic blood pressure. *Po0.05, Baselinevs
Post-16; **Po0.01, BaselinevsPost-16; ***Po0.001, BaselinevsPost-16;+Po0.05, Baseline (trained)vsBaseline (control); Post-16
(trained)vsPost-16 (control);#Po0.05, IIvsID genotypes;NPo0.05, IIvsID and DD genotypes (three-way ANOVA).
Figure 2.Change in oxygen uptake (VO2) (A) and power output (B) at the ventilatory anaerobic threshold according to
that this mutation occurs in amino acid 4154 or after the binding site, between amino acids 3130 and 3630, which potentially interacts with the LDL receptor (28–30). This fact would explain the absence of significant changes in LDL levels in this polymorphism.
This study showed that VO2VATand power output at
baseline were similar among I/D genotypes of the ACE
gene. After AIT, the increase in VO2VATand power output
were observed in the presence of the ACE I-allele. In addition, the trained group withACEII genotype showed greater adaptive responses, which was supported by the greater increase in VO2VATand power in the group with
ACEID genotype.
Previous studies involving healthy subjects have shown clear evidence that theACEI-allele is associated with better aerobic performance as well as with better response to aerobic training (12,13). However, in individ-uals with heart disease, studies are still controversial in relation to theACEI-allele, and changes in the VO2maxare
dependent on this allele (11,31). Moreover, these studies were based on the increase in VO2max, which for cardiac
patients is a difficult parameter to define maximum perfor-mance. In this study, aerobic functional capacity was evaluated from cardiorespiratory parameters obtained at VAT during the submaximal stress test. Therefore, our results showed that theACEI-allele can be an important modulator in the increase of VO2and power at VAT.
Considering thatACEis part of the renin-angiotensin system, which can be found in the cardiovascular system as well as in several other tissues, some physiological mechanisms have been suggested to explain the causal relationship in the greater adaptive response attributed to theACEI-allele. One of these mechanisms considers that a lower amount of circulating ACE may reduce bradykinin degradation and increase bioavailability of nitric oxide, thus improving the efficiency of mitochondrial respiration and adjusting the local regulation of the aerobic metabo-lism (11,32). Moreover, Zhang et al. (33) found that the presence of theACEI-allele may be associated with an increased percentage of type Ifibers in skeletal muscles, which allows for greater aerobic performance and improves mechanical and metabolic efficiency.
This study has some limitations that should be discussed. First, patients with CAD and/or cardiovascular risk factors were under treatment with beta-blockers and ACE inhibitors, which could affect circulating ACE levels. The same could
occur with patients treated with statins. Second, the sample size was relatively small to conduct a genetic study, which may require more statistical power to explore the real asso-ciation. However, this pilot study evaluated the possibility of continuing the study in the near future. Third, patients were randomized into trained and control groups, which makes an even distribution among polymorphisms difficult. Finally, the possibility that some other genetic factor associated with
ApoBvariants is responsible for differences in the lipid profile cannot be ruled out.
In conclusion, the presence of allele I of the ACE
gene was associated with increased aerobic functional capacity after the AIT program. Regarding the lipid profile, LDL levels increased after 16 weeks in patients with polymorphism–7673G4A of theApoBgene. Thus, these results provided a partial explanation for the variability of AIT adaptive responses in patients with CAD and/or cardiovascular risk factors.
This pilot study has demonstrated that the variability of the adaptive responses in the lipid profile and functional capacity with physical training may be attributed to genetic polymorphisms.ACEandApoBpolymorphisms are asso-ciated with this inter-individual variability. Although the mechanisms and hypotheses involved in the synthesis of structural proteins and enzymes are relatively clear, this is the first study that demonstrated evidence of changes in the lipid profile in relation to polymorphisms–7376G4A and–12669C4T of theApoBgene, as well as changes in functional capacity in relation to allele I of theACEgene. Thesefindings are important to identify response and no-response individuals submitted to cardiac rehabilitation.
Supplementary Material
Click here to view [pdf]
Acknowledgments
This research was supported by Conselho Nacional de Desenvolvimento Científico e Tecnológico (CNPq) (grant Nos. 483032/2012-0, 478601/2010-7, 308348/2009-5, and 131594/2011-7) and the Coordenac¸ão de Aperfeic¸
o-amento de Pessoal de Nível Superior (CAPES). Financial supporters had no participation in study design, data collection and analysis, decision to publish, or manuscript preparation.
References
1. Scheuner MT. Genetic evaluation for coronary artery disease. Genet Med2003; 5: 269–285, doi: 10.1097/01.GIM.0000079
364.98247.26.
2. Vanhees L, Rauch B, Piepoli M, van Buuren F, Takken T, Börjesson M, et al. Importance of characteristics and moda-lities of physical activity and exercise in the management of cardiovascular health in individuals with cardiovascular
disease (Part III).Eur J Prev Cardiol2012; 19: 1333–1356, doi: 10.1177/2047487312437063.
3. Cornish AK, Broadbent S, Cheema BS. Interval training for patients with coronary artery disease: a systematic review.Eur J Appl Physiol2011; 111: 579–589, doi: 10.1007/s00421-010-1682-5.
training in coronary artery disease patients: a systematic review and meta-analysis.Sports Med2014; 44: 687–700,
doi: 10.1007/s40279-014-0158-x.
5. Conraads VM, Pattyn N, De Maeyer C, Beckers PJ, Coeckelberghs E, Cornelissen VA, et al. Aerobic interval training and continuous training equally improve aerobic exercise capacity in patients with coronary artery disease: The SAINTEX-CAD study.Int J Cardiol2015; 179: 203–210, doi: 10.1016/j.ijcard.2014.10.155.
6. Tamburus NY, Kunz VC, Salviati MR, Castello Simões V, Catai AM, DA Silva E. Interval training based on ventilatory anaerobic threshold improves aerobic functional capacity and metabolic profile: a randomized controlled trial in coro-nary artery disease patients.Eur J Phys Rehabil Med2016; 52: 1–11.
7. Holme I, Høstmark AT, Anderssen SA. ApoB but not LDL-cholesterol is reduced by exercise training in over-weight healthy men. Results from the 1-year randomized Oslo Diet and Exercise Study.J Intern Med2007; 262: 235–
243, doi: 10.1111/j.1365-2796.2007.01806.x.
8. Manjunath CN, Rawal JR, Irani PM, Madhu K. Atherogenic dyslipidemia.Indian J Endocrinol Metab2013; 17: 969–976,
doi: 10.4103/2230-8210.122600.
9. Machado MO, Hirata MH, Bertolami MC, Hirata RD.ApoB gene haplotype is associated with lipid profile of higher risk for coronary heart disease in Caucasian Brazilian men. J Clin Lab Anal2001; 15: 19–24.
10. Chiodini BD, Barlera S, Franzosi MG, Beceiro VL, Introna M, Tognoni G.ApoBgene polymorphisms and coronary artery disease: a meta-analysis. Atherosclerosis2003; 167:355–
366, doi: 10.1016/S0021-9150(02)00425-2.
11. Defoor J, Vanhees L, Martens K, Matthijs G, Van Vlerken A, Zielinska D, et al. The CAREGENE study:ACEgene I/D polymorphism and effect of physical training on aerobic power in coronary artery disease.Heart2006; 92: 527–528,
doi: 10.1136/hrt.2004.054312.
12. Cam S, Colakoglu M, Colakoglu S, Sekuri C, Berdeli A.ACE I/D gene polymorphism and aerobic endurance develop-ment in response to training in a non-elite female cohort. J Sports Med Phys Fitnes. 2007; 47: 234–238.
13. Cerit M, Colakoglu M, Erdogan M, Berdeli A, Cam FS. Relationship between ACE genotype and short duration aerobic performance development.Eur J Appl Physiol2006; 98: 461–465, doi: 10.1007/s00421-006-0286-6.
14. Puthucheary Z, Skipworth JR, Rawal J, Loosemore M, Van Someren K, Montgomery HE. TheACEgene and human performance: 12 years on.Sports Med2011; 41: 433–448, doi: 10.2165/11588720-000000000-00000.
15. Vaughan D, Huber-Abel FA, Graber F, Hoppeler H, Flück M. The angiotensin converting enzyme insertion/deletion poly-morphism alters the response of muscle energy supply lines to exercise. Eur J Appl Physiol 2013; 113: 1719–1729,
doi: 10.1007/s00421-012-2583-6.
16. Danser AH, Batenburg WW, van den Meiracker AH, Danilov SM. ACE phenotyping as afirst step toward personalized medicine for ACE inhibitors. Why doesACEgenotyping not predict the therapeutic efficacy of ACE inhibition?Pharmacol Ther 2007; 113: 607–618, doi: 10.1016/j.pharmthera.2006.
12.001.
17. Montgomery H, Clarkson P, Barnard M, Bell J, Brynes A, Dollery C, et al. Angiotensin-converting-enzyme gene
insertion/deletion polymorphism and response to physical training.Lancet1999; 353: 541–545, doi:
10.1016/S0140-6736(98)07131-1.
18. Folland J, Leach B, Little T, Hawker K, Myerson S, Montgomery H, et al. Angiotensin-converting enzyme genotype affects the response of human skeletal muscle to functional overload. Exp Physiol 2000; 85: 575–579,
doi: 10.1111/j.1469-445X.2000.02057.x.
19. Wasserman K, Hansen JE, Sue D, Whipp BJ, Casaburi R. Principles of exercise testing and interpretation. 4th ed:
Williams and Wilkins, Philadelphia, 1999.
20. Zamunér AR, Catai AM, Martins LE, Sakabe DI, Da Silva E. Identification and agreement of first turn point by mathe-matical analysis applied to heart rate, carbon dioxide output and electromyography.Braz J Phys Ther2013; 17: 614–622,
doi: 10.1590/S1413-35552012005000129.
21. Higa MN, Silva E, Neves VF, Catai AM, Gallo L, Silva de Sá MF. Comparison of anaerobic threshold determined by visual and mathematical methods in healthy women.Braz J Med Biol Res 2007; 40: 501–508, doi: 10.1590/S0100-879X2007000
400008.
22. Verlengia R, Rebelo AC, Crisp AH, Kunz VC, Dos Santos Carneiro Cordeiro MA, Hirata MH, et al. Lack of Association Between ACE Indel Polymorphism and Cardiorespiratory Fitness in Physically Active and Sedentary Young Women. Asian J Sports Med2014; 5: e22768, doi: 10.5812/asjsm. 22768.
23. Sirol FN, Sakabe DI, Catai AM, Milan LA, Martins LEB, Silva E. Comparasion of power output and heart rate levels in anaerobic threshold determinations by two indirect methods. Braz J Phys Ther2005; 9: 7.
24. Pithon KR, Martins LEB, Gallo Jr L, Catai AM, Silva E. Comparison of cardiorespiratory responses between con-stant and incremental load exercises below, above and at the ventilatory anaerobic threshold.Braz J Phys Ther2006; 10: 6, doi: 10.1590/S1413-35552006000200005.
25. Excoffier L, Laval G, Schneider S. Arlequin (version 3.0): an integrated software package for population genetics data analysis.Evol Bioinform Online2005; 1: 47–50, doi: 10.1177/
117693430500100003.
26. Benn M. Apolipoprotein B levels, APOB alleles, and risk of ischemic cardiovascular disease in the general population, a review.Atherosclerosis2009; 206: 17–30, doi: 10.1016/
j.atherosclerosis.2009.01.004.
27. Boekholdt SM, Peters RJ, Fountoulaki K, Kastelein JJ, Sijbrands EJ. Molecular variation at the apolipoprotein B gene locus in relation to lipids and cardiovascular disease: a systematic meta-analysis.Hum Genet2003; 113: 417–425,
doi: 10.1007/s00439-003-0988-3.
28. Borén J, Ekström U, Agren B, Nilsson-Ehle P, Innerarity TL. The molecular mechanism for the genetic disorder familial defective apolipoprotein B100. J Biol Chem 2001; 276: 9214–9218, doi: 10.1074/jbc.M008890200.
29. Knott TJ, Pease RJ, Powell LM, Wallis SC, Rall SC Jr, Innerarity TL, et al. Complete protein sequence and identifi -cation of structural domains of human apolipoprotein B. Nature1986; 323: 734–738, doi: 10.1038/323734a0.
30. Yang CY, Chen SH, Ganturco SH, Bradley WA, Sparrow JT, Tanimura M, et al. Sequence, structure, receptor binding domains, and internal repeat of human apolipoprotein B–100.
31. Iwanaga Y, Nishi I, Ono K, Takagi S, Tsutsumi Y, Ozaki M, et al. Angiotensin-converting enzyme genotype is not associated with exercise capacity or the training effect of cardiac rehabilitation in patients after acute myo-cardial infarction.Circ J 2005; 69: 5, doi: 10.1253/circj. 69.1315.
32. Woods DR, World M, Rayson MP, Williams AG, Jubb M, Jamshidi Y, et al. Endurance enhancement related to the human angiotensin I-converting enzyme I-D polymorphism
is not due to differences in the cardiorespiratory response to training. Eur J Appl Physiol 2002; 86: 240–244, doi:
10.1007/s00421-001-0545-5.