EFFECT OF RICE STRAW AND NITRATE LEVELS IN SOIL
SOLUTION ON NITROUS OXIDE EMISSION
André Carlos Cruz Copetti(1), Leandro Souza da Silva(2)*, Gerson Laerson Drescher(2),
Eduardo Augusto Müller(2), Rafael Lago Busanello(2) and Frederico Costa Beber Vieira(1)
(1) Universidade Federal do Pampa, Campus São Gabriel, São Gabriel, Rio Grande do Sul, Brasil.
(2) Universidade Federal de Santa Maria, Departamento de Solos, Santa Maria, Rio Grande do Sul, Brasil. * Corresponding author.
E-mail: [email protected]
ABSTRACT
Among the greenhouse gases, nitrous oxide (N2O) is considered important, in view of a global warming potential 296 times greater than that of carbon dioxide (CO2) and its dynamics strongly depend on the availability of C and mineral N in the soil. The understanding of the factors that define emissions is essential to develop mitigation strategies. This study evaluated the dynamics of N2O emissions after the application of different rice straw amounts and nitrate levels in soil solution. Pots containing soil treated with sodium nitrate rates (0, 50 and 100 g kg-1 of NO−
3-N) and rice straw levels (0, 5 and 10 Mg ha-1), i.e., nine treatments, were subjected to anaerobic conditions. The results showed that N2O emissions were increased by the addition of greater NO−3 amounts and reduced by large straw quantities applied to the soil. On the 1st day after flooding (DAF), significantly different N2O emissions were observed between the treatments with and without NO−3 addition, when straw had no significant influence on N2O levels. Emissions peaked on the 4th DAF in the treatments with highest NO−3-N addition. At this moment, straw application negatively affected N2O emissions, probably due to NO−3 immobilization. There were also alterations in other soil electrochemical characteristics, e.g., higher straw levels raised the Fe, Mn and dissolved C contents. These results indicate that a lowering of NO−3 concentration in the soil and the increase of straw incorporation can decrease N2O emissions.
Keywords: greenhouse effect, flooded soils, electrochemical characteristics.
INTRODUCTION
Among the greenhouse gases, nitrous oxide (N2O)
is considered important due to its global warming potential, 296 times greater than that of carbon dioxide (CO2). According to the evaluation report of the
Intergovernmental Panel on Climate Change (IPCC), there was an increase in the global atmospheric concentration of N2O, from about 270 parts per billion (ppb) in the pre-industrial period, to 319 ppb in 2005. The origin of more than one-third of all N2O emissions is believed to be anthropogenic (IPCC, 2007). Agriculture is responsible for the major part of N2O emissions, by N fertilization with synthetic or organic fertilizers, decomposition of organic compounds and by biological N fixation (IPCC, 1997).
The process of N2O production is almost
completely biotic, and the management consisting of human activities is usually related with the emission intensity, i.e., the management can reduce or increase gas emissions. Abiotic factors such as the soil type, hydraulic conditions and climate (Henault et al., 1998) also affect emission dynamics, and interactions among them result in different amounts of gas produced.
In the production of flood-irrigated rice, molecular oxygen (O2) in the water is reduced shortly after
flooding, changing the microbial communities drastically. Consequently, the soil is reduced by a chain of electrochemical reactions. Initially, according to Camargo et al. (1999), NO−3-N is reduced (generating N2O), followed by MnO2-Mn, Fe(OH)3-Fe, and SO-24 -S. After the depletion of these compounds, anaerobic organisms use organic
compounds as final acceptors of electrons and, consequently, methane (CH4), another greenhouse
gas, is produced (Silva et al., 2011). Thus, the change of processes occurs as function of a series of factors related to the anoxic environment and the condition for N2O and CH4 gas production is different (Reddy and Delaune, 2008).
The main mechanism involved in N2O production
is denitrification, which occurs when in absence of O2, the anaerobic bacteria use NO−3 as electron acceptor, which is reduced to NO, NO2 or N2
(Ponnamperuma, 1972; Camargo et al., 1999). In this context, the NO−3 availability in the soil
immediately after flooding plays an important role in the N2O emission dynamics. Knowledge
about the effects and magnitude of NO−3 in the soil
is essential for the establishment of management practices to minimize N2O emissions. Therefore,
rice fertilization with nitric sources in flooded soils is not recommended (Sosbai, 2012) and, even when using another form of N, management practices that avoid the transformation to NO−3 should be used.
Another relevant factor is the availability of organic material during soil flooding, for serving as substrate for the biological activity and as drain of NO−3 available in the soil, thus influencing emission
dynamics. Among the different management possibilities of irrigated rice fields, those that modify soil moisture and maintenance of crop residues on the soil surface affect N2O emissions. In areas without incorporation, the soil is left fallow, with or without grazing, the straw remains on the soil and may (or may not) be flooded in the interim season, depending on the pluvial regime and drainage systems. Another factor is soil tillage after harvest,
RESUMO: EMISSÃO DE N2O EM RAZÃO DA PRESENÇA DE PALHA DE ARROZ E
TEORES DE NITRATO NA SOLUÇÃO DO SOLO
Entre os gases de efeito estufa, o óxido nitroso (N2O) é considerado importante por apresentar poder
de aquecimento 296 vezes maior que o dióxido de carbono (CO2) e tem sua dinâmica muito dependente da
disponibilidade de C e de N mineral no solo. Portanto, conhecer os fatores que interferem na sua emissão é fundamental para desenvolver estratégias de mitigação. O objetivo deste estudo foi avaliar a dinâmica da emissão de N2O na presença de diferentes quantidades de palha de arroz e de teores de nitrato na
solução do solo. Para tal, nove tratamentos com a combinação de doses de nitrato de sódio (equivalente a 0, 50 e 100 g kg-1 de N-NO−
3) e as quantidades de palha de arroz (equivalente a 0, 5 e 10 Mg ha-1) foram
aplicados em vasos, onde foram submetidos a condições anaeróbicas por alagamento. A emissão de N2O
foi influenciada positivamente pela maior dose de NO−3 e pela menor quantidade de palha adicionada
no solo. No 1º dia após alagamento (DAA), a emissão de N2O foi alterada de forma significativa entre
os tratamentos, com e sem adição de NO−3, com pouca interferência da presença da palha de arroz nesse
momento. O maior pico de emissão foi observado no 4º DAA nos tratamentos com maior adição de NO−3; naquele momento, a adição da palha de arroz provocou efeito negativo sobre a emissão de N2O,
provavelmente por causa da imobilização do NO−3. Também houve alterações nas demais características
eletroquímicas do solo, em que as maiores adições de palha elevaram os teores de Fe, Mn e C dissolvido. Esses resultados indicaram que a redução da concentração de NO−3 no solo e o aumento da quantidade
de palha incorporada diminuem a emissão de N2O.
with straw incorporation and surface smoothing. Under this condition, soil flooding may also persist, according to the rainfall and drainage systems, affecting N2O emissions.
The aim of this study was to evaluate the dynamics of N2O emission as a function of mulching with rice straw and nitrate levels in the soil solution to shed light on the factors that affect N2O production.
MATERIAL AND METHODS
The study was carried out in an air-conditioned greenhouse of the Soil Science Department of the Universidade Federal de Santa Maria, Santa Maria, RS. The experimental was conducted in pots containing soil from the 0-20 cm layer of a paddy field in Santa Maria. The soil is classified as Planossolo Hidromórfico eutrófico arênico (hydromorphic eutrophic Aquultic Hapludalf) (Embrapa, 2006). Prior to the treatments, the soil properties were pH in water (1:1): 4.8; organic matter: 0.18 g g-1;
clay, silt, sand: 0.28, 0.23 and 0.4 g g-1, respectively;
P-Mehlich-1: 3 mg dm-3.
For the experiment, polyvinyl chloride (PVC) pots (40 cm height; 25 cm diameter; 0.049 m2 surface
area) were filled with 7.0 kg of air-dried, ground and sieved (<2 mm) soil. Nine treatments were applied, consisting of combinations of rice straw and nitrate (Table 1). The treatments were randomly distributed in a greenhouse covered by translucent plastic. The internal greenhouse temperature was preserved at about 25 °C by a fan-driven cooling ventilation system, maintaining the day temperature at ±4 °C of the above value. Light and air humidity were not controlled. The experiment was conducted in a completely randomized design, with three replications. After straw application and nitrate treatments, the pots were flooded with a water layer of 5.0 cm, which was replaced with distilled water when the layer reached around 1.0 cm. Rice straw (0.45 and 0.097 g g-1 of C and N,
respectively) was collected in a paddy field, chopped for better distribution and incorporated in the soil at quantities equivalent to the treatments (Table 1). Sodium nitrate was used as nitrate source, applied in aqueous solution.
Air was collected by the closed static chamber method (Mosier, 1989) for gas emission evaluation. Each chamber consisted of a PVC tube, with one closed end, coupled with the upper part of the pots with a circular channel full of water, for a complete isolation of the inner atmosphere. The upper portion of the tubes was equipped with a digital thermometer, a three-way valve for air sampling and a fan to homogenize the air within the chamber immediately before sampling.
Gases were sampled in 20 mL polypropylene syringes, also equipped with three-way valves, attached to the valves in the upper extremity of the PVC tube. Air samples were taken 0, 5, 10 and 15 min after closing the chamber. Immediately after sampling, the syringes were stored in a thermic box and transported to the laboratory for chromatographic analysis of the gas concentration in the air samples. Immediately after sampling, water level and temperature, air temperature, and rice plant height were recorded to determine the air volume inside the chamber used for calculation of gas emission rates. The gas concentration in air samples was analyzed by gas chromatography with a flame ionization detector (FID) at 250 ºC [Shimadzu GC-2014 - model “greenhouse” equipped with three packed columns, operating at 70 ºC, carrier gas N2 at a flow of 26 mL min-1, with
direct injection (loop of 1 mL)].
The N2O concentrations in air samples were
computed as:
Q × E × P × V R × T
where Q is the amount of gas in the chamber at sampling (ηmol mol-1); E is the equivalent of ηg N ηmol-1 of N
2O
equal to 28; P is the atmospheric pressure within the chamber, set at 1 atm; V is the chamber volume (L); R is the constant of the ideal gases (0.08205 atm L mol-1 K-1); T is the chamber temperature at sampling
(°K). The gas increase rate within the chamber (in min) was obtained by the angular coefficient of the equation of the adjusted linear equation between gas concentration and collection time, generated in an Excel® sheet by the equation of linear projection. From
the daily computed flow values, the total emission in the period was estimated by the integration of the area under the curve obtained by interpolation using software SigmaPlot®.
Table 1. Experimental treatments consisting of combination of quantities of rice straw biomass and nitrate rates application
Treatment Rate of NO−3-N(1) Rice straw
biomass(2)
mg kg-1 Mg ha-1
To relate the electrochemical alterations in the soil with gas emissions in the different treatments, soil solution was taken at each gas sampling event. Previously to soil flooding, a PVC tube (10 cm length × 2.5 cm diameter) was installed 5.0 cm below the soil level. The underground end of the tube was perforated and covered with polyamide sheets (porosity 80 μm). The outer extremity of the PVC tube was connected to a flexible tube (diameter 3 mm, length 50 cm) with a 60 mL polyethylene syringe, to suck the soil solution.
The pH and redox potential of the soil samples were determined using manual potentiometers with an Ag/AgCl electrode of redox potential with platinum ring. A 30 mL aliquot of the solution was filtered (Milipore® 0.45 mm) with a vacuum pump
and acidified with 1 mL HCl 1 mol L-1 to avoid Fe
precipitation by solution re-oxidation during sample storage. The Fe and Mn contents were analyzed in this acidified solution by atomic absorption spectrometry. An aliquot of the sample was used to analyze NO−3-N and NH
+
4-N contents by distillation
and titration. Dissolved organic carbon (COD) was determined by potassium dichromate oxidation.
The experiment ended when the N2O emission
rates reached values close to zero. Five samplings were performed 1, 4, 7, 9 and 12 days after flooding (DAF). For the data on daily rates and cumulative total, the normality test of Shapiro-Wilk was used, but the data indicated non- normality. Therefore, the non-parametric analysis of variance (Kruskal-Wallis) was used. This test can compare three or more samples, independent of the size or with different sizes, by the Student-Newman-Keuls tests, using software Bioestat.
RESULTS
The daily N2O emission from nitrate-amended
soils was greater than 1,000 g ha-1 d-1 on the first
DAF, approaching 2,000 g ha-1 d-1 in the treatment
with 50 mg kg-1 of nitrate and without straw addition
(Figure 1). Significant differences were observed between treatments with and without nitrate addition, but there was no detectable effect of straw on N2O emissions on
the first day of evaluation. The N2O emission peak in
the treatments with nitrate addition occurred on the 4th DAF, corresponding to the second sampling, with
exception of the treatment amended with 10 Mg straw and 50 mg nitrate, with higher emission in the first sampling followed by a great decrease in N2O emission on the following days (Figure 1).
The daily N2O emissions peaked (7,542 g ha-1 d-1)
in the treatment with addition of 5 Mg straw and 100 mg nitrate, followed by the treatments with addition of 100 mg, 50 mg and without nitrate addition, successively (Figure 1). On the 4th DAF, straw mulching
diminished N2O emission up to the nitrate rate of
50 mg, although the differences were not statistically significant. For each nitrate rate, N2O emission was
inversely related to the amount of straw (Figure 1). On the 7th and 9th DAF, N
2O emissions in
the treatments with 0 and 50 mg of nitrate were negligible. The treatment with a nitrate rate of 100 mg kg-1 on soil without straw performed best
again, although differences were not statistically significant. Thus, N2O was emitted on the 1st DAF in
all treatments and most emission peaks occurred on the 4th DAF. In addition, emissions ended firstly in
the treatments without nitrate addition, followed by the treatments with 50 mg of nitrate and, finally on the 12th DAF, N
2O emissions ceased in the treatments
with nitrate rates of 100 mg kg-1 soil (Figure 1).
In the treatments with lower nitrate and higher straw application, cumulative emissions were lower (Figure 2). On the other hand, emissions were higher in treatments with higher nitrate addition and lower straw addition (Figure 2). The total mean cumulative N2O emissions from the treatments without nitrate
N2
O (g ha
-1 d -1)
Day after flooding
0 Mg straw/0 mg N
0 Mg straw/50 mg N
0 Mg straw/100 mg N 5 Mg straw/0 mg N
5 Mg straw/50 mg N
5 Mg straw/100 mg N
10 Mg straw/0 mg N
10 Mg straw/50 mg N
10 Mg straw/100 mg N 8.000
7.000
6.000
5.000
4.000
3.000
2.000
1.000
0
-1.000
0 5 10
Figure 1. Daily flux rates of N2O from flooded soil in pots covered with different quantities of rice straw (0, 5 and 10 Mg ha-1) and rates of NO−
addition were equivalent to 26, 80 and 103 g ha-1
under straw applications of 10, 5 and 0 Mg ha-1,
respectively. The treatments fertilized with NO−3-N equivalent to 50 mg kg-1 soil emitted a total of 3,694,
6,574 and 12,593 g ha-1 under straw applications of 10,
5 and 0 mg ha-1, respectively, indicating an interactive
effect. The soils fertilized with the largest nitrate rate followed the same pattern, as the cumulative N2O
emissions were 22,403, 32,137 and 35,374 g ha-1 under
straw addition of 10, 5 and 0 mg ha-1, respectively.
Statistically significant differences were observed only among extreme treatments, i.e. among treatments without nitrate addition and treatments with nitrate rates of 100 mg kg-1 soil. Although the differences
were not statistically significant, the influence of straw application on emission means was evident, with lower N2O emissions from higher straw amounts (Figure 2).
Analyzing the emissions from the treatments without straw, mulching of 5 Mg ha-1 diminished N
2O
emissions by about 20, 50 and 10 % in the treatments with addition of 0, 50 and 100 mg kg-1 NO−
3-N,
respectively. Adding 10 Mg of straw decreased N2O
emissions even more, reaching values of 75, 71 and 27 %, respectively, in the treatments with addition of 0, 50 and 100 mg kg-1 NO−
3-N. On the other
hand, considering the treatment without nitrate, the addition of 50 mg kg-1 NO−
3-N increased N2O
emissions by 122, 82 and 145 %, respectively, in the treatments with 0, 5 and 10 Mg ha-1 of straw.
A rate of 100 mg kg-1 NO−
3-N increased cumulative
emissions by 344, 403 and 877 % in the treatments with 0, 5 and 10 Mg ha-1 straw, respectively.
The levels of mineral N in the soil solution were proportional to the rates of NO−3-N fertilization, with
clear differences among treatments (Figure 3a).
Soils amended with 100 mg NO−3-N kg-1 contained
levels of approximately 200 mg L-1 immediately
after flooding (1st DAF), decreasing to 50% on the
4th DAF and reaching practically zero on the 7th
DAF. For the treatments with NO−3-N addition
equivalent to 50 mg kg-1 soil, the values on the 1st
DAF were around 85 mg L-1 and were practically
depleted on the 4th DAF. In the treatments
without N fertilization, the values were lower than 10 mg L-1 (Figure 3a). Contents of dissolved organic
C increased with straw mulching, from 60 mg L-1
in the pots without straw to 331 mg L-1 in the pots
with addition of 10 Mg straw ha-1 (Figure 3b). This
increase corresponded to more than 5 times the amount available in the soil. However, within less
N2
O (g ha
-1 d -1)
Treatment 40.000
35.000
30.000
25.000
20.000
15.000
10.000
5.000
0 a
a
ab
abc
abcd abcd
cd cd d
0/100 5/100 10/100 0/50 5/50 10/50 0/0 5/0 10/0
Figure 2. Acummulated emissions of N2O from soil in pots, under different amounts of rice straw (0, 5 and 10 Mg ha-1) and NO−
3-N rates (0, 50 and 100 mg kg-1), during 12 days of flooding. Means with the same letters do not differ significantly at 5 % by the Kruskal-Wallis test of means comparison.
Mineral N (mg
L
-1) 250
200
150
100
50
0
0 4 7 11 14
DOC (mg L
-1) 350 (b) (a)
300
250
200
150
100
50
0
0 4
Day after flooding
9 14
0 Mg straw/0 mg N 0 Mg straw/50 mg N 0 Mg straw/100 mg N 5 Mg straw/0 mg N 5 Mg straw/50 mg N 5 Mg straw/100 mg N 10 Mg straw/0 mg N 10 Mg straw/50 mg N 10 Mg straw/100 mg N
than seven days the values decreased to less than 10 mg L-1, as in the pots without straw mulching.
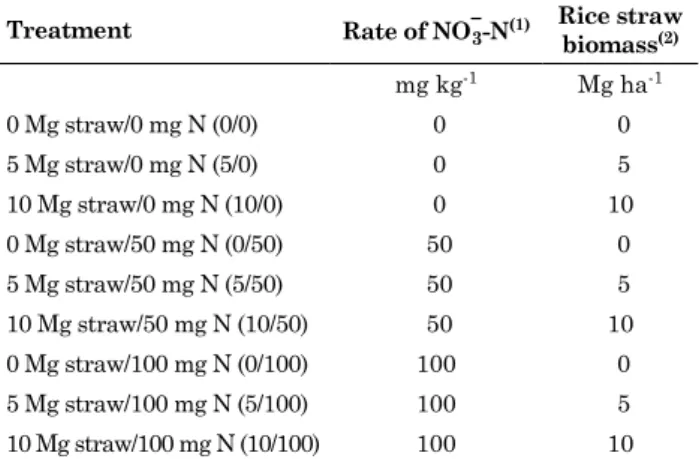
The redox potential expressed in Eh (mV) was modified by the addition of sodium nitrate and straw. The redox potential of nitrate-fertilized soils ranged from approximately 313 to 350 mV, and was smaller in the absence of nitrate fertilization, ranging from 202 to 230 mV (Figure 4a). After the 9th DAF, the
values among treatments approached each other, indicating that after this time, the variation in Eh was determined by factors apart from the nitrate content. Concerning the pH of the soil solution, a fast increase was observed in the treatment without straw and with NO−3-N at a rate of 100 mg kg-1. The
initial pH of all treatments ranged from 4.35 to 4.52. After seven days of flooding, pH ranged from 4.53 in the treatments without NO−3-N addition to 5.71 in the treatment without straw addition and NO−3-N
application of 100 mg kg-1. The pH in all treatments
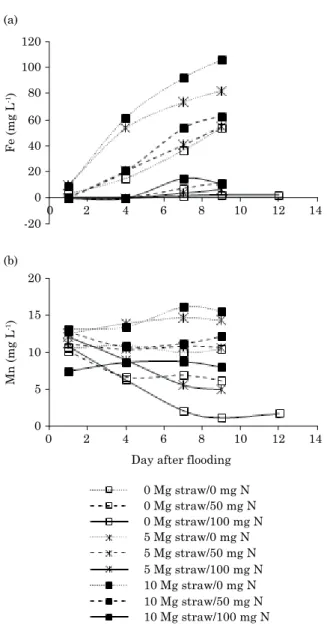
increased during the study period (Figure 4b). Iron contents in soil solution were lower than 10.2 mg L-1 at the beginning of flooding and reached
approximately 100 mg L-1 on the 9th DAF. The
levels available in soil solution in increased in all treatments, but most in the treatments without nitrate addition. The highest content of Fe available in soil solution, without nitrate addition, occurred in the treatment with straw addition of 10 Mg ha-1, with
106 mg L-1 on the 9th DAF. The treatment with straw
application of 5 Mg ha-1 contained 82.5 mg L-1 Fe.
The treatment without straw application and the treatments with addition of 50 mg kg-1 NO−
3-N and 10
and 5 Mg ha-1 straw had values of Fe near 55 mg L-1.
In all other treatments, the Fe contents were lower than 12 mg L-1 on the 9th DAF (Figure 5a).
Similarly to Fe, Mn is an element with higher soil availability after flooding. However, for Mn this process tends to occur later. In the study period, our results indicated a decrease in the contents of available Mn under applications of 100 mg kg-1 NO−
3-N and in the treatments with straw
addition up to 5 Mg ha-1 straw. The highest values
of Mn in the soil solution were 14 and 15.5 mg L-1
in the treatments without NO−3-N addition and with
addition of 5 and 10 Mg ha-1 straw, respectively. The
lowest Mn concentration in solution was 1.2 mg L-1
in the treatment without straw addition and with NO−3-N addition equivalent to 100 mg kg-1 (Figure 5b).
DISCUSSION
The results clearly evidenced a close and direct relationship between nitrate availability in soil solution and nitrous oxide emission. With lower expression, but proportional to the amount of straw application, there was a decrease in the gas emission as the amount of straw increased, which can be
attributed to immobilization by microorganisms decomposing a material with high C/N ratio. In a field study, Souza (2013) found a relationship between straw management and N2O emissions in the interim
harvest (period with soil moisture variation) and reported that cumulative N2O emissions were lowest
from soil to which straw was added after harvest. In the period of rice cultivation, this author observed lower emissions from treatments without straw application and with rye grass cultivation prior to rice. This result was attributed to the presence of organic material and consequent N immobilization in the soil. Testing management methods of wheat straw predecing rice cultivation, Ma et al. (2009) found that N2O emissions were highest from the treatment without straw, although a decrease in CH4
emission was also observed.
Concerning the increase in emissions according to the nitrate rates applied, this study revealed nitrate application was directly responsible for increases
350
300
250
200
150
100
0 2 4 6 8 10 12 14
6.0
5.5
5.0
4.5
4.0
0 2 4 6 8 10 12 14
Eh
pH
(b) (a)
Day after flooding
0 Mg straw/0 mg N 0 Mg straw/50 mg N 0 Mg straw/100 mg N 5 Mg straw/0 mg N 5 Mg straw/50 mg N 5 Mg straw/100 mg N 10 Mg straw/0 mg N 10 Mg straw/50 mg N 10 Mg straw/100 mg N
in N2O emission, as in the studies of Ghosh et al.
(2003), in which higher emissions were also observed in treatments with nitrate addition. In our study, the period of N2O emission and the maximal peak were
directly proportional to the nitrate input into the soil. The absence of straw extended N2O emissions,
but did not result in peak values higher than those in the treatment with 5 Mg ha-1 straw.
Nitrate can follow two routes in the flooded environments. One is assimilation by microorganisms and accumulation in organic forms. The other is denitrification and formation of NO, N2O or N2. As
only the N2O form was quantified, in the treatments with straw addition and higher C availability, a complete transformation from NO−3 to N2 may also have occurred, which would explain the lower N2O emissions. Similarly, Ma et al. (2009) attributed
the lower N2O emissions under rigorous anaerobic conditions in soil to denitrification by which reduction to N2 is possible. Firstly, N2O is produced
in the soil by microbial processes of nitrification and denitrification. However, the incorporation of residues with a high C/N ratio promotes greater immobilization, limiting the N substrate for nitrification and denitrification (Tanaka et al., 1990; Jensen, 1997).
Comparing the cumulative emissions from the treatment with lowest (10 Mg ha-1 straw and no
N addition) and highest emissions (without straw addition and addition of the equivalent NO−3-N
of 100 mg kg-1), the difference was 1,387-fold.
Ma et al. (2009) reported that incorporation of rice straw in the soil reduced N2O emissions, but in the final balance, taking into account the increase in methane emission from this management, incorporation was not the best recommendation. Both nitrate application and straw addition affected the electrochemical conditions of the soil. In the short term, straw addition may not affect gas, mainly N2O, emissions. However, it is closely related to methane emissions once the inorganic compounds as electron acceptors are depleted. The effects of management on nitrate availability and other microbial activities indirectly affect the beginning of methane emissions and their quantity in the future.
The redox potential is a measure of intensity and changes as function of soil characteristics. Thus, the same value can indicate reduction in one soil type and oxidation in another. For the conditions and type of soil in this study, values above 200 mV are considered states of oxidation, while values near zero mean a reduction state. According to Ponnamperuma (1972), several authors use the measures of Eh as indicator of the reduction state of NO−3. However, to persist in the flooded soil as
NO−3, the oxidative state has to be high, as occurs
where there is a satisfactory supply of oxygen by some route or where oxygen-consuming microbial activity is low.
The higher values of Eh observed in the pots fertilized with nitrate are examples that the redox potential (Eh) indicates the highest potential of oxidizing and, consequently, of reducing organic material. On the other hand, in pots with higher C supply, nitrate and its derivative were reduced to N2, in addition to assimilation by microorganisms, immobilizing N. Analyzing the values of soluble C in the soil solution, the pots with straw addition revealed higher availability of organic C in the beginning of the experiment. On the 7th DAF,
the values remained low and did not differ from those in pots without straw addition. This result can be attributed to the consumption of the more soluble compounds by the microorganisms. Larger C availability results in higher consumption of electrons. This becomes clear when analyzing
Fe (mg L
-1)
Mn (mg L
-1) 120
100
80
60
40
20
-20 0
0 2 4 6 8 10 12 14
20
15
10
5
0
0 2 4 6 8 10 12 14
(b) (a)
Day after flooding
0 Mg straw/0 mg N 0 Mg straw/50 mg N 0 Mg straw/100 mg N 5 Mg straw/0 mg N 5 Mg straw/50 mg N 5 Mg straw/100 mg N 10 Mg straw/0 mg N 10 Mg straw/50 mg N 10 Mg straw/100 mg N
the Fe and Mn levels, which were highest in the treatments with largest straw and lowest nitrate addition. The reason is that under lower nitrate availability, microorganisms use Fe and Mn compounds firstly as electron acceptors and the quantity of the electron source C will be determinant. These facts directly affect the pH values, since reduction reactions also include the use of H+, affecting the pH of the soil solution.
These observations indicate that both N and C are key elements in the N2O emission dynamics in
flooded soils. Their availability in forms used by the anaerobic microorganisms during reduction should be considered in the establishment of management practices of irrigated rice, such as N fertilization and management of crop residues, mitigating gas emissions. However, these strategies should also consider the effects on the dynamics of other greenhouse gases such as CO2 and CH4, as well as
their consequences for other production factors, which may ultimately also affect the crop yield.
CONCLUSIONS
Straw application on flooded soils immobilizes the nitrate and decreases N2O emissions to the atmosphere.
Emissions of N2O are directly related to the
nitrate concentration and inversely related to the straw quantity.
The curve of N2O emission does not fit the
concentration curve of NO−3 in the soil solution, i.e.
it is not possible to estimate the emission quantity from the known nitrate concentration in solution, since other processes that are not related to nitrate consumption are involved.
ACKNOWLEDGEMENTS
The authors thank the Fundação de Amparo à P e s q u i s a d o E s t a d o d o R i o G r a n d e d o Sul - FAPERGS, Brazilian Council for Scientific and Technological Development – CNPq, and Brazilian Federal Agency for Support and Evaluation of Graduate Education for financial support, scholarships and grants.
REFERENCES
C a m a r g o F A O , S a n t o s G A , Z o n t a E . A l t e r a ç õ e s
eletroquímicas em solos inundados. Ci. Rural, 1999;29:171-80. doi:10.1590/S0103-84781999000100032.
Empresa Brasileira de Pesquisa Agropecuária - Embrapa. Sistema
brasileiro de classificação de solos. 2ª ed. Brasília, DF; 2006.
Ghosh S, Majumdar D, Jain MC. Methane and nitrous oxide emissions from an irrigated rice of North India. Chemosphere. 2003;51:181-95.
Henault C, Devis X, Page S, Justes E, Reau R, Germon JC. Nitrous oxide emissions under different soil and land management conditions. Biol Fertil Soils. 1998;26:199-207. Intergovernmental Panel on Climatic Change - IPCC. Climate change 2007: The physical science basis: Summary for
policymakers. Geneva; 2007.
Intergovernmental Panel on Climatic Change - IPCC. Revised 1996 IPCC Guidelines for National Greenhouse Gas Inventories.
Bracknell: Organization for Economic Co-operation and
Development; 1997.
Jensen ES. Nitrogen immobilization and mineralization during initial decomposition of 15N-labelled pea and barley residues. Biol Fertil Soils. 1997;24:39-44.
Ma J, Ma E, Xu H, Yagi K, Cai Z. Wheat straw management affects CH4 and N2O emissions from rice fields. Soil Biol Biochem. 2009;41:1022-8.
Mosier AR. Chamber and isotope techniques. In: Andreae MO, Schimel DS, editors. Exchange of traces gases between terrestrial
ecosystems and the atmosphere: Report of the Dahlem Workshop;
1989. p.175-87.
Ponnamperuma FN. The chemical of submerged soils. Adv Agron. 1972;24:29-96.
Reddy KR, Delaune RD. Biogeochemistry of wetlands: Science and applications. Boca Raton: CRC Press Taylor & Francis Group; 2008.
Silva LS, Griebeler G, Moterle DF, Bayer C, Zschornack
T, Pocojeski E. Dinâmica da emissão de CH4 em solos
representativos do cultivo de arroz irrigado no sul do Brasil. R Bras Ci Solo. 2011;35:473-83.
Sociedade Sul-Brasileira de Arroz Irrigado - Sosbai. Arroz
irrigado: Recomendações técnicas da pesquisa para o Sul do
Brasil. Itajaí; 2012.
Souza EL. Emissão de óxido nitroso e metano em área de cultivo com arroz irrigado com diferentes manejos da palha pós-colheita [tese]. Santa Maria: Universidade Federal de Santa Maria; 2013.
Tanaka F, Ono S, Hayasaka T. Identification and evaluation of toxicity of rice root elongation inhibitors in flooded soils with