Emissions from Rice Paddies in Northeast China from
1990 to 2010
Yuan Zhang1,2*, Shiliang Su3, Feng Zhang4, Runhe Shi1, Wei Gao1
1Key Laboratory of Geographical Information Science, Ministry of Education, East China Normal University, Shanghai, China,2Research Center of Remote Sensing & Geoscience, Northeast Institute of Geography & Agroecology, Chinese Academy of Sciences, Changchun, China,3College of Environmental & Resource Sciences, Zhejiang University, Hangzhou, China,4Key Laboratory of Arid and Grassland Agro-Ecology, Lanzhou University, Lanzhou, China
Abstract
Background:Rice paddies have been identified as major methane (CH4) source induced by human activities. As a major rice production region in Northern China, the rice paddies in the Three-Rivers Plain (TRP) have experienced large changes in spatial distribution over the recent 20 years (from 1990 to 2010). Consequently, accurate estimation and characterization of spatiotemporal patterns of CH4emissions from rice paddies has become an pressing issue for assessing the environmental impacts of agroecosystems, and further making GHG mitigation strategies at regional or global levels.
Methodology/Principal Findings: Integrating remote sensing mapping with a process-based biogeochemistry model, Denitrification and Decomposition (DNDC), was utilized to quantify the regional CH4emissions from the entire rice paddies in study region. Based on site validation and sensitivity tests, geographic information system (GIS) databases with the spatially differentiated input information were constructed to drive DNDC upscaling for its regional simulations. Results showed that (1) The large change in total methane emission that occurred in 2000 and 2010 compared to 1990 is distributed to the explosive growth in amounts of rice planted; (2) the spatial variations in CH4fluxes in this study are mainly attributed to the most sensitive factor soil properties, i.e., soil clay fraction and soil organic carbon (SOC) content, and (3) the warming climate could enhance CH4emission in the cool paddies.
Conclusions/Significance:The study concluded that the introduction of remote sensing analysis into the DNDC upscaling has a great capability in timely quantifying the methane emissions from cool paddies with fast land use and cover changes. And also, it confirmed that the northern wetland agroecosystems made great contributions to global greenhouse gas inventory.
Citation:Zhang Y, Su S, Zhang F, Shi R, Gao W (2012) Characterizing Spatiotemporal Dynamics of Methane Emissions from Rice Paddies in Northeast China from 1990 to 2010. PLoS ONE 7(1): e29156. doi:10.1371/journal.pone.0029156
Editor:Julian Clifton, University of Western Australia, Australia
ReceivedJune 22, 2011;AcceptedNovember 22, 2011;PublishedJanuary 3, 2012
Copyright:ß2012 Zhang et al. This is an open-access article distributed under the terms of the Creative Commons Attribution License, which permits unrestricted use, distribution, and reproduction in any medium, provided the original author and source are credited.
Funding:1. National Natural Science Foundation of China (No. 41001202). (http://www.nsfc.gov.cn/nsfc/cen/00/download.html) 2. National Basic Research Program of China (973) (No. 2010CB951603). (http://www.most.gov.cn/eng/index.htm) The two projects granted by the funders provided substantial financial support for the study, and took a role in soil data collection and analysis, agricultural management information survey for preparing the manuscript.
Competing Interests:The authors have declared that no competing interests exist.
* E-mail: [email protected]
Introduction
Methane (CH4) is a major greenhouse gases (GHG). According to
the Intergovernmental Panel on Climate Change (IPCC) report, atmospheric CH4concentrations have risen to 1774 ppb in 2005 [1].
Many studies have proved that agricultural activities are responsible for approximately 50% of global atmospheric inputs of CH4, wherein
the rice paddies have been identified as a major source [2]. Over 10% of atmospheric CH4was attributed to the emissions from global rice
paddies [3,4]. Thus, how to accurately estimate the CH4emissions
from rice paddies has become an pressing issue for assessing the environment impacts of agroecosystems, and further making GHG mitigation strategies at regional or global levels.
As an important rice producing country, China possesses approximately 20% of the world’s rice paddies which provides about 30% of the world’s rice needs [5]. About 20% of all croplands in China were cultivated for rice production [6]. Such a
huge CH4source could make a great contribution to global CH4
inventory. To estimate the national inventory of CH4emission, a
number of site-specific observations were conducted for measuring CH4 flux at field sites in the major rice producing areas in
Southern and Southeast of China [7–10]. These ground-based measurements were reliable for understanding the mechanics of CH4 emission at local scale. Given the emergence of new
frameworks for GHGs mitigation, however, it fails to respond to practicable requirements at national, regional, and global levels in the long run for high variations in spatial and temporal pattern of CH4 emission with changing environmental conditions [11–15].
Consequently, based on the extrapolation of the understandings gained at site scale to a large spatial dimension, model simulations were required to meet the demands for spatiotemporal analysis of CH4emissions from rice fields.
Model estimation of CH4emissions from rice fields began with
CH4emission rate and rice biomass or yield [16–18]. However,
these ‘‘easy-to-use’’ approaches were unable to reasonably explain biogeochemical processes involved in CH4production, oxidation
and emission, and also explicitly delineate the emissions variation at regional scale across a wide range of soil conditions and management practices. In this case, many physical models consequently were developed based on biogeochemical process to quantify the comprehensive effects of ecological drivers, soil and climate factors and management alternatives on agricultural production and environment [19–21]. For their capability in simulating CH4production and oxidation process in paddies, so
were extensively utilized to regional or global CH4estimation [22–
27].
Of among, the Denitrification and Decomposition (DNDC) model is a generic model that simulates the biogeochemical processes leading to GHG emissions from soil [19,28,29]. It has been adapted to simulations of GHG (e.g. CO2, N2O or CH4)
emissions from a wide range of systems such like dryland crop, pasture, rice paddy, and forest systems [30]. For rice-cropping system, DNDC has been substantially tested/validated against observed CO2, N2O or CH4fluxes during the past two decades
[25,31–33]. Satisfactory results were achieved in a number of countries across the world like the U.S., China, Thailand, India, Japan, etc. [32–36]. Many studies proved that DNDC is most applicable for estimating CH4 emissions from rice paddies at
regional scale [26,27].
To implement the upscaling for multi-temporal, regional CH4
estimation, accurate acquisition of spatial distribution of rice field was indispensable to advance the regional applications of DNDC. Remote sensing (RS) for mapping rice could provide more accurate spatial information of rice fields than conventional census data. Many researchers utilized remotely sensed data (optical or microwave) for mapping the spatial distribution of paddy rice at regional scale [37,38]. DNDC has been discussed for upsacling by integrating the RS technique to compile greenhouse gas inventories, identify spatial patterns in emission, or explore scenarios for GHG mitigation [39–41].
In this study, a representative region of paddy rice production, the Three-Rivers Plain (TRP) in Northern China, was selected for regional CH4estimation. This region possesses climate, soil and
management conditions differing from that in the tropical or subtropical rice regions. With the introduction of RS analysis into the DNDC upscaling, this study aims at characterizing the spatiotemporal patterns of the CH4emissions from rice fields in
the TRP over the past two decades (from 1990 to 2010), and further for quantifying the contribution of the rice paddies within the TRP to global methane.
Methods
Study area
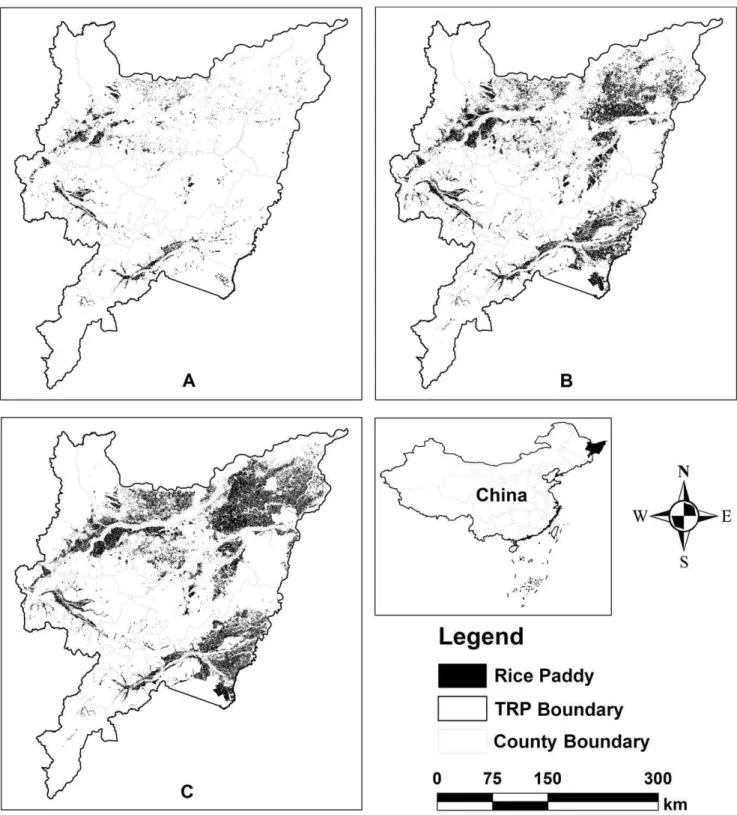
The study area, the TRP, is located in northeast China (48.5u– 43.8uN and 129.2u–135.1uE). Three major rivers, Songhua River, Wusuli River and Heilong River, whose watersheds cover almost the entire territory (10.93 million hectares) of the eastern part of Heilongjiang Province (Fig. 1). This region lies at 45 to 60 m geographic elevation above sea level with a gentle and flat topographic relief. Croplands is cultivated in this region from early May to early October for each cropping year with leaving fields fallow for a long period (approximately 7 months). Annual mean temperature is ranged from 2.6 to 5.2uC, and annual precipitation ranged from 330 to 850 mm during the period of 1980–2010. The soils are fertile and rich in organic matter. The flat topography, fertile soils and abundant water resources have made the alluvial
plain favorable for crop production. In the 1950s, land reclamation campaigns in the Northeast China converted a majority of the natural swamplands into farmlands. Over the past six decades, the region has experienced drastic changes in the land use. Especially in the recent 20 year, over one million ha of lands has been cultivated as rice paddy.
The rice fields in the TRP, with the highest latitude in not only China but also the world, are one of the most important resources producing high quality rice for the region even the whole county. In this region, a small population of farmer owes a large amount of agro-lands, and modern cultivation managements are extensively practiced. Only single-season rice is planted in the region with growing season from late May to late September. Continuously deepwater flooding (with.10 cm water depth) is widely adapted in rice fields cross the TRP. Urea and synthetic fertilizer are predominantly applied without any organic matter amended. About 10% of the rice straw is normally left as stubble in the fields after harvest in October, and the stubble is incorporated into the soils with tillage before the beginning of the next rice season.
Model Validation
To validate the applicability of DNDC model for the rice fields in the TRP, field experiments were conducted at a paddy site in the Honghe Farm (at 47u359N and 133u319E) in 2004 and 2006 within the plain (Fig. 1). Ecological factors to drive DNDC model for simulating the CH4 production and oxidation in rice paddy
included three major factors, i.e. climate, soil properties and management practices. These factors (i.e. model inputs) were used to run DNDC for the experimental site. Daily meteorological data (air temperature and precipitation) were acquired from the local climate station, a part of the Ecological Experimental Station of Mire-Wetland in the TRP run by the Chinese Academy of Science. Soil physical and chemical properties in the field site were obtained from the ground-based measurements. Rice cultivation information was collected from the log documents of field measurements. Three treatments were conducted in a same paddy field with specific management practices (see details in [41]). Three treatments are: 60 kg N/ha of N-fertilizer application rate in 2004 (T1); 150 kg N/ha of N-fertilizer application rate in 2004 (T2); and 150 kg N/ha of N-fertilizer application rate in 2006 (T3). The measurements of CH4fluxes were conducted twice per week with
static chamber method through the rice-growing period (from late May to early October). The measured CH4flux data were used to
compare with the modeled CH4fluxes at daily time step. Statistical
tools such as the root mean square error (RMSE), the coefficient of model efficiency (EF) and the coefficient of model determination (CD) were adopted to assess the ‘‘goodness of fit’’ of model predictions. Normally, value for EF is less than or equal to 1. A positive value indicates that the simulated values describe the trend in the measured data better than the mean of the observed values. The CD value is larger than or equal to 0. When a CD value of 1 or above, it indicates that the model describes the measured data better than the mean of the observations. Taken together, EF and CD allow RMSE to be further interpreted where standard error values of the measurements are unavailable. Detailed description on the calculation of the RMSE, CD and CD were listed in [42].
Construction of database for Regional Simulation For the purpose of characterizing the spatiotemporal patterns of CH4emissions, it is necessary to construct geographic information
To delineate the spatial distribution of rice fields in the TRP, three rice maps were retrieved from Landsat thematic mapper (TM) RS imagery acquired in approximately 1990, 2000 and 2010 (Table 1). Total of 30 TM images with a high spatial resolution of 30 m were selected in the tillering or near-mature stage of rice in 1990 (9 images), 2000 (9 images) and 2010 (12 images). These Landsat TM images accessed from the EarthExplorer Interface (http://edcsns17.cr.usgs.gov/EarthExplorer/) were digitized by visual interpretation technology at the GIS software environment of ArcGIS 9.2, which were used to extract the detailed spatial distribution of paddies in the TRP. In terms of the unique phenology features of rice, three accurate rice maps were successfully extracted from the clear remote sensing images.
The climate dataset were composed of daily maximum and minimum air temperature, precipitation and mean wind speed observed in 1990, 2000 and 2010. They were acquired from 7 basic weather stations in China (China Meteorological Data Sharing Service System at http://data.cma.gov.cn/). The entire plain was segmented into 7 sub-regions at which one weather station was located. We assumed the rice growth was with the same climate condition within each sub-region.
Soil data were derived from the soil dataset developed by the Institute of Soil Science, Chinese Academy of Sciences, which was compiled based on the second national soil survey of China conducted in 1980–1990s [43,44]. The soil spatial dataset was a grid data with cell size of 10 km610 km, which contains soil
Figure 1. Location of the Three-Rivers Plain.
texture (sand, silt and clay percentage) and physical and chemical properties (e.g. organic matter, pH and bulk density) at multiple-layer profile. In the TRP, there were 605, 815 and 826 soil cells cover the rice paddies of the TRP in 1990, 2000 and 2010, respectively. Each cell containing soil properties in the top layer (0–10 cm) were used to drive the DNDC simulations. And then, spatial overlay analysis was performed to segment three rice thematic maps with the soil data with cell size of 10 km610 km. Generally, unlike the extensive farmland use mode in South China, the management practices are relatively identical cross the study region. The indistinctive differences in rice cultivation practices make less variation in CH4emissions from rice paddy in
this study area. Therefore for the multiple temporal simulation of CH4emission, we assumed the general management practices in
each simulated year was spatially identical for the entire rice paddies in TRP. Detailed information on paddy cultivation (e.g. planting/harvesting date, tillage/irrigation regime, fertilizer ap-plication, residue management, etc.) in 1990, 2000 and 2010 were investigated by communicating with a number of local agrono-mists and farmers (Table 2).
The spatially differentiated information above listed was compiled in the GIS database of DNDC for the regional simulation. DNDC was performed for characterizing the
spatio-temporal patterns of CH4 emission with three input datasets in
1990, 2000 and 2010, respectively. DNDC run twice for each grid cell with the maximum and minimum values of the soil properties, which formed a range of CH4emission that was later used for
quantifying the uncertainty generated from the DNDC upscaling [25]. Based on the modeled CH4flux and the rice field acreage
within each cell, the total yearly CH4emissions from the cell could
be calculated. Three cell-level spatial patterns of CH4 emissions
were mapped for the whole plain, and then the regional emissions were accumulated for evaluating their contributions to global CH4
inventory.
Results
Validation results and sensitivity factors analysis
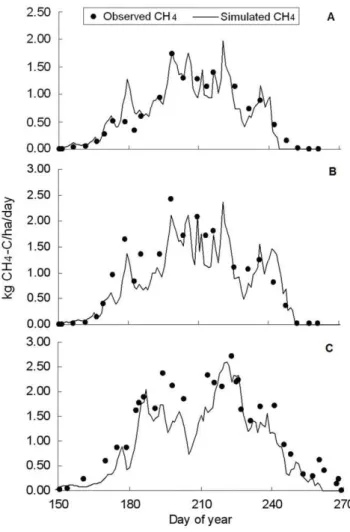
The measured CH4 fluxes at the three treatments mentioned
above were compared with modeled results. Figure 2 shows the comparisons between the modeled CH4fluxes with observations.
As a whole, the modeled results showed a fair agreement with observations although minor discrepancies exist across the three treatments. Results showed that the RMSE values were 0.190, 0.304 and 0.344 for treatment T1, T2 and T3, respectively. The EF values were positive (.0.8), and the CD values were greater than 1 for all the three treatments. Validation test has proved that the DNDC is capable of better capturing the seasonal behaviors of CH4 fluxes from the experimental site within the study area
[41,45].
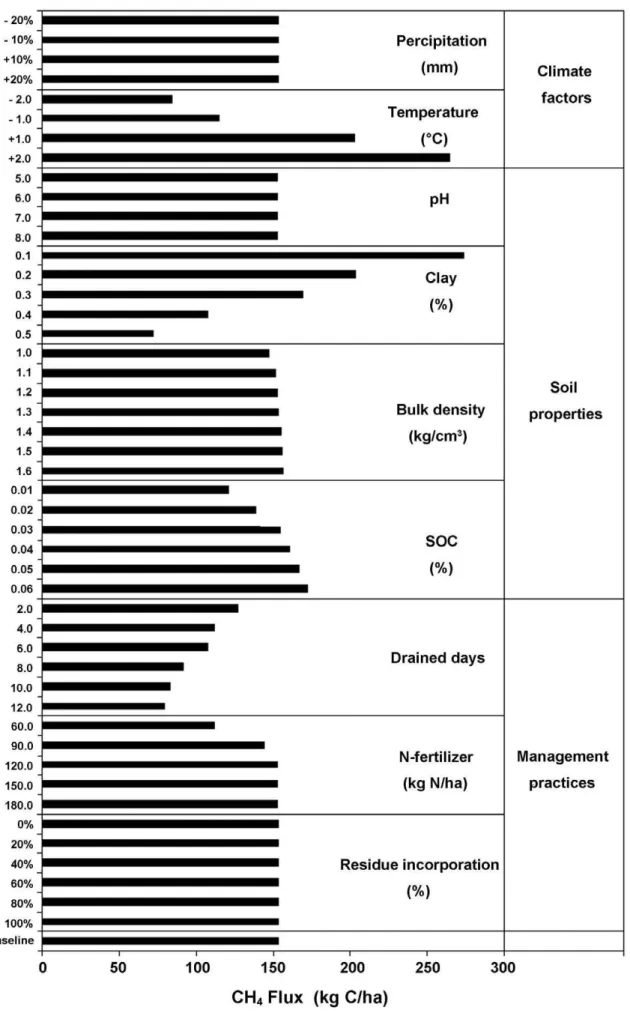
Methane production and oxidation in rice fields are controlled by many factors such as climate variables, soil properties, or agricultural management practices [46]. The sensitivity test provided crucial information for finding out the most sensitive factors from all input parameters, which could affect the modeled results for regional estimations. In the sensitivity test, baseline scenario was first set based on the average climate, soil and management conditions cover the study region. The simulated result from baseline scenario was taken as a benchmark of CH4
emissions for accessing those of other scenarios. And then, within a predefined range, DNDC were performed by varying single one of all input parameters while keeping all other input parameters constant (Table 3). The model responses to changes of these factors on CH4 emission from rice paddies in the TRP were
presented respectively in Fig. 3.
Specifically, the response of CH4emission to changes in climate
factors was investigated by running DNDC using alternative climate scenarios. The modeled results indicated that precipitation changes (620%) have no significant impacts on CH4emissions for
the continuously flooded paddies, whereas the fluctuation of CH4
Table 1.Remotely sensed Landsat TM imagery used for retrieving rice paddy.
Acquisition date
Path/Row No. 1990 2000 2010
113/26 - - 19/09/2010
113/27 19/10/1992 05/09/2002 19/09/2010
113/28 - - 19/09/2010
113/29 - - 19/09/2010
114/27 12/06/1989 11/08/2002 06/06/2010
114/28 16/09/1989 25/09/2001 06/06/2010
114/29 29/09/1988 25/09/2001
-115/27 25/06/1991 12/08/2000 14/09/2009, 17/09/2010
115/28 02/09/1993 12/08/2000 14/09/2009
115/29 17/10/1992 31/08/2001 14/09/2009
116/27 04/09/1991 07/09/2001 08/09/2010
116/28 23/05/1994 07/09/2001 08/00/2010
doi:10.1371/journal.pone.0029156.t001
Table 2.Management practices on the rice paddies in the TRP.
Items 1990 2000 2010
Tillage 5/15: Plow depth of 20 cm 5/15: Plow depth of 20 cm 5/14: Plow depth of 20 cm
Rice cultivation 5/25: transplanting; 9/25: harvesting, grain yield of 2400 kg C/ha
5/25: transplanting; 9/25: harvesting, grain yield of 2700 kg C/ha
5/25: transplanting; 9/25: harvesting, grain yield of 3000 kg C/ha
Flooding 5/15–8/25: Continuously flooding, water depth of 10 cm
5/15–8/25: Continuously flooding, water depth of 10 cm
5/14–8/25: Continuously flooding, water depth of 10 cm
Fertilization 6/1: Urea (24 kg N/ha); 7/1: Urea (36 kg N/ha)
6/1: Urea+Synthetic fertilizer (36 kg N/ha); 7/1: Urea (54 kg N/ha)
1/1: Urea+Synthetic fertilizer (48 kg N/ha); 7/1: Urea (72 kg N/ha)
Manure application No No No
Residues incorporation 10% 10% 10%
emissions incurred by temperature changes (62uC) was remark-able. The higher is temperature, the more CH4emitted from rice
paddy (Fig. 3). Temperature is therefore the most sensitive climate factor. This could be explained that the higher temperature
accelerated the decomposition and fermentation process of soil organic matter (SOM) [47].
The spatial heterogeneity of soil property has a great impact on the pattern of CH4 emission. In this test, four major soil
parameters (soil organic carbon (SOC) content, clay fraction, pH and bulk density) were tested within specific changing range (Fig. 3). Test results indicated that soil clay content was the most sensitive factor, followed by the SOC content. For the anaerobic soil flooded by deepwater, the sandy loam soil was more likely to produce more CH4than the clay loam soil because large porosity
existed in sandy soil could promote CH4transmission and release
from flooded fields. The soil with high SOC content could provide more dissolved organic carbon to the methanogens, which is favorable to CH4 production [25,48–50]. In contrast, CH4
emission was less sensitive to both soil pH and bulk density. Various scenarios on CH4 emissions with three major
management practices (flooding regime, residue incorporation and N-fertilizer application rate) were simulated by DNDC (Fig. 3). There was no significant impact of the incorporation rate of rice straw and residue on CH4emission from the incorporated fields.
In the TRP, rice straw and residue were normally left in fields after rice harvest, no CH4 emitted from the fields which have been
already drained over one month. The nitrogen level meeting the need of the optimal rice-grain production is 120 kg N/ha. CH4
emission increased with increasing N-fertilizer application when the applied amplitude was less than the optimal nitrogen demands for physical development of rice plant. When the application rate reached a level meeting the need for the optimal productivity, additional fertilizer application didn’t make any more impact on CH4 emission. Flooded rice paddy provided favorable
environ-ment for methanogenesis. Mid-season drainage changed the anaerobic status of CH4production, and thus reduced the CH4
emission from rice fields [51–53]. Simulated results showed that for the rice paddy in cool climate region the CH4emission was
reduced by 45% for 10 days draining duration in the peak tillering and early maturity stages. In the perspective of mitigating CH4
emission from rice paddy fields, mid-season drainage would become a potential opportunity through adjusting present management practices.
Changes in rice paddies of the Three-Rivers Plain Three accurate rice paddies maps cover the Three-Rivers Plain were delineated for each decade from 1990 to 2010 from TM images acquired in nominal 1990, 2000 and 2010 (Fig. 4). The rice paddies were mainly distributed in the lowland areas along with
Figure 2. Simulated vs. observed CH4fluxes in validation site. (A) 60 kg N/ha of N-fertilizer application rate in 2004, (B) 150 kg N/ha of N-fertilizer application rate in 2004, (C) 150 kg N/ha of N-fertilizer application rate in 2006. (data from Zhang et al., 2011).
doi:10.1371/journal.pone.0029156.g002
Table 3.Environmental Factors for sensitivity tests.
Environmental Factors Baseline value Range tested
Climate Annual mean temperature (uC) 3.8 1.8–5.8
Total annual precipitation (mm) 550 440–660
Soil Property Clay fraction (%) 0.32 0.1–0.6
Initial soil C fraction (%) 2.78 1.0–6.0
Bulk density (g/cm3) 1.25 1.0–1.6
Soil pH 6.6 5.0–8.0
Management Practices Depth of continuous flooding water (cm) 10 Not varied
Drained days (d) 0 2–12
Residue incorporation (%) 10 0–100
N-Fertilizer application (kg N/ha) 150 60.0–180.0
the major rivers. The extracted total area of paddy fields was 0.23, 1.22 and 1.63 million ha in 1990, 2000 and 2010, respectively. Statistical results showed that the rice area has increased approximate one million ha for the first 10 years (from 1990 to 2000), whereas about 0.4 million ha for the last 10 years (from 2000 to 2010). Although the trend in changes of total area of rice paddies was constant within the TRP, the increment rate was slowing down gradually. The results indicated the change intensity
of land use/covers in the last decade was evidently smaller than the first one, which could be attributed to the limited available lands (reclaimed or converted) for new rice cultivation. From the perspective of spatial distribution, a majority of rice was cultivated in the western and southern lowlands of the plain in 1990. Some small patches of rice fields were sparsely distributed in the eastern of the TRP where the complexity of natural wetlands and drylands existed (Fig. 4 (A)). In contrast, a large amount of drylands have
been extensively cropped as rice paddy since 2000 (Fig. 4 (B and C)). At present, the northeast and southeast have become the major area of rice production for the Three-Rivers Plain. These areas have been playing a role in providing the high quality rice and ensuring food security for the Northern China, as well as the country.
Estimation of CH4emissions for the Three-Rivers Plain
Driven by the three GIS database separately constructed for 1990, 2000 and 2010, DNDC simulated the CH4flux cell-by-cell
across the entire rice fields in the TRP. The total emissions were then calculated by multiplying the modeled flux by rice area in each cell to produce regional CH4 emissions for each simulated
year. The spatial and temporal patterns of CH4 emissions were
mapped cover the domain using GIS tools. Fig. 5 and Fig. 6 showed CH4emission rates and total emissions at the cell scale,
respectively. The two maps showed clear spatial patterns in CH4
emissions across the domain. Detailed descriptions were discussed as below.
In 1990, the simulated CH4 emission rates were 20.46–
175.92 kg C/ha, and the average of 71.05 kg CH4-C were
emitted from one hectare of rice field. Relatively higher CH4flux
(.120 kg CH4-C/ha) was located at a few of soil grid cells sparsely
distributed in the southern tip and northern of the TRP, whereas lower flux (,30 kg CH4-C/ha) were in the most northeastern
(Fig. 5 (A); Table 4). The western and southeastern of the plain, the major rice production area, emitted more CH4 (.200 tons
(1 ton = 1000 kg)) than other areas. The northeastern was a lower emission area (,50 tons per cell) where a large number of farmlands were cropped as dryland crops at that time (Fig. 6 (A)). Significant changes in CH4emission pattern happened in 2000.
Higher CH4flux (.250 kg CH4-C/ha) appeared in the central
and the northern while the northeastern remained lower flux (,100 kg CH4-C/ha) (Fig. 5 (B)). The mean flux reach to 180 kg
CH4-C/ha with large gradient of 34–457 kg CH4-C/ha (Table 4).
Yearly total emission showed that those cells with high CH4
emission (.400 tons) accounted for over 40% of the domain (Fig. 6 (B)).
The recent CH4emission pattern in 2010 was presented in Fig. 5
(C) and Fig. 6 (C). Those cell with higher CH4flux (.250 kg CH4
-C/ha) sparsely distributed over the entire rice paddies, and lower flux (,100 kg CH4-C/ha) in the northeastern kept constant.
Although the simulated emission rates of CH4in 2010 was slightly
less than that in 2000 (Table 4), their patterns in total emission was very comparable (Fig. 6 (C)).
In summary, statistical results indicated that the regional average fluxes were around 71, 137 and 180 kg CH4-C/ha, in
1990, 2000 and 2010, respectively. The average of total CH4
emitted from the entire rice paddies of the TRP was 0.025, 0.211 and 0.203 Tg CH4-C (1 Tg = 109kg) in the three years (Table 4).
Changes analysis for the spatiotemporal pattern in CH4
emission
From the simulated results of the TRP, the highest emission rate was 8–16 times higher than the lowest one in each of the three simulated years (Table 4). Such a huge difference in CH4emission
rate was due to the variations in the soil properties. Past study has demonstrated that those soil cell with lower CH4flux contained
higher clay fraction, and the higher flux normally occurred in those cells with relatively higher SOC content [41]. Consequently, the spatial patterns in CH4 fluxes in this study are mainly
attributed to the Most Sensitive Factor (MSF) of soil properties, i.e. soil clay fraction and SOC content (Fig. 3).
As far as the yearly emissions from paddy cells were concerned, statistics analysis showed that the standard deviation (SD) of CH4
emission was 36.44 tons CH4-C in 1990, which was far less than
that in 2000 and 2010 (258.85 and 245.54 tons CH4-C).
Otherwise, although the minimum of yearly emission were very similar (0.01,0.03 tons CH4-C) for all three simulated years, the
maximum in 2000 and 2010 (.1900 tons CH4-C) were much
more than that in 1990 (,680 tons CH4-C). Therefore, there was
an observable emission variation cross the entire study region in 2000 and 2010 while the character in spatial variation was not distinct in 1990 (Fig. 4). Obviously the clear spatial variation in yearly CH4emissions from cell data was attributed to the spatial
distribution of rice fields.
In Table 4, average CH4emissions (0.025 Tg) in 1990 was far
less than in 2000 and 2010 (.0.2 Tg). The huge difference could be attributed to several reasons. First of all, total area of rice paddies was the primary determinant of total emission. Only 0.23 million ha of rice were planted in 1990. However since 2000, the rice paddy areas have exceeded 1.2 million ha (Fig. 4). Such rapid increase in rice planted area would inevitably lead to the consequential increase in total CH4 emissions. Additionally, the
CH4 emissions rate in 1990 was also smaller than in other
simulated years. This could be firstly related to the fact that more biomass production with more N-fertilizer application. The sensitivity tests have indicated that although the effects of N-fertilizer application rate on CH4 emissions seems not very
evident, it did increase the crop biomass or yields that could indirectly enhance the CH4production. In 1990s, only 60 kg N/
ha of N-fertilizer rate were applied to the rice fields by compared with 90 and 120 kg N/ha of N-fertilizer rate in 2000 and 2010, separately.
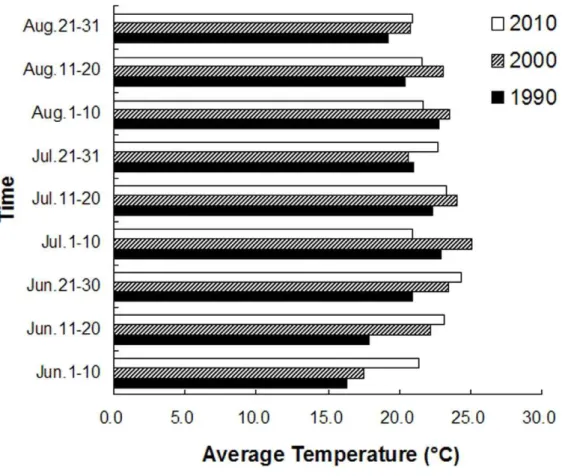
Otherwise, the temperature was a positive climate factor driving CH4 production from rice fields. The emission fluxes
increased with temperature because the higher temperature accelerated soil organic matter (SOM) decomposition and fermentation process, which has been proved in past research [44], and also presented in the sensitivity test (Fig. 3). Although the rice area in 2010 was 30% more than that in 2000, total CH4emissions (0.203 Tg CH4-C) in 2010 was slightly less than
that (0.211 Tg CH4-C) in 2000. The results was largely related
to this fact that higher flux (180 kg CH4-C/ha) in 2000 than
that in 2010 (137 kg CH4-C/ha). By comparing the average of
10-day temperature from rice transplanting to harvesting stage (late May through September), the temperature during the rice-growing season in 2000 was apparently1.13–2.65uC higher than that in 2010 [Fig. 7]. Therefore, the temperature would be taken as a major factor for regional estimation of total CH4
emission from rice paddies at long term and large regional scale.
Discussion
emissions from rice paddies could be an interested topic for researcher in the future.
In our precious study, DNDC upscaling has been utilized to quantify CH4emissions from rice fields of the study area in 2006
after the elaborate calibration and site validation [41]. This
present study extended previous study to multi-temporal CH4
estimation for characterizing spatial and temporal dynamics of CH4emissions over past two decades (from 1990 to 2010). The
modeled average of CH4 fluxes for the simulated year of 1990,
2000 and 2010 was 70, 180 and 137 kg CH4-C/ha, respectively.
These results are comparative with the average emission rates observed and modeled in the Taihu Lake region of Southeast China (15–198 kg CH4-C/ha/year) [27].
In the past studies, a baseline emission factor of 1.30 kg CH4/
ha/day in the 2006 IPCC Guidelines [54] was often
recom-mended to estimate the regional or global CH4emissions from
rice paddies. Thus, With the prevail management practices of 100-day continuously flooded without organic amendments for rice paddies in the TRP, the total CH4emissions based on the
IPCC approach was 0.030, 0.159 and 0.212 Tg CH4-C in the
1990, 2000 and 2010, respectively. Comparative analysis indicated that the simulated values in 1990 and 2010 (0.025 and 0.203 Tg) were slightly less than that of IPCC estimation, whereas the simulated values (0.211 Tg) in 2000 were signifi-cantly larger than the IPCC estimation. In this study, we took into account the integrated influence of various ecological drivers to CH4 emissions from rice paddy. These drivers including
climate, soil and management factor, were applied to drive
DNDC model for regional CH4 estimation. Thus this method
introduced in this study would make great improvement for the CH4estimation compared to the IPCC method based on baseline
emission factor.
Our modeled results further confirmed the high latitude wetland agroecosystems like rice paddy in Northern China was an important anthropogenic CH4 source. With the increase in the
rice-growing area, the rice paddies in the TRP could make more contribution to global CH4inventory. During the period of past
decades in this region, natural swamp wetlands were first converted into dryland croplands and then, into anthropogenic wetlands (rice paddies). This kind of unique changes in land use/ covers would consequentially resulted in huge environmental impacts. A number of ground-based observations on CH4
emissions from natural wetlands have been substantially conduct-ed in the high latitude plain of China [55]. These studies providconduct-ed important supports for regional estimation of CH4emissions with
spatial modeling technology. Thus quantifying the dynamics (i.e. the net increment) of CH4 emissions in the process of land
transformation in this region would be an interested topic for researchers in the future.
During the recent years, China authority has paid more attention to GHG inventory and mitigation. Developing an effective method towards assessing the magnitude of impacts from rice-cropping systems would be significant for meeting the social and research needs. The results in this study demonstrated huge potential of integrating biogeochemical models with RS mapping technology for meeting the environmental challenges rise in coming years in China.
Table 4.Simulated CH4emission rates and total emissions for three simulated year.
Items 1990 2000 2010
Emission rates (kg C/ha) Max. 175.9 457.05 447.52
Min. 20.46 33.96 28.07
Avg. 71.05 180.42 136.85
Total emissions per cell (ton C) Max. 679.2 2563.77 1976.72
Min. 0.01 0.01 0.03
Avg. 36.44 258.85 245.54
SD 73.01 348.92 329.09
Total emissions (Tg C) Max. 0.027 0.228 0.241
Min. 0.022 0.193 0.165
Avg. 0.025 0.211 0.203
doi:10.1371/journal.pone.0029156.t004
Figure 7. Average of 10-day temperature during the rice-growing season.
Author Contributions
Conceived and designed the experiments: YZ. Performed the experiments: YZ SS FZ. Analyzed the data: YZ SS. Contributed reagents/materials/
analysis tools: YZ FZ. Wrote the paper: YZ SS. Provided the funding for the study: RS WG.
References
1. IPCC (2007) Climate Change 2007: The physical science basis. In: Solomon S, Qin D, Manning M, Chen Z, Marquis M, et al. (2007) Contribution of working group I to the fourth assessment report of the Intergovernmental Panel on Climate Change. Cambridge: Cambridge University Press.
2. USEPA (2006) Global anthropogenic non-CO2 greenhouse gas emissions: 1990–2020 (June 2006 Revised), Available: http://www.epa.gov/climate-change/economics/downloads/GlobalAnthroEmissionsReport.pdf via the In-ternet. Washington, DC: Office of Atmospheric Programs, USEPA. 3. Neue HU (1993) Methane emission from rice fields. Biosciences 43: 466–474. 4. Scheehle EA, Kruger D (2006) Global anthropogenic methane and nitrous oxide
emissions. Energy J 22: 33–44.
5. FAO (2011) FAO statistical databases. Available at: http://faostatfaoorg/ (verified in 17 May 2011). Rome.
6. NBSC (2011) China Statistical Yearbook-2010. Beijing: China Statistics Press. 7. Wang MX, Shangguan XJ, Shen RX, Wassmann R, Seiler W (1993) Methane
production, emission and possible control measures in the rice agriculture. Adv Atmos Sci 10: 307–314.
8. Wassmann R, Schuetz H, Papen H, Rennenberg H, Seller W, et al. (1993) Quantification of methane emissions from Chinese rice fields (Zhejiang Province) as influenced by fertilizer treatment. Biogeochemistry 20: 83–101. 9. Cai ZC, Xing GX, Shen GY, Xu H, Yan XY, et al. (1999) Measurements of CH4
and N2O emissions from rice paddies in Fengqiu, China. Soil Sci Plant Nutr 45: 1–13. 10. Cai ZC, Tsuruta H, Minami K (2000) Methane emission from rice fields in China:
measurements and influencing factors. J Geophys Res 105: 17231–17242. 11. Khalil MAK, Rasmussen RA, Wang MX, Ren LX (1991) Methane emission
from rice fields in China. Environ Sci Technol 25: 979–981.
12. Yao H, Zhuang Y, Chen ZL (1996) Estimation of methane emission from rice paddies in Mainland China. Global Biogeochem Cy 10: 641–649.
13. Van Bodegom PM, Scholten JCM (2001) Microbial processes of CH4 production in a rice paddy soil: model and experimental validation. Geochim Cosmochim Acta 65: 2055–2066.
14. Verburg PH, Van Der Gon HACD (2001) Spatial and temporal dynamics of methane emissions from agricultural sources in China. Glob Change Biol 7: 31–47.
15. Verburg PH, van Bodegom PM, van der Gon HACD, Bergsma A, van Breemen N (2006) Upscaling regional emissions of greenhouse gases from rice cultivation: Methods and sources of uncertainty. Plant Ecol 182: 89–106. 16. Anastasi C, Dowding M, Simpson VJ (1992) Future CH4 emission from rice
production. J Geophys Res 97: 7521–7125.
17. Sinha SK (1995) Methane emission from rice paddies: excellent methodology but poor extrapolation. Curr Sci 68: 643–646.
18. Kern JS, Gong Z, Zhang G, Zhuo H, Luo G (1997) Spatial analysis of methane emissions from paddy soils in China and the potential for emissions reduction. Nutr Cycl Agroecosys 49: 181–195.
19. Li CS, Frolking S, Frolking TA (1992) A model of nitrous oxide evolution from soil driven by rainfall events. 2. Model applications. J Geophys Res 97: 9777–9783.
20. Cao M, Dent JB, Heal OW (1995) Modelling of methane emission from rice paddies. Global Biogeochem Cy 9: 183–195.
21. Matthews RB, Wassmann R, Arah J (2000) Using a crop/soil simulation model and GIS techniques to assess methane emsissions from rice fields in Asia, I. Model development. Nutr Cycl Agroecosys 58: 141–159.
22. Cao M, Dent JB, Heal OW (1995) Methane emissions from China’s paddyland. Agric Ecosys Environ 55: 129–137.
23. Cao M, Gregson K, Marshall S, Dent JB, Heal OW (1996) Global methane emissions from rice paddies. Chemosphere 33: 879–897.
24. Bachelet D, Neue HU (1993) Methane emission from wetland rice areas of Asia. Chemosphere 26: 219–237.
25. Li CS, Mosier A, Wassmann R, Cai Z, Zheng X, et al. (2004) Modeling greenhouse gas emissions from rice-based production systems: sensitivity and upscaling. Global Biogeochem Cy 18: GB1043.
26. Pathak H, Li CS, Wassmann R (2005) Greenhouse gas emissions from Indian ricefields: calibration and upscaling using the DNDC model. Biogeosciences 2: 113–123.
27. Zhang L, Yu D, Shi X, Weindorf D, Zhao L, et al. (2009) Quantifing methane emissions from rice fields in the Taihu Lake region, China by coupling a detailed soil database with biogeochemical model. Biogeosciences 6: 739–749. 28. Li CS, Frolking S, Frolking TA (1992) A model of nitrous oxide evolution from
soil driven by rainfall events: I. Model structure and sensitivity. J Geophys Res 97: 9759–9776.
29. Li CS, Frolking S, Harriss RC (1994) Modeling carbon biogeochemistry in agricultural soils. Global Biogeochem Cy 8: 237–254.
30. Giltrap DL, Li CS, Saggar S (2010) DNDC: A process-based model of greenhouse gas fluxes from agricultural soils. Agric Ecosys Environ 136: 292–230.
31. Zhang Y, Li C, Zhou X, Moore III B (2002) A simulation model linking crop growth and soil biogeochemistry for sustainable agriculture. Ecol Model 151: 75–108.
32. Li CS, Qiu J, Frolking S, Xiao X, Salas W, et al. (2002) Reduced methane emissions from largescale changes in water management in China’s rice paddies during 1980–2000. Geophys Res Lett 29: 1972.
33. Cai ZC, Sawamoto S, Li CS, Kang G, Boonjawat J, et al. (2003) Field validation of the DNDC model for greenhouse gas emissions in East Asian cropping systems. Global Biogeochem Cy 17: 1107.
34. Zheng XH, Wang MX, Wang YS, Shen RX, Shangguan XJ, et al. (1997) CH4 and N2O emissions from rice paddies in southeast China. Chin J Atmos Sci 21: 167–174.
35. Babu YJ, Li CS, Frolking S, Nayak DR, Datta A, et al. (2005) Modelling of methane emissions from rice-based production systems in India with the denitrification and decomposition model: field validation and sensitivity analysis. Curr Sci 89: 1904–1912.
36. Babu YJ, Li CS, Frolking S, Nayak DR, Adhya TK (2006) Field validation of DNDC model for methane and nitrous oxide emissions from rice-based production systems of India. Nutr Cycl Agroecosys 74: 157–174.
37. Frolking S, Qiu J, S. B, Xiao X, Liu J, et al. (2002) Combining remote sensing and ground census data to develop new maps of the distribution of rice agriculture in China. Global Biogeochem Cy 16: 1091.
38. Xiao X, Boles S, Liu J, Zhuang D, Frolking S, et al. (2005) Mapping paddy rice agriculture in southern China using multi-temporal MODIS images. Remote Sens Environ 95: 480–492.
39. Takeuchi W, Yasuoka Y, Tamura M (2001) Estimation of Mehtane Emission from Paddy Fields in Central Plain of Thailand by Scaling Technique. In: Proceedings of the 22nd Asian Conference on Remote Sensing, 5–9 November 2001. Singapore 1: 422–427.
40. Salas W, Boles S, Li CS, Babu Y, Xiao X, et al. (2007) Mapping and modeling of greenhouse gas emissions from paddies with satellite radar observations and the DNDC biogeochemical model. Aquat Conserv 17(3): 319–329.
41. Zhang Y, Wang YY, Su SL, Li CS (2011) Quantifying methane emissions from rice paddies in Northeast China by integrating remote sensing mapping with a biogeochemical model. Biogeosciences 8: 1225–1235.
42. Smith P, Smith JU, Powlson DS, McGill WB, Arah JRM, et al. (1997) A comparison of the performance of nine soil organic matter models using datasets from seven long-term experiments. Geoderma 81: 153–225.
43. Shi XZ, Yu DS, Warner ED, Pan XZ, Petersen GW, et al. (2004) Soil database of 1:1,000,000 digital soil survey and reference system of the Chinese genetic soil classification system. Soil Surv Horiz 45: 129–136.
44. Yu DS, Shi XZ, Wang HJ, Sun WX, Chen JM, et al. (2007) Regional patterns of soil organic carbon stocks in China. J Environ Manage 85: 680–689. 45. Wang Y, Chen W, Zhao Z, Gu J (2008) Characteristics and estimation of CH4,
N2O emission from cold paddy field in the Sanjiang Plain. Trans CSAE 24: 170–176.
46. Yan XY, Yagi K, Akiyama H, Akimoto H (2005) Statistical analysis of the major variables controlling methane emission from rice fields. Glob Change Biol 11: 1131–1141.
47. Cao M, Gregson K, Marshall S (1998) Global methane emissions from wetlands and its sensitivity to climate change. Atmos Environ 32: 3293–3299. 48. Yagi K, Minami K (1990) Effect of organic matter application on methane
emission from some Japanese rice fields. Soil Sci Plant Nutr 36: 599–610. 49. Wassmann R, Neue HU, Bueno C (1998) Methane production capacities of
different rice soils derived from inherent and exogenous substrates. Plant Soil 203: 227–237.
50. Holzapfel-Pschorn A, Seiler W (1986) Methane emission during a cultivation period from an Italian rice paddy. J Geophys Res 91: 11803–11814. 51. Sass RL, Fisher FM, Wang YB, Turner FT, Jund MF (1992) Methane emission
from rice fields: The effect of flood water management. Global Biogeochem Cy 6: 249–262.
52. Yagi K, Tsuruta H, Kanda K, Manami K (1996) Effect of water management on methane emission from a Japanese rice field: Automated methane monitoring. Global Biogeochem Cy 10: 255–267.
53. Li CS, Salas W, DeAngelo B, Rose S (2006) Assessing alternatives for mitigating net greenhouse gas emissions and increasing yields from rice production in China over the next 20 years. J Environ Qual 35: 1554–1565.
54. IPCC (2006) 2006 IPCC Guidelines for National Greenhouse Gas Inventories. In: Eggleston HS, Buendia L, Miwa K, Ngara T, Tanabe K, eds. Prepared by the National Greenhouse Gas Inventories Programme. Hayama: the Institute for Global Environmental Strategies (IGES).