Recebido para publicação em 16/9/2008 Aceito para publicação em 25/9/2009 (003811)
1 Ciências e Tecnologia de Alimentos, Universidade Federal da Paraíba – UFPB, CEP 58059-900, João Pessoa - PB, Brasil, E-mail: edvaldovasconcelos@ufrnet.br 2 Departamento de Nutrição,Universidade Federal da Paraíba – UFPB, CEP 58059-900, João Pessoa - PB, Brasil
3 Universidade Federal de Pernambuco – UFPE , CEP 58059-900, João Pessoa - PB, Brasil 4 Universidade Federal da Paraíba – UFPB, CEP 58059-900, João Pessoa - PB, Brasil *A quem a correspondência deve ser enviada
Effect of the daily consumption of ostrich and
bovine meat on the lipid metabolism in rats
Efeito do consumo diário de carne de avestruz e bovina no metabolismo de lipídios em ratos
Edvaldo Vasconcelos de CARVALHO-FILHO1*, Maria José Carvalho da COSTA2,
Francisca Martins BION3, João Andrade da SILVA4
1 Introduction
Meat is a relevant component in the feeding of several populations. The consumption of specific cuts or lean preparations has been currently recommended by the specific literature, as well as the consumption in alternate days, with the objective of preventing against diseases especially cancer and cardiovascular diseases (LAWRENCE et al., 2006).
The increase on the life expectancy of a population is directly related with the prevention of cardiovascular diseases, healthy lifestyle, including physical activity and appropriate feeding (ORGANIZAÇÃO..., 1992).
In search of an alternative consumption of good-quality proteins, one observes that the interest for the consumption of
ostrich meat has increased progressively in many countries from Europe, in the USA, and also in Brazil due to speculations about its healthier characteristics in relation to that conventionally consumed.
This may be occurring because ostrich meat stands out for presenting low fat percentages when compared to other meats such as pork, beef, and chicken (SALES et al.,1999).
The knowledge concerning the nutritional components that influence the quality of the ostrich meat is still scarce, and further researches should be performed in order to explain the benefits one obtains with the consumption of this meat (COOPER; HORBANCZUK, 2002).
Resumo
Avaliar o efeito do consumo diário de carne de avestruz (lliofemuralis internus) e carne bovina (Psoas major) no metabolismo de lipídios de ratos adultos. Foram realizadas as análises da composição centesimal das carnes e preparo das dietas seguindo as recomendações do American Institute of Nutrition-AIN-93. Em seguida, três grupos de animais – grupo I (dieta I, com caseína), grupo II (dieta II, com carne de avestruz), grupo III (dieta III, com carne bovina) – com 150 dias de vida foram alimentados por um período de 13 semanas com as respectivas dietas e, então, avaliados quanto ao ganho de peso e coeficiente de eficiência alimentar, colesterol total e frações lipoproteicas, transaminases hepáticas e o percentual de gordura corporal e hepática. Nenhuma diferença (p < 0,05) foi encontrada para ganho de peso e para o coeficiente de eficiência alimentar entre os grupos. Colesterol total, HDL-colesterol, LDL-colesterol, relação colesterol/HDL-colesterol total, VLDL, triglicerídeos e as transaminases hepáticas não foram diferentes entre grupos (p < 0,05). Esta pesquisa sugere que o consumo de carne de avestruz ou carne bovina magra todos os dias não eleva preocupações em relação ao ganho de peso, aumento nas lipoproteínas do plasma e níveis de transaminase hepáticas.
Palavras-chave: carne de avestruz; carne bovina; ácidos graxos; lipoproteínas; transaminases hepáticas. Abstract
The objective of this study is to evaluate the effect of the daily consumption of ostrich meat (lliofemuralis internus) and bovine meat (Psoas major) on the lipid metabolism in adult mice. The analyses of the centesimal composition of the meats and preparation of the diets were accomplished following the recommendations of the American Institute of Nutrition-AIN-93. Three groups of 150 day-old animals: group I (diet I, with casein), group II (diet II, with ostrich meat), and group III (diet III with bovine meat) were fed for 13 weeks with the respective diets and weight gain, food efficiency coefficient, total cholesterol, lipoprotein fractions, hepatic, transaminases and body fat percentage and hepatic fat content were evaluated. No difference (p < 0.05) it was found for weight gain and coefficientsforfeed efficiency among the groups. Total cholesterol, HDL-cholesterol, LDL-cholesterol, relationship of total cholesterol/HDL-cholesterol, VLDL, triglycerides and hepatic transaminases were also not different among the groups (p < 0.05). This research suggests that the consumption of ostrich meat or thin bovine meat on a daily basis does not raise concerns about weight gain, and an increase in the plasma concentrations of lipoprotein and levels of hepatic transaminase.
Keywords: ostrich meat; beef; fatty acids; lipoprotein; hepatic transaminases.
4 kg of capacity and 0.01 g sensibility, from 7 to 9 AM. The diet consumption was recorded and the alimentary effectiveness coefficient was calculated (CAMPBELL, 1963).
2.6 Analysis of plasma lipoproteins and hepatic transaminases
At the end of the 240 days of experiment and after a 12-hour fasting period, the animals were anesthetized with ethylic ether (CH3CH2)2O and sacrificed inside the laboratory hood chapel. The blood was removed through the heart puncture technique for the performance of the biochemical analyses. The blood samples used in the biochemical analyses were transported under refrigeration.
The Total Cholesterol plasmatic content (CT), HDL-cholesterol (HDL-C), VLDL-cholesterol (VLDL-C), LDL-cholesterol (LDL-C), and triglycerides (TG) were determined using enzymatic reagent kits (Biolab Mêrieux®). The CT/HDL-C ratio was also calculated. The serum aspartate aminotransferase (AST ratio) and alanine aminotransferase ratio (ALT ratio) were also determined (REITMAN; FRANKEL, 1957). The analyses were performed using a reagent kit (Biolab Mêrieux®).
2.7 Determination of body and hepatic fat
After the sacrifice of the animals, the entire gastrointestinal tract, the carcass, and liver were removed and frozen. Following, the material was individually ground in a mill (Skymsen pcp22l) and stored at –25 °C. The body and hepatic lipid contents were determined through continuous extraction using the dry-base Soxhlet method (AOAC, 2000).
2.8 Statistical analysis
For the normality analysis of data, the Kolmogorov-Smirnov (KS) adherence test was applied, and the Levene test was applied to evaluate homogeneity. For the analysis of data, the Analysis of Variance (ANOVA) was applied to evaluatethe statistical significance of between-groups, Tukey test, at a significance level of 5%, was applied when difference was verified. The statistical package used was the Sigma Stat version 3.1.
3 Results and discussion
3.1 Effect of the consumption of ostrich and bovine meat on weight gain and food efficiency coefficient evaluations
During the entire experimental period, no significant difference was observed (p < 0.05) for the weekly ration consumption between groups I, II, and III. The consumption of Group I was of 20.90 ± 9.87 g/day, on average; Group II consumed 21.32 ± 4.32 g/day and Group III 20.83 ± 5.60 g/day, on average.
Pierre et al. (2004) studying the consumption of bovine and chicken meat in mice and the interaction in the organism of the animals, it was also observed that there was no difference in the consumption of bovine and chicken meat when compared with Considering the constant search for healthier foods
and the introduction of the ostrich meat in the market, the objective of this work is to evaluate the interactions between the nutritional components of this meat when compared to beef, widely consumed by the population, and its effects on the lipid metabolism in rats.
2 Materials and methods
2.1 Centesimal composition of ostrich and bovine meat
The centesimal composition of ostrich and bovine meat was determined by means of humidity, fixed mineral residue (FMR), lipids, and protein analyses(AOAC, 2000).
2.2 Quantification and identification of fatty acids in ostrich and bovine meat
For the quantification and identification of fatty acids, fat was extracted according to Folch, Less and Stanley (1975) and the methylic esters were obtained from esterification proposed by Hartman and Lago(1973). The fatty acids were identified and quantified by means of gas chromatography in a chromatographic column (CG MASTER). The separation occurred in a capillary column (HP-Carbowax 20M, 30 m × 0.53 mm × 1 m) packed with polyethylene glycol and an H2 mobile phase. The fatty acids characterization was performed through the comparison of the retention time and the unknown peak area with the retention time and standard peak area using methylic esters (MERCK®).
2.3 Determination of the cholesterol content of ostrich and bovine meat
The cholesterol content was determined through colorimetry by means of spectrophotometry (Micronal B395) (BRAGAGNOLO; RODRIGUEZ-AMAYA, 2001).
2.4 Biological experimentation
Throughout the experiment, Forty two 150-day old male Wistar rats (Rattus norvegicus, var. albino) with an average weight of 435 ± 2 g were used. The animals were distributed into three groups and received the following diets: group I-control (Diet I, with casein), group II (Diet II, with ostrich meat), and group III (Diet III, with beef). The macro and micronutrient contents of group I, II, and III diets were calculated and balanced according to Reeves, Nielsen and Fahey (1993), Table 1.
The animals were maintained in individual cages with water and ration ad libitum, temperature of 22 ± 1 °C, 12-hour photoperiod, and diets administered for a period of 13 weeks. This research has been previously approved by the Ethics Committee for Animal use in Research – CEPA – Paraíba Federal University-Brazil under number 0203/06.
2.5 Weight gain and food efficiency coefficient evaluations
It was observed that the food efficiency coefficient values were similar for the three nutritional conditions (diets I, II, and III) with no significant difference, even with the distinct protein and lipid sources in the diets, which may be justified due to the isoproteic, isolipidic, isoglycidic, and isocaloric characteristic of the diets. Diniz et al. (2004) conducted a research with rats using diets rich in AGP and AGS and concluded that the group that presented the highest food efficiency coefficient value consumed diet rich in AGP, which was not observed in this study.
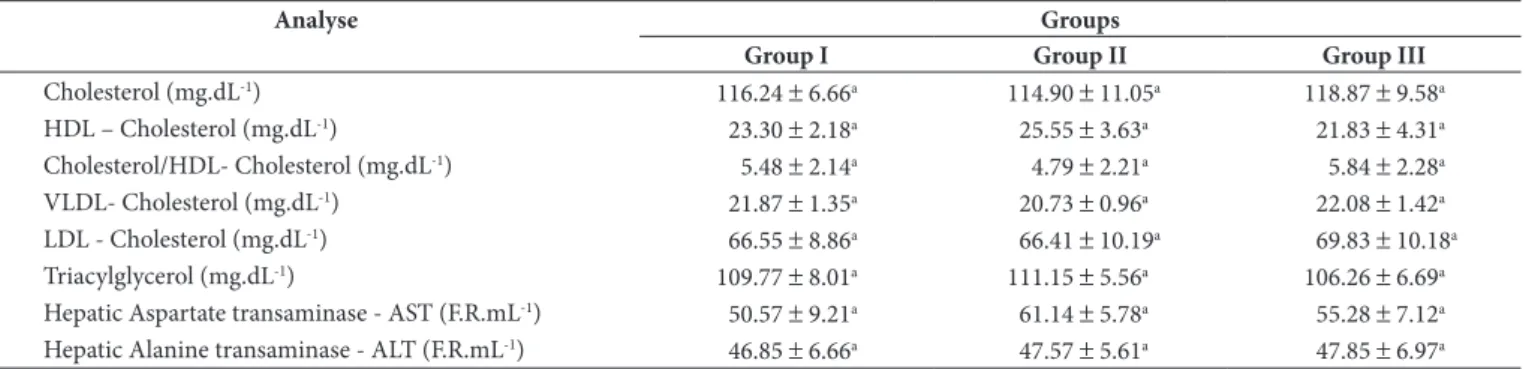
3.2 Effect of different diets on lipoprotein and hepatic transaminase values
With regard to CT, HDL-C, CT/HDL ratio, VLDL-C, LDL-C, and TG parameters, no statistical differences were observed between the groups studied. No significant difference was observed (p < 0.05) for AST and ALT values between the groups either (Table 2).
Fats containing saturated acids are invariably more hypocholesterolemic (SILVA et al., 2005). Animals that consumed diet I, in which the lipid source was soybean oil and casein was the protein source, with low contents of these saturated fatty acids, did not present different CT, LDL-C, HDL-C, and VLDL-C values in relation to group II, diet with ostrich meat, and group III, diet containing beef.
In studies with rats ingesting diets with casein as the only source of protein, soybean oil, olive oil, canola oil, and pork fat as source of fat in the concentration of 7% in the different groups, it was observed that the animals fed with diet containing soybean oil did not present smaller CT in relation to the other groups (MORAIS et al., 2003), which was also observed in this experiment.
the group control that was fed a diet containing casein, which was also found in the present study
Sesink et al. (1999) also studied meat consumption and its interactions in the male organism of mice. The authors did not find any difference in relation to the diet consumption either; those results are consistent with the results found in this study.
In the weekly weight gain analysis, no significant difference was detected between the groups studied. At the end of the experimental period, group I gained 95.05 g, group II 72.88 g, and group III 99.59 g of weight.
During the entire experimental period, the weekly food ingestion (g) and body weight gain (g) were evaluated. According to the results obtained, no significant difference was observed between the groups in terms of food efficiency coefficient evaluations. At the end of the experiment, group I, II, and III presented food efficiency coefficient values of 0.66 g.g–1, 0.60 g.g–1, and 0.75 g.g–1, respectively.
The maintenance of the ideal body weight is a decisive factor for good nutrition, welfare, and better quality of life. Evaluating the individual consumption of a diet rich in AGS and another in AGP, Diniz et al. (2004) concluded at the end of the experiment that the group that gained more weight was the one that consumed diet rich in AGP, which was not found in this study.
Brandsch et al. (2006) evaluated the weight gain of three groups of animals that consumed diets containing pork, bovine, and turkey. No differences of weight gain were found for the groups studied when compared to the diet pattern (casein); similar result was found in this research.
Table 1. Diets of the groups I, II and III.
Component (g.100 g-1) Group I Group II Group III
Casein 13.02 = 12% protein -
-Ostrich meat - 15.97 = 12% protein
-Beef - - 16.27 = 12% protein
Vegetal oil (soybean) 4.00 2.79 2.06
Lipids of meats - 1.21 1.94
Cellulose 5.00 5.00 5.00
Saline mixture 3.50 3.50 3.50
Vitamin mixture 1.00 1.00 1.00
Choline bitartrate 0.25 0.25 0.25
DL-methionine 0.18 -
-Starch 73.44 72.12 72.56
Cholesterol mg.100 g-1 - 24.65 26.13
Saturated Fatty Acid (SFA) 0.64 0.98 1.62
Monounsaturated Fatty Acids 0.96 1.17 1.11
Polyunsaturated Fatty Acids (PUFA) 2.23 1.82 1.27
AGP/AGS Ratio 3.48 1.86 0.78
ω 6: ω 3 Ratio 6.43:1 6.81:1 7:1
Total energy value (kcal) 348.40 343.64 345.24
substituted for a four-week diet of chicken meat (second stage), and then it was substituted for a diet without meat (third stage). They observed that the value of HDL-C did not present statistical difference among the last two stages of the research although a slight statistical difference (p = 0.048) was verified after the consumption of red meat, which corroborates our findings in which the HDL- C of the groups fed ostrich and bovine meat did not differ from that of the control group fed a casein diet.
The results of our research and those of other authors generate the following discussions: Do “the individuals that do not consume meat present a better lipid profile than that of those who consume it?
Will it be that the consumption of thin red meat is always the main collaborator for the increase of CT and fractions in a diet? This study demonstrates that the consumption of red meat only is not decisive for the increase of total cholesterol and its fractions.
LDL-C is one of the most important lipoproteins in the proaterogenic process. The ingestion of AGM and AGP can possibly reduce the LDL-C value (STEINBERG, 2005). The animals that consumed diets I, II, and III presented similar LDL-C values, even with the different AGM and AGP concentration in their diets.
Two groups of animals consumed diets containing soybean oil as source of lipids and the other group was fed with a diet containing animal-origin components, both with a concentration of 7%. It was observed that the group fed the diet that contained soybean oil as source of lipids presented higher LDL-C and VLDL-C values at the end of the experiment (MORAIS et al., 2003), which was not observed in this research in which there was no significant difference between the groups for these lipoproteins.
According to some authors, diets rich in ω-6 and ω-3 may reduce the LDL-C level in the blood plasma (ZHENG; AVELLA; BOTHAM, 2001). It was observed that groups I and II consumed diets with a smaller proportion for this ratio in relation to group III; however this difference was not statistically significant to influence the lipoproteins values, including LDL-C, in this experiment.
One of the reasons that could have influenced the lipid metabolism would be the time of the experiment and age of the animals. Carring out studies on rats, Lacko and Davis (1979) found that the there was no difference in the level of total cholesterol in the period between 2 and 12-month experimental period, but after 24 months of experiment, the cholesterol level changed, which was not found in this study.
Gill (1989), in experiments with mice demonstrated that the animals do present a resistance to alterations of total cholesterol and fractions with a long time of experimentation, mainly mice that are not in the senescence period.
This demonstrates that the time of experimentation in this work might have influenced slightly the total cholesterol and fractions in mice, which leads us to believe that the quality of the diet can be a more contusing factor in relation to those alterations than the time of experiment used in this work.
The high AGP/AGS ratio may reduce the plasmatic lipid levels (CHEN; TSAI, 1995), which was not observed in the comparison between groups I, II, and III, in which the diet consumed by group I presented higher value for this ratio when compared to groups II and III; however, this difference was not capable of influencing the plasmatic lipid values significantly.
Szeto et al. (2004) studied healthy individuals who consumed diet with and without meat and did not find differences between the CT blood values; those results are similar to those found in this research using rats.
In another research with rats, no significant difference was found for CT, LDL-C, HDL-C, and VLDL-C values using diets containing meat from different species (ox, pork, and turkey) when compared to rats using diet containing only casein (BRANDSCH et al., 2006).
HDL-C plays an important role in the transport of the excess of cholesterol from the extra-hepatic tissues back to the liver, through which it is excreted as bile (SCHIAVO; LUNARDELLI; OLIVEIRA, 2003). The HDL-C levels are inversely associated with the incidence of heart diseases among middle-aged individuals (CURB et al., 2004).
Mello et al. (2006) studying the consumption of a diet containing red meat (first stage), which was soon afterwards
Table 2. Concentration of plasma lipids and hepatic transaminases in rats from groups I, II and III.
Analyse Groups
Group I Group II Group III
Cholesterol (mg.dL-1) 116.24 ± 6.66a 114.90 ± 11.05a 118.87 ± 9.58a HDL – Cholesterol (mg.dL-1) 23.30 ± 2.18a 25.55 ± 3.63a 21.83 ± 4.31a Cholesterol/HDL- Cholesterol (mg.dL-1) 5.48 ± 2.14a 4.79 ± 2.21a 5.84 ± 2.28a VLDL- Cholesterol (mg.dL-1) 21.87 ± 1.35a 20.73 ± 0.96a 22.08 ± 1.42a LDL - Cholesterol (mg.dL-1) 66.55 ± 8.86a 66.41 ± 10.19a 69.83 ± 10.18a Triacylglycerol (mg.dL-1) 109.77 ± 8.01a 111.15 ± 5.56a 106.26 ± 6.69a Hepatic Aspartate transaminase - AST (F.R.mL-1) 50.57 ± 9.21a 61.14 ± 5.78a 55.28 ± 7.12a Hepatic Alanine transaminase - ALT (F.R.mL-1) 46.85 ± 6.66a 47.57 ± 5.61a 47.85 ± 6.97a
from the incapacity of the liver in converting the cholesterol in bile acids as a function of the amount and quality of the lipids in the diet (SUGIYAMA; YAMAKAWA; KUMAZAWA, 1997). It can be observed in this study, that there was not difference (p < 0.05) of the liver fat percentage of group II that consumed diet with ostrich meat and group III that consumed diet with bovine meat compared with group I (control) that consumed diet with casein, as observed in Table 2. This indicates that the ingestion of red meat in this experiment did not influence fat accumulation in the liver during the experimental period used in this study.
4 Conclusions
Using this experimental model in which animals were fed with diets containing ostrich meat and bovine meat showed that there were not significant changes in the lipid metabolism in the consumption of both diets. This research suggests that the consumption of ostrich and bovine meat does not raise concerns about increasing the plasma concentrations of lipoprotein and the levels of hepatic transaminase. Therefore, the consumption of red meat is not the main factor for the occurrence of cardiovascular diseases.
References
ASSOCIATION OF OFFICIAL ANALYTICAL CHEMISTS. Official
Methods of Analysis of AOAC International. 17th ed. 2000. v. 2.
BRAGAGNOLO, N.; RODRIGUEZ-AMAYA, D. B. Determinação de colesterol em carne: comparação de um método colorimetrico e
um método por cromatografia líquida de alta eficiência. Revista
do Instituto Adolfo Lutz, v. 60, n. 1, p. 53-57, 2001.
BRANDSCH, C. et al. Effect of proteins from beef, pork, and turkey meat on plasma and liver lipids of rats compared with casein and
soy protein. Journal of Nutrition, v. 22, p. 1162-1170, 2006.
CAMPBELL, J. A. Method for determination of PER & NPR. In:
COMMITTEE ON PROTEIN MALNUTRITION. Food and
nutrition board. Evaluation of protein quality. Washington, 1963. p. 31-32.
CHEN, P. R.; TSAI, C. E. Various high monosatured edible oils might
affect plasma lipids differently in mam. Nutrition Research, v. 15,
n. 5, p. 615-621, 1995.
COOPER, R. G.; HORBANCZUK, J. O. Anatomical and physiological characteristics of ostrich (Struthio camelus var. Domesticus) meat
determine its nutritional importance for man. Journal of Animal
Science, v. 73, n. 3, p. 163-173, 2002.
CURB, J. D. et al. A prospective study of HDL-C and cholesteryl ester
transfer protein gene mutations and the risk of coronary heart
Analyzing the results of 14 studies published from 1983 to 1994 and comparing diets enriched with AGM with diets containing AGP, it was observed that both diets resulted in similar effects on the CT, LDL-C and HDL-C percentages suggesting that the hypocholesterolemic effects of these two groups of fatty acids are comparable (LOPEZ-MIRANDA et al., 2006). According to the results of this research, it is possible to conclude that the same might have occurred with groups I, II, and III, in which the diet of group I presented a higher percentage of AGP, and the groups II and III presented higher percentage of AGM. However, no differences were detected in the lipoproteins in these groups. It is worth emphasizing the strong epidemiological association between the CT/HDL-C ratio and the prevalence of heart diseases (WILDMAN; MEDEIROS, 2004).
In several observational studies, a positive association between hypertriglyceridemia and heart diseases and mortality rate was found (POZZAN et al., 2004).
In an experimental study, the elevation of the triglycerides content in the blood serum associated to the increase on the risk of coronary diseases was investigated, and it was concluded that high triglycerides levels in the serum are associated with four pathological conditions that accelerate arteriosclerosis, namely: decrease in the serum HDL-C levels; increase in the remaining lipoproteins; small elevation in LDL-C; and increase in the thrombosis conditions (NAKAYA, 2002).
The relationship between triglycerides levels and the development of the coronary disease is still unclear. The main point is whether triglycerides are the direct cause of arteriosclerosis or whether they are just markers of other risk conditions (OBERMAN, 2000).
The increase in the triglycerides level may be associated with the composition of amino acids of the meat and casein consumed by rats, in other words, meat contains 80% more alanine, arginine, cistein and glycine, on average, and 30% less phenylalanine, proline, serine, and tyrosine, when compared with casein, and this difference may influence the triglycerides level (SUGIYAMA; YAMAKAWA; KUMAZAWA, 1997), which was not observed in this study in which ostrich meat, beef, and casein were consumed and the TG value presented no differences between the groups studied.
The AST and ALT values may be considered as parameters to evaluate the hepatic function (McAVOY et al., 2006). It could be observed in this experiment that the consumption of a diet with ostrich meat or beef associated to the consumption of a casein-based diet by rats did not interfere significantly in the values of these hepatic transaminases.
3.3 Body and hepatic fat
With regard to body and hepatic fat of groups I, II, and III analyzed on a Dry-Basis, it can be observed in Table 3 that there was no significant difference (p < 0.05) between these groups.
The analysis of the liver fat percentage can clearly demonstrate the fat storage in the organ and/or the inability to convert cholesterol into bile acids that can happens resulting
Table 3. Body and hepatic fat values of animals from groups I, II and III.
Groups Body fat (g.100 g-1) Fat weight (g.100 g-1) I 50.51 ± 9.76a 31.13 ± 13.49a II 50.23 ± 5.58a 27.99 ± 9.27a III 51.03 ± 4.36a 28.24± 10.83a
1Values of average ± sem, n = 12; 2different small letters at the same line characterize
Crypt Foci in Rat Colons. Journal of Nutrition, v. 134, n. 10, p. 2711-2716, 2004.
POZZAN, R. et al. Dislipidemia, síndrome metabólica e risco cardiovascular. Revista da Socerj, v. 17, n. 2, p. 97-104, 2004. REEVES, P. G.; NIELSEN, F. H.; FAHEY, G. C. AIN-93: Purified
diets for laboratory rodents: final report of the American Institute of Nutrition ad hoc Writing Committee on the Reformulation of the AIN-76A Rodent Diet. Journal of Nutrition, v. 123, n. 11, p. 1939-511993.
REITMAN, S.; FRANKEL, S. A colorimetric method for the determination of serum glutamic oxalacetic and glutamic pyruvic transaminases. American Journal of Clinical Pathology, v. 28, n. 1, p. 56-63, 1957.
SALES, J et al. Carcass characteristics of emus (Dromanius novaehol-landiae). British Poultry Science,v. 40, n. 1, p. 145-147, 1999. SCHIAVO, M.; LUNARDELLI, A.; OLIVEIRA, J. R. Influência da
dieta na concentração sérica de triglicerídeos. Jornal Brasileiro de Patologia e Medicina Laboratorial, v. 39, n. 4, p. 283-288, 2003. SESINK, A. L. A. et al. Red Meat and Colon Cancer: The Cytotoxic
and Hyperproliferative Effects of Dietary Heme1. Cancer Research, v. 59, n. 22, p. 5704-5709, 1999.
SILVA, A. P. et al. Ácidos graxos plasmáticos, metabolismo lipídico e lipoproteínas de ratos alimentados com óleo de palma e óleo de soja parcialmente hidrogenado. Revista de Nutrição, v. 18, n. 2, p. 229-237, 2005.
STEINBERG, D. An interpretive history of the cholesterol controversy, part III: mechanistically defining the role of hyperlipidemia. Journal of Lipid Research, v. 46, n. 10, p. 2037-2051, 2005.
SUGIYAMA, K.; YAMAKAWA, A. A.; KUMAZAWA, S. S. Methionine content of dietary proteins affects the molecular species composition of plasma phosphatidylcholine in rats fed a cholesterol-free diet.
Journal of Nutrition, v. 127, n. 4 p. 600-607, 1997.
SZETO, Y. T. et al. Effect of a long-term vegetarian diet on biomarkers of antioxidant status and cardiovascular disease risk. Journal of Nutrition, v. 20, n. 10, p. 863-866, 2004.
WILDMAN, R. E. C.; MEDEIROS, D. M. Advenced human nutrition. Modern Nutrition, 2004.
ZHENG, X.; AVELLA, M.; BOTHAM, K. M. Comparison of the effects of dietary n-3 and n-6 polyunsaturated fatty acids on very-low-density lipoprotein secretion when delivered to hepatocytes in chylomicron remnants. Biochemical Journal, v. 357, n. 2, p. 481-487, 2001.
disease in the elderly. Journal of Lipid Research, v. 45, p. 948-953, 2004.
DINIZ, S. Y. et al. Diets rich in saturated and polyunsaturated fatty acids: metabolic shifting and cardiac health. Journal of Nutrition, v. 20, n. 2, p. 230-234, 2004.
FOLCH, J.; LESS, M.; STANLEY, S. A simple method for the isolation and purification of total lipids from animal tissues. Journal of Biological Chemistry, v. 226, n. 1, p. 497-509, 1957.
GILL, T. J. et al. The rat as an experimental animal.Science,v. 245, n. 4915, p. 269-27621, 1989.
HARTMAN, L.; LAGO, R. C. Rapid preparation of fatty acid methyl esters from lipids. Laboratory Practice, v. 22, n. 6, p. 475-476, 1973. LACKO, A. G.; DAVIS, J. L. Age-related changes in rat and primate
plasma cholesterol metabolism. Journal of the American Geriatrics Society, v. 27, n. 5, p. 212-217, 1979.
LAWRENCE, H. K. et al. American cancer society guidelines on nutrition and physical activity for cancer prevention: reducing the risk of cancer with healthy food choices and physical activity.
CA: A Cancer Journal for Clinicians, v. 56, n. 2, p. 254-281, 2006. LOPEZ-MIRANDA, J. et al. Monounsaturated fat and cardiovascular
risk. Nutrition Reviews, v. 64, n. 2, p. 1-12, 2006.
McAVOY, N. C. et al. Non-alcoholic fatty liver disease: natural history, pathogenesis and treatmente. The British Journal of Diabetes and Vascular Disease, v. 6, n. 6, p. 251-260, 2006.
MELLO, V. D. F. et al. Withdrawal of red meat from the usual diet reduces albuminuria and improves serum fatty acid profile in type 2 diabetes patients with macroalbuminuria. American Journal of Clinical Nutrition, v. 83, n. 5, p. 1032-1038, 2006.
MORAIS, C. S. N. et al. Efeito das fontes e níveis de lipídios nas dietas de ratos machos da linhagem wistar (Rattus norvegicus) sobre frações lipídicas no sangue. Ciência Agrotécnica, v. 27, n. 5, p. 1082-1088, 2003.
NAKAYA, N. Hypertriglyceridemia as a cause of atherosclerosis.
Nippon Rinsho, v. 60, n. 5, p. 860-867, 2002.
OBERMAN, A. Hypertriglyceridemia and coronary heart disease.
Journal of Clinical Endocrinology & Metabolism, v. 85, n. 6, p. 2098-3105, 2000.
ORGANIZAÇÃO MUNDIAL DA SAÚDE - OMS. Prevention of coronary heart disease, report of a Who Expert Committee. Geneva, 1992. p. 53.