In-house validation of a method for determining
aflatoxins B
1, B
2, G
1and G
2in wheat and wheat by-products
1Felipe Machado Trombete2, Thaís Barbosa Santos2, Glória Maria Direito3, Marcelo Elias Fraga3, Tatiana Saldanha2
INTRODUCTION
Wheat (Triticum aestivum L.) is a cereal cultivated worldwide and has great importance in the human diet, contributing as a direct source of energy, protein, vitamins, minerals and fiber (Karl et al. 2012,
ABSTRACT
RESUMO
McKeown et al. 2013). Almost all wheat grains are intended for the production of flour, typically used in the preparation of breads, pastas and cakes. The bran originating from its processing has high fiber content and it is widely consumed, either directly or as an ingredient in prepared foods (Embrapa 2013).
1. Article received in Jul./2013 and accepted for publication in Jul./2014 (Registration number: PAT 25449).
2. Universidade Federal Rural do Rio de Janeiro (UFRRJ), Departamento de Tecnologia de Alimentos, Seropédica, RJ, Brasil.
E-mails: felipetrombete@gmail.com, tha-bs@hotmail.com, tatysal@gmail.com.
3. Universidade Federal Rural do Rio de Janeiro (UFRRJ), Departamento de Microbiologia e Imunologia Veterinária,
Aflatoxins are naturally occurring carcinogenic substances, extremely toxic to humans, which have been
identified in wheat and wheat by-products. The use of reliable analytical methods to evaluate and monitor such
contaminants is extremely important. This study aimed to in-house validate a methodology to determine aflatoxins B1, B2,
G1 and G2 in wheat grains using pre-column derivatization and
quantification by High Performance Liquid Chromatography with fluorescence detection (HPLC-FLD). Three methods
were evaluated and the most suitable one was the method
based on the extraction with chloroform, removal of interfering chemicals by filtration, liquid-liquid partition with hexane-methanol-water and methanol-water-chloroform and pre-column derivatization with trifluoroacetic acid. The
method showed a Relative Standard Deviation lower than 15% and recovery values in the 70-110% range, with limits
of detection and quantification (0.6 µg kg-1 and 1.2 µg kg-1, respectively) below the maximum level of aflatoxins allowed
in wheat and wheat by-products by the European Commission
(4.0 µg kg-1) and by the Brazilian legislation (5.0 µg kg-1). Using the validated method, aflatoxins were quantified in
20 commercial samples of wheat grains, wheat bran, whole
wheat flour and refined wheat flour intended for direct human consumption. Six samples (30%) were positive for aflatoxins and all samples presented levels below the maximum limit stipulated by the Brazilian legislation.
KEY-WORDS:Triticum aestivum L.; Aspergillus; mycotoxins;
wheat bran; whole wheat flour.
Validação intralaboratorial de metodologia para determinação de aflatoxinas B1, B2, G1 e G2 em trigo e
produtos derivados
Aflatoxinas são substâncias carcinogênicas de ocorrência natural, extremamente tóxicas para humanos, que têm sido identificadas no trigo e em produtos derivados. O uso de métodos analíticos confiáveis para avaliar e monitorar tais contaminantes
é de grande importância. Este trabalho objetivou validar, intralaboratorialmente, uma metodologia para a determinação
de aflatoxinas B1, B2, G1 e G2, em grãos de trigo, utilizando derivatização pré-coluna e quantificação por Cromatografia Líquida de Alta Eficiência com detecção por fluorescência (CLAE-DF). Três
metodologias foram avaliadas e a que se adequou para tal propósito
baseou-se na extração com clorofórmio, remoção dos interferentes por filtração, partição líquido-líquido com metanol-água-hexano e
metanol-água-clorofórmio e derivatização pré-coluna com ácido
trifluoracético. O método apresentou variação de repetibilidade inferior a 15% e recuperação na faixa de 70-110%, com limites de detecção e quantificação (0,6 µg kg-1 e 1,2 µg kg-1, respectivamente) inferiores ao nível máximo permitido pela Comissão Europeia (4,0 µg kg-1) e pela legislação brasileira (5,0 µg kg-1), para a presença de aflatoxinas em trigo e derivados. Por meio desta metodologia, foram quantificadas aflatoxinas em 20 amostras
comerciais de grãos, farelo de trigo e farinha de trigo integral e
refinada, destinadas ao consumo humano direto. Seis amostras (30%) foram positivas para aflatoxinas e todas apresentaram-se
dentro do limite regulatório permitido pela legislação brasileira.
PALAVRAS-CHAVES: Triticum aestivum L.; Aspergillus;
The consumption of wheat fiber is associated with increased laxation, reduced gut transit time, and a potential reduction in the risk of colorectal cancer (Dalton et al. 2012).
When the Good Agricultural Practices (GAP) are not adopted during cultivation and storage of wheat grains, filamentous fungi, such as Furasarium,
Penicillium and Aspergillus, may develop and
produce secondary metabolites called mycotoxins (Mylona et al. 2012, Gregori et al. 2013). Wheat contaminated with mycotoxins represents a public health problem due to the high toxicity of these toxins on human and animal health, and also because they remain stable during the industrial processes to which wheat grains are subjected, when manufacturing by-products (EFSA 2012, RASFF 2012).
Aflatoxins are produced mainly by the aflatoxigenic strains of A. flavus and A. parasiticus
and have been identified in wheat and wheat by-products in different countries. In Lebanon, Joubrane et al. (2011) analyzed 156 wheat samples for the levels of aflatoxin B1 and 35.2% of the samples were
contaminated at concentrations higher than 2 μg kg-1.
In Turkey, Aydin et al. (2008) assessed the levels of total aflatoxins in 100 samples of wheat flour, and concluded that 45% of them contained aflatoxins in the levels of 0.005-14.0 μg kg-1,and that 2% of
the samples exceeded the maximum tolerable limit in the country (4 μg kg-1). In Tunisia, Ghali et al.
(2008) analyzed 51 samples of wheat and wheat by-products and observed that approximately 30% of them were positive for aflatoxins, with the highest value corresponding to 12.9 µg kg-1.
Aflatoxins are naturally occurring carcinogenic substances and are extremely toxic to humans (Songsermsakul & Razzazi-Fazeli 2008). They are recognized by the International Agency for Research on Cancer (IARC 2002) as hepatotoxic and carcinogenic agents to humans (Group 1A) and capable of inducing liver cancer and cirrhosis, as well as reducing individuals’ immune resistance, causing outbreaks of type B viral hepatitis. In Brazil, the National Agency of Sanitary Surveillance (Anvisa) established, in 2011, the maximum tolerated limit of 5 µg kg-1 for aflatoxins (B
1 + B2 + G1 + G2) in wheat
grains (Brasil 2011). The use of reliable analytical methods to evaluate and monitor such contaminants is of extreme importance.
High Performance Liquid Chromatography (HPLC), Thin Layer Chromatography (TLC) and
rapid detection kits based on immunoenzymatic reactions (ELISA) are the most commonly used methodologies for aflatoxins determination. The choice of method depends on economic factors, purpose of analysis, and analysts team, among others (Ramos et al. 2008, Trombete et al. 2013).
This study aimed to in-house validate a methodology for the determination of aflatoxins B1, B2, G1 and G2 in wheat grain, using pre-column derivatization and quantification by HPLC with fluorescence detection.
MATERIAL AND METHODS
This research was carried out at the Laboratory of Mycotoxins of the Department of Veterinary Microbiology and Immunology, at the Universidade Federal Rural do Rio de Janeiro (UFRRJ), in Seropédica, Rio de Janeiro State, Brazil, from January to July 2013.
B1 (5 mg), B2, G1 and G2 (1 mg) aflatoxin
standards were purchased from Sigma (St. Louis, MO, USA). The stock solutions (50 µg mL-1) and
working solutions (2 µg mL-1) were prepared in
methanol and their concentrations were confirmed by absorption in UV light with a Shimadzu UV-1201 spectrophotometer (Kyoto, Japan) (AOAC 2000), and then stored at -10ºC, in amber glass vials, for a period of three months.
HPLC-grade acetonitrile and methanol, used for the mobile phase and preparation of standard solutions, were purchased from Tedia (São Paulo, SP, Brazil). The other solvents and reagents for extraction were analytical grade obtained from Vetec (Duque de Caxias, RJ, Brazil). The water used was obtained using the Milli-Q® purification system (Millipore).
Whatman filter paper (qualitative, 1) and a 0.45 µm PVDF membrane (Durapore® 13 mm, Millipore) were
used for filtration.
In order to establish the most appropriate method to extract aflatoxins from wheat grains, three different methodologies were evaluated, using the parameters of recovery and repeatability (AOAC 2002).
Methodology 2 was adapted from the multi mycotoxin method proposed by Soares & Rodriguez-Amaya (1989): extraction with methanol and KCl, purification by filtration with (NH)4SO4 and Celite, liquid-liquid partition with methanol-water-hexane and methanol-water-chloroform, pre-column derivatization with trifluoroacetic acid, and quantification carried out by HPLC-FLD.
Methodology 3 was performed as described by Sirhan et al. (2011), based on the QuEChERS method (Quick, Easy, Cheap, Effective, Rugged and Safe), by extraction with methanol: water: acetonitrile (51: 40: 9, v/v/v) MgSO4 and NaCl, followed by centrifugation and filtration, and the quantification was carried out by HPLC-FLD, without derivatization.
For Methodology 1, water (5 mL) at 60ºC was added to 15 g of the sample previously ground in a knife mill and homogenized with a glass rod in an Erlenmeyer flask. Then 50 mL of chloroform were added to the flask and agitated in a Shaker (Orbit Shaker 3520), for 30 minutes. The chloroform extract was filtered through filter paper and 25 mL were collected and then evaporated to dryness in a water bath, at 65ºC, under a N2 flow. The dried extract was resuspended with 25 mL of methanol in an ultrasound bath (Thornton T7) and transferred to a separatory funnel containing 25 mL of a NaCl aqueous solution (4% w/v). Then, 2 x 25 mL of hexane were added and the mixture was stirred vigorously for 30 seconds, after which the hexane phase (top) was discarded. Subsequently, 2 x 25 mL of chloroform were added to the separatory funnel, with vigorous shaking for 30 seconds. The chloroform phase (bottom) was collected and evaporated in a water bath, at 65ºC, under N2 flow, until dryness. Then, based on the derivatization procedure described by AOAC (2005), the extract was resuspended in 600 µL of acetonitrile, submitted to an ultrasound bath for 30 seconds, and 1,200 µL of the derivatizing solution (water: trifluoroacetic acid: glacial acetic acid at 7: 2: 1, v/v/v) were added. The solution was maintained in a water bath at 65ºC for 9 minutes. Finally, the extract was filtered through a 0.45 µm membrane and injected into the HPLC-FLD system.
For Methodology 2, a KCl aqueous solution (15 mL) (4% w/v) was added to 25 g of the sample previously ground in a knife mill and homogenized with a glass rod in an Erlenmeyer flask. Then, 135 mL of methanol were added to the flask and the
mixture was agitated in a Shaker for 30 minutes. The methanolic extract was filtered through filter paper, and 75 mL were collected and added to 75 mL of a (NH)4SO4 aqueous solution (30%, m/v), with gentle stirring, using a glass rod. After sufficient time for precipitation, 20 g of Celite were added and the solution was filtered again with filter paper, and a 75 mL sample was collected. The filtrate was then transferred to a separatory funnel and 2 x 25 mL of hexane were added and stirred vigorously for 30 seconds, after which the hexane phase was discarded. Subsequently, 2 x 25 mL of chloroform were added to the separatory funnel with vigorous shaking for 30 seconds. The chloroform phase was collected and evaporated in a water bath, at 65ºC, under a N2 flow, until dryness. Then, the extract was derivatized as described in Methodology 1, filtered through a 0.45 µm membrane and injected into the HPLC-FLD system.
For Methodology 3, a thoroughly homogenized sample (2.0 g) was weighed in a polypropylene centrifuge tube (15 mL) and 10 mL of extraction solution consisting of methanol: water: acetonitrile (51: 40: 9, v/v/v) were added with manual stirring for 1 minute. Subsequently, 1.5 g of anhydrous MgSO4 and 0.5 g of NaCl were added and then shaken manually for 1 minute. Afterwards, the tube was centrifuged for 5 minutes, at 4,000 rpm, and 1 mL of the extract was collected, filtered through a 0.45 µm membrane and injected into the HPLC-FLD system, without any derivatization procedure.
The quantification of the aflatoxins was carried out in a HPLC system, using a fluorescence detector (Agillent 1100 Series, Waldbronn, Germany), Rheodyne injector (20 µL), C18 column (Ace,
250 mm x 4.6 mm, 5 µm) and isocratic mobile phase, consisting of water: methanol: acetonitrile, at a flow rate of 1.0 mL minute-1. For Methodologies 1 and 2,
the mobile phase ratio corresponded to 70: 20: 10 (v/v/v), with detection at 365 nm excitation and 450 nm emission. For Methodology 3, the conditions of the original method were used, and the proportion of the mobile phase was 65: 25: 10 (v/v/v), while the detector signal was set at 365/440 nm of excitation and emission, respectively.
mycotoxins, and also in accordance with the general recommendations of the AOAC (2002).
The selectivity of the method was evaluated by adding standard solutions of aflatoxins to samples without any traces of the four aflatoxins. These were then submitted to extraction and quantified by HPLC-FLD, with the corresponding peaks and concentrations identified in the chromatogram. The method was considered to be selective when it presented no interfering peaks coinciding with the retention times of the aflatoxins.
The linearity was studied by external standardization, using analytical curves built up from 7 different concentrations of the aflatoxin standards in methanol. Each curve, for the aflatoxins B1, B2, G1 and G2, was prepared in quintuplicate and injected on 5 different days. The coefficient of determination (R2) was considered appropriate when > 0.99.
For Methodologies 1 and 2, the concentrations of each aflatoxin ranged 0.005-0.1 µg mL-1 and the
derivatization procedure based on AOAC (2005), already previously described, was adopted. For Methodology 3, the concentrations of the analytical curves ranged 0.0005-0.01 µg mL-1, without
derivatization.
The limits of detection (LOD) and quanti-fication (LOQ) were found by adding decreasing concentrations of standard solution containing the four aflatoxins in the samples, and then submitted to extraction and quantification, up to the lowest detectable concentration (LOD) and the lowest quantifiable concentration (LOQ), under suitable conditions of repeatability (n = 5, RSD < 15%). The limits of detection and quantification found were 0.6 µg kg-1 and 1.2 µg kg-1, respectively, for
the four aflatoxins.
The recovery studies were conducted in samples in which the presence of the four aflatoxins was not detected, starting with the addition of two different concentrations (5 µg kg-1 and 10 µg kg-1) for
each aflatoxin (B1, B2, G1 and G2). Five samples were
contaminated for each concentration and stored at room temperature for 12 hours, prior to the extraction procedure. To evaluate the recovery parameter, the values set by the EC to determine the aflatoxin at levels up to 10 µg kg-1, corresponding to 70-110%
recovery (EC 2006), were adopted as reference. The precision was expressed by the Relative Standard Deviation (RSD%) and calculated according to the repeatability of the recovery experiments for
each concentration (5 µg kg-1 and 10 µg kg-1). The
maximum variation was set at ≤ 15%.
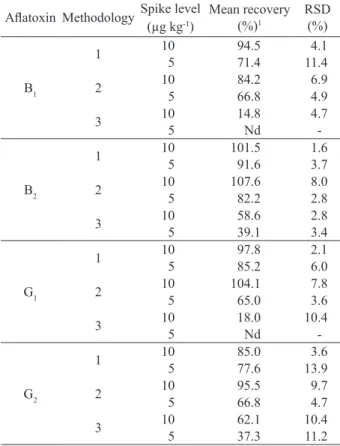
RESULTS AND DISCUSSION
The methodologies evaluated showed different recovery and repeatability values (Table 1). Only Methodology 1 (IAL 2008) showed recovery values within the range of 70-110% for both concentrations (5 µg kg-1 and 10 µg kg-1). Methodology 2 was
appropriate for the level of 10 µg kg-1, however, it
showed low recovery values for B1, G1 and G2, when
the samples were spiked with 5 µg kg-1.
Methodology 3, based on the QuEChERS method, was not adequate for determining aflatoxins in wheat grains, presenting inadequate recovery values, especially for AFB1 and AFG1. This fact is
mainly due to the lack of a derivatization step for these aflatoxins, as the quantification was performed by fluorescence. According to Espinosa-Calderón et
1 Mean of five extractions. Nd = Not detected; RSD = Relative Standard Deviation. Methodology 1 - IAL (2008); Methodology 2 - Soares & Rodriguez-Amaya (1989); Methodology 3 - Sirhan et al. (2011).
Aflatoxin MethodologySpike level
(µg kg-1)
Mean recovery (%)1
RSD (%)
B1
1 10 94.5 4.1
5 71.4 11.4
2 10 84.2 6.9
5 66.8 4.9
3 10 14.8 4.7
5 Nd
-B2
1 10 101.5 1.6
5 91.6 3.7
2 10 107.6 8.0
5 82.2 2.8
3 10 58.6 2.8
5 39.1 3.4
G1
1 10 97.8 2.1
5 85.2 6.0
2 10 104.1 7.8
5 65.0 3.6
3 10 18.0 10.4
5 Nd
-G2
1 10 85.0 3.6
5 77.6 13.9
2 10 95.5 9.7
5 66.8 4.7
3 10 62.1 10.4
5 37.3 11.2
Table 1. Mean recoveries and RSD of aflatoxins spiked in wheat
grain samples at different spiking levels (Seropédica,
al. (2011) and Bakirdere et al. (2012), the pre-column or pos-column derivatization step is important when using HPLC-FL, because it increases the natural fluorescence of these molecules, thus increasing the sensitivity of detection through the conversion of aflatoxins B1 and G1 to their derivatives B2a and G2a,
respectively. Therefore, the methodology adopted for determining aflatoxins in wheat grains was Methodology 1, adapted from the Instituto Adolfo Lutz (IAL 2008).
The applicability of this method was also evaluated to determine the aflatoxins in wheat flour, whole wheat flour and wheat bran, and proved to be suitable for the extraction in such matrices, with good levels of recovery and repeatability (Table 2). However, it is important to highlight that, for extracting aflatoxins from wheat bran, twice the volume of chloroform was used, and for the analysis of the flours water was not added.
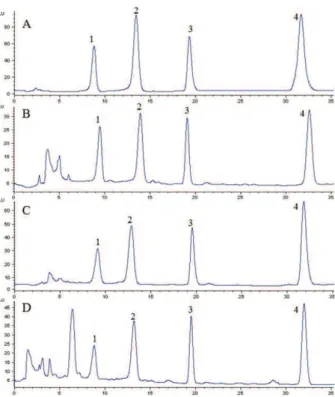
In order to optimize the chromatographic resolution of the four aflatoxins, different proportions of the mobile phase were evaluated: water: methanol: acetonitrile, in the proportions 60: 20: 20, 65: 15: 10 and 70: 20: 10 (v/v/v). The first two mobile phases were not able to identify the AFG2a (derivatized form of aflatoxin G1), due to co-elution of an
interfering chemical. However, the third mobile phase (70: 20: 10, v/v/v), at a flow rate of 1 mL minute-1, resulted in adequate separation and
quantification of the four aflatoxins selected for quantification.
Under these conditions, the retention times were approximately 9, 13, 20 and 32 minutes, respectively for the aflatoxins G2a, B2a, G2 and B2. Figure 1 shows the chromatograms of the standard aflatoxins and the recovery tests.
The influence of the fluorescence detector signs was also evaluated, in order to establish the best fluorescence for the four aflatoxins. The following combinations of excitation and emission were studied: 360/440 nm, 360/445 nm, 360/450 nm, 365/440 nm, 365/445 nm and 365/450 nm, respectively. The values of 365 nm and 450 nm excitation and emission, respectively, showed the highest peak areas for the four aflatoxins used in this research (Figure 2).
1 Mean of five extractions. RSD = Relative Standard Deviation. Aflatoxin Spike level (µg kg-1)
Wheat grains Wheat flour Whole wheat flour Wheat bran Mean recovery1 (%) ± RSD
B1
10 94.5 ± 4.1% 85.7 ± 2.2% 91.7 ± 3.8% 77.8 ± 5.5% 5 71.4 ± 11.4% 73.8 ± 2.5% 74.5 ± 10.3% 77.5 ± 10.3%
B2
10 101.5 ± 1.6% 92.8 ± 2.7% 100.5 ± 1.9% 95.4 ± 8.2% 5 91.6 ± 3.7% 82.2 ± 3.2% 95.4 ± 4.5% 104.9 ± 8.3% G1 10 97.8 ± 2.1% 85.9 ± 1.0% 91.8 ± 5.2% 92.8 ± 13.6%
5 85.2 ± 6.0% 73.8 ± 2.5% 80.4 ± 4.1% 108.5 ± 6.1%
G2 10 85.0 ± 3.6% 105.8 ± 9.6% 89.7 ± 4.2% 70.2 ± 3.2%
5 77.6 ± 13.9% 78.1 ± 1.2% 82.4 ± 2.9% 109.6 ± 9.3%
Table 2. Mean recoveries and RSD of aflatoxins spiked in wheat grains, bran and flour at different spiking levels (Seropédica, Rio de Janeiro State, Brazil, 2013).
Figure 1. Chromatograms obtained by HPLC-FLD from aflatoxins B1, B2, G1 and G2 (A) and recovery experiments in the matrices: wheat (B), wheat flour
(C) and wheat bran (D) (Seropédica, Rio de Janeiro
State, Brazil, 2013). 1 - G2a (derivatized form of the
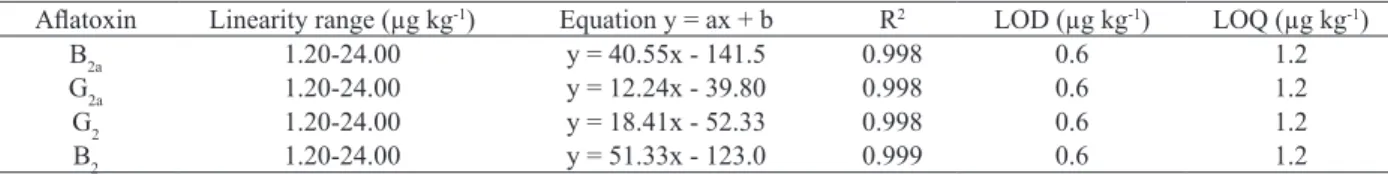
The analytical curves showed suitable linearity (R2 > 0.99) in the working range studied (Figure 3
and Table 3).
The main mycotoxins investigated in wheat grains produced and marketed in Brazil are deoxynivalenol, nivalenol and zearalenone (Del Ponte et al. 2012, Almeida-Ferreira et al. 2013, Santos et al. 2013, Savi et al. 2014). On the other hand, little research has been carried out and published, concerning the presence of aflatoxins in wheat and wheat by-products.
In this study, aflatoxins in 20 random samples of grain, wheat bran, whole wheat flour and refined wheat flour, intended for direct human consumption and acquired at different supermarkets in Seropédica, were quantified using the validated method.
Thirty percent of the samples were positive for aflatoxins. AFB1 was detected in all positive samples
and was also quantified in 2 (grains and wheat bran) AFG1. The presence of AFB2 and AFG2 were not detected. All samples were in accordance with the Brazilian legislation (Brasil 2011), with values < 5 µg kg-1 for total aflatoxins (Table 4).
Figure 2. Effect of excitation and emission wavelengths (nm) on the sensitivity of aflatoxins G2a, B2a, G2 and B2. The
largest areas were considered 100% and then related to the other ones (Seropédica, Rio de Janeiro State,
Brazil, 2013).
LOD: limit of detection; LOQ: limit of quantification.
Aflatoxin Linearity range (µg kg-1) Equation y = ax + b R2 LOD (µg kg-1) LOQ (µg kg-1)
B2a 1.20-24.00 y = 40.55x - 141.5 0.998 0.6 1.2
G2a 1.20-24.00 y = 12.24x - 39.80 0.998 0.6 1.2
G2 1.20-24.00 y = 18.41x - 52.33 0.998 0.6 1.2
B2 1.20-24.00 y = 51.33x - 123.0 0.999 0.6 1.2
Table 3. Linearity range, Equation, R2 value, LOD and LOQ of methodology for aflatoxins determination (Seropédica, Rio de Janeiro State, Brazil, 2013).
(L
U)
(µg mL-1)
Figure 3. Analytical curves obtained by external standardization using 7 points at different levels of aflatoxins (Seropédica, Rio de Janeiro State, Brazil, 2013).
1 Mean of three extractions. Nd = Not detected.
Food Analyzed samples Positive samples Concentration range1 (µg kg-1)
Wheat bran 5 4 (80%) Nd-2.14
Wheat grains 5 1 (20%) Nd-4.00
Whole wheat flour 5 1 (20%) Nd-3.33
Refined wheat flour 5 0 (0%) Nd
Although the samples did not present aflatoxin contamination levels above the limit permitted by the Brazilian law, more studies should be conducted to evaluate the presence of aflatoxins in wheat and also quantify by-products marketed in Brazil, since these foods are widely consumed by the population.
CONCLUSION
The in-house validation of a method in this study presented adequate parameters of selectivity, sensitivity, linearity, precision and accuracy for determining aflatoxins B1, B2, G1 and G2 in samples
of wheat, wheat bran, whole wheat flour and refined wheat flour, whereas it is cheap, simple to use and can be reproduced in other laboratories, without using purification cartridges or immunoaffinity columns.
REFERENCES
ALMEIDA-FERREIRA, G. C. et al. Occurrence of zearalenone in wheat and corn-based products commercialized in the State of Paraná, Brazil. Brazilian Journal of Microbiology, São Paulo, v. 44, n. 2, p. 371-375, 2013.
ASSOCIATION OF OFFICIAL ANALYTICAL CHEMISTS (AOAC). Official methods of analysis 971.22: standards for aflatoxins. Rockville: AOAC, 2000.
ASSOCIATION OF OFFICIAL ANALYTICAL CHEMISTS (AOAC). AOAC guidelines for single laboratory validation of chemical methods for dietary
supplements and botanicals. 2002. Available at:
<http://www.aoac.org/imis15_prod/AOAC_Docs/ StandardsDevelopment/SLV_Guidelines_Dietary_ Supplements.pdf >. Access on: 05 Oct. 2014.
ASSOCIATION OF OFFICIAL ANALYTICAL CHEMISTS (AOAC). Official methods of analysis 994.08: derivatization of standards for aflatoxins. Rockville: AOAC, 2005.
AYDIN, A. et al. Total aflatoxin, aflatoxin B1 and ochratoxin A levels in Turkish wheat flour. Journal of Food and Drug Analysis, Taiwan, v. 16, n. 1, p. 48-53, 2008. BAKIRDERE, S. et al. Aflatoxin species: their health effects and determination methods in different foodstuffs.
Central European Journal of Chemistry, Vienna, v. 10,
n. 3, p. 675-685, 2012.
BRASIL. Ministério da Saúde. Agência Nacional de Vigilância Sanitária. Resolução RDC nº 7, de 18 de fevereiro de 2011. Dispõe sobre limites máximos tolerados (LMT) para micotoxinas em alimentos. Diário Oficial da
República Federativa do Brasil, Brasília, DF, 9 mar. 2011.
Seção 1, p. 66-67.
DEL PONTE, E. M. et al. Deoxynivalenol and nivalenol in commercial wheat grain related to Fusarium head blight epidemics in southern Brazil. Food Chemistry, Reading, v. 123, n. 1, p. 1087-1091, 2012.
DALTON, S. M. C. et al. Potential health benefits of whole grain wheat components. Nutrition Today, Boston, v. 47,
n. 4, p. 163-174, 2012.
E M P R E S A B R A S I L E I R A D E P E S Q U I S A AGROPECUÁRIA (Embrapa). Trigo. 2013. Available at: <http://www.cnpt.embrapa.br/>. Access on: 19 May 2013. EUROPEAN COMMISSION (EC). Commission Regulation EC n. 401/2006 of 23 February 2006. Laying down the methods of sampling and analysis for the official control of the levels of mycotoxins in foodstuffs. Official
Journal of the European Union, London, 9 Mar. 2006.
L. 70, p. 12-34.
EUROPEAN FOOD SAFETY AUTHORITY (EFSA).
Mycotoxins. 2012. Available at: <http://www.efsa.europa. eu/en/aboutefsa.htm>. Access on: 19 May 2013.
ESPINOSA-CALDERÓN, A. et al. Methods for detection and quantification of aflatoxins. In: TORRES-PACHECO, I. (Ed.). Aflatoxins: detection, measurement and control. New York: InTech, 2011. p. 109-128.
GHALI, R. et al. Incidence of aflatoxins, ochratoxin A and zearalenone in Tunisian foods. Food Control,Berkshire, v. 19, n. 1, p. 921-924, 2008.
GREGORI, R. et al. Dynamics of fungi and related mycotoxins during cereal storage in silo bags. Food Control,Berkshire, v. 30, n. 1, p. 280-287, 2013.
INSTITUTO ADOLFO LUTZ (IAL). Métodos
fisico-químicos para análise de alimentos: micotoxinas. 4. ed.
São Paulo: Instituto Adolfo Lutz, 2008.
INTERNATIONAL AGENCY FOR RESEARCH ON CANCER (IARC). Monograph on the evaluation of carcinogenic risk to humans: some traditional herbal medicines, some mycotoxins, naphthalene and styrene. Lyon: World Health Organization, 2002.
JOUBRANE, K. et al. Occurrence of aflatoxin B1 and ochratoxin A in Lebanese cultivated wheat. Mycotoxin Research, Heidelberg, v. 27, n. 1, p. 249-57, 2011.
KARL, J. P. et al. The role of whole grains in body weight regulation. Advances in Nutrition, Madison, v. 3, n. 5, p. 697-707, 2012.
MYLONA, K. et al. Relationship between environmental factors, dry matter loss and mycotoxin levels in stored wheat and maize infected with Fusarium species. Food Additives & Contaminants, Amsterdam, v. 29, n. 7, p. 1118-1128, 2012.
RAMOS, C. R. B. A. et al. Validação de métodos de extração, limpeza e purificação de aflatoxinas para análise em cromatografia líquida de alta eficiência. Pesquisa Agropecuária Tropical, Goiânia, v. 38, n. 2, p. 103-108, 2008.
RAPID ALERT SYSTEM FOR FOOD AND FEED (RASFF): annual report. 2012. Available at: <http:// ec.europa.eu/RASFF>. Access on: 19 May 2013. SANTOS, J. S. et al. Natural occurrence of deoxynivalenol in wheat from Paraná State, Brazil, and estimated daily intake by wheat products. Food Chemistry, Reading, v. 138, n. 1, p. 90-95, 2013.
SAVI, G. D. et al. Mycoflora and deoxynivalenol in whole wheat grains (Triticum aestivum L.) from southern Brazil. Food Additives & Contaminants, Amsterdam, v. 89, n. 1, p. 833-837, 2014.
SIRHAN, A. Y. et al. Method validation in the determination of aflatoxins in noodle samples using the QuEChERS method (Quick, Easy, Cheap, Effective, Rugged and Safe) and high performance liquid chromatography coupled to a fluorescence detector (HPLC-FLD). Food Control, Berkshire, v. 22, n. 12, p. 1807-1813, 2011.
SOARES, L. M. V.; RODRIGUEZ-AMAYA, D. B. Survey of aflatoxins, ochratoxin A, zearalenone and sterigmatocystin in some Brazilian foods by using multi-toxin thin-layer chromatographic method. Journal of the
Association of Official Analytical Chemists International,
London, v. 77, n. 1, p. 22-26, 1989.