Pesq. agropec. bras., Brasília, v.48, n.7, p.748-756, jul. 2013 DOI: 10.1590/S0100-204X2013000700007
Genetic diversity of irrigated barley based on molecular
and quantitative data and on malting quality
Renato Fernando Amabile(1), Fábio Gelape Faleiro(1), Eduardo Alano Vieira(1), José Ricardo Peixoto(2), Flávio Capettini(3) and Walter Quadros Ribeiro Júnior(1)
(1)Embrapa Cerrados, BR‑020, Km 18, Caixa Postal 08223, CEP 73010‑970 Planaltina, DF. E‑mail: [email protected], [email protected], [email protected], [email protected] (2)Universidade de Brasília, Faculdade de Agronomia e Medicina Veterinária, Campus Universitário Darcy Ribeiro, CEP 70910‑900 Brasília, DF. E‑mail: [email protected] (3)Field Crop Development
Centre, Alberta Agriculture and Rural Development, 5030 50 Street, Lacombe, AB T4L 1W8, Canada. E‑mail: [email protected]
Abstract – The objective of this work was to quantify the genetic diversity of elite genotypes of irrigated barley in the Brazilian savanna. Thirty elite barley genotypes from Embrapa Cerrados' collection were evaluated using 160 RAPD markers, 12 agronomic traits related to yield components, and 10 malting quality parameters. The genetic dissimilarity matrices based on molecular markers, quantitative traits, and malting quality characters were calculated and a cluster analysis was performed using the unweighted pair-group method with arithmetic mean (UPGMA) as grouping criterion. High genetic diversity among accessions were observed. The estimated genetic dissimilarities were weakly correlated, showing the complementarity of the different character groups. Selection indices and graphical dispersion analysis allowed the selection of promising genotypes and the indication of suitable crosses for maximizing the heterotic effects in breeding programs for irrigated barley in the Brazilian savanna.
Index terms: Hordeum vulgare, breeding, Cerrado, cluster analysis, genetic resources, selection indices.
Diversidade genética de cevada irrigada com base em dados
moleculares e quantitativos e na qualidade malteira
Resumo – O objetivo deste trabalho foi quantificar a diversidade genética de genótipos‑elite de cevada irrigada no Cerrado. Trinta genótipos‑elite de cevada, da coleção de trabalho da Embrapa Cerrados, foram avaliados com
base em 160 marcadores moleculares RAPD, 12 características agronômicas relacionadas aos componentes de
produção e 10 características de qualidade malteira. As matrizes de dissimilaridade genética foram calculadas
com base nos marcadores moleculares e em caracteres quantitativos e qualitativos, e as análises de agrupamento
foram realizadas com o método da média aritmética não ponderada (UPGMA) como critério de agrupamento. Observou‑se elevada diversidade genética entre os acessos. As dissimilaridades genéticas estimadas estiveram
fracamente correlacionadas entre si, o que evidenciou a complementaridade dos diferentes grupos de características.
A utilização de índices de seleção e a análise de dispersão gráfica permitiram a seleção de genótipos promissores e a indicação de cruzamentos apropriados para maximizar os efeitos heteróticos no programa de melhoramento genético da cevada irrigada no Cerrado.
Termos para indexação: Hordeum vulgare, melhoramento, Cerrado, análise de grupamento, recursos genéticos, índices de seleção.
Introduction
Barley (Hordeum vulgare L.) was the first
domesticated vegetable crop (Borém, 2009). It is versatile crop of high adaptability to a wide range of environments, which favored its cultivation in several countries. At present, barley is the world’s fourth most produced and marketed cereal. Brazil is the second largest importer of barley in America, and the twelfth worldwide (Faostat, 2012). The malting industry absorbs most of the production, and the rest
is commonly used as animal feed and for human consumption (Amabile et al., 2007).
Barley has shown good adaptability to the Brazilian savanna, due to the low incidence of diseases, to its efficiency in water use, and to its high yielding
potential, with commercial yields above 7.0 Mg ha-1,
It was evaluated 30 elite malting barley genotypes (two and six-rowed) from a working collection of Embrapa Cerrados, which has accessions from Mexico, USA, UK, and Germany, along with the Brazilian ones selected from the barley breeding program of Embrapa (Table 1). It was used a randomized block design with four replicates of five‑meter long plots,
with six rows (spaced at 20 cm apart), 4.8 m2 useful
area, and 300 plants m-2 stand.
Soil preparation was made by incorporating soybean crop debris with 32”-disk plows, followed by the use of leveling disk. Pendimethalin at 3.0 L ha-1 was used
in pre-emergency. According to the soil analysis, 16 kg ha-1 N, 120 kg ha-1 P
2O5, 64 kg ha-1 K2O, and
systems in the Brazilian savanna: BRS 180, BRS 195, BRS Sampa, BRS Deméter, BRS Manduri and BRS Savanna. The continuous offer of productive, stable, agronomically superior cultivars, with a malting industrial quality profile that meets most of the brewery industry specifications, is mandatory for barley research programs in order to maintain or increase the competition in the malt agribusiness.
The magnitude of genetic variability in accessions used genetic breeding programs of malting barley is controversial. Matus & Hayes (2002) found a narrow genetic base for barley industrial quality, in contrast to other studies that reported great variability for this crop (Canci et al., 2003; Fox et al., 2006; Verma & Sarkar, 2010). Therefore, this and other traits must be widely tested, in order to help the industry and to foster production in new areas potentially favorable to barley. For this reason, more studies on the available genetic diversity for malting quality and good agronomic traits are important.
It is essential to research genetic divergence in the desired environment, identifying genotypes for new hybridizations and allowing the generation of populations with high frequencies of desirable genetic combinations. Some studies on genetic diversity of barley have focused on phenological and quantitative traits (Manjunatha et al., 2007; Shakhatreh et al., 2010), others on analytical determinations of the malting quality (Evans et al., 2010). RAPD molecular markers have been also used (Abdellaoui et al., 2007; Karim et al., 2009). However, literature regarding combined and complimentary use of agro-morphological traits related to malting quality and molecular markers still lacks. This kind of study could guide and create strategies for barley genetic breeding programs.
The objective of this work was to quantify the genetic diversity of elite genotypes of irrigated barley in the Brazilian savanna.
Materials and Methods
The experiment was carried out under conventional irrigation at Embrapa Cerrados, Planaltina, DF, at 15º35'30"S, 47º42'30"W, and 1,007 m altitude, from May 1 to September 30, 2009. The soil was classified as Latossolo Vermelho distroférrico (Rhodic Haplustox) with clayed texture.
Table 1. Elite genotypes of malting barley and respective origin, type of spike, distance in relation to the quality ideotype based on ten traits, and parameter and weight free selection index calculated considering ten quantitative agronomic traits.
Genotype Origin Spike Distance to the ideotype
Selection index(1) (106)
Vicente Morales Mexico Six-rowed 1.189669 0
Foster USA Six-rowed 1.245159 0
BRS 195 Brazil Two-rowed 1.264582 0
CPAC 20020098 Mexico Six-rowed 1.306507 5.73
Alliot England Two-rowed 1.353693 0
PFC 2004345 Brazil Two-rowed 1.380156 0
Cellar England Two-rowed 1.475910 0
Lacey USA Six-rowed 1.516221 0
M 14 USA Two-rowed 1.53690 0
BRS 180 USA Six-rowed 1.611160 4.19
BRS Sampa Brazil Two-rowed 1.637634 0
PFC 2004216 Brazil Two-rowed 1.656808 0 BRS Deméter Brazil Two-rowed 1.704709 0 PFC 2003122 Brazil Two-rowed 1.774193 0
CIMMYT 48 Mexico Six-rowed 1.777045 0
PFC 213660 Brazil Two-rowed 1.821854 0
CEV 96046 Brazil Two-rowed 1.879522 0
Scarlett Germany Two-rowed 1.904478 0
PFC 214827-10 Brazil Two-rowed 1.924378 0
PFC 98252 Brazil Six-rowed 2.011575 0
C 70 USA Two-rowed 2.029528 0
PFC 2005123 Brazil Two-rowed 2.045446 0 PFC 2004033 Brazil Two-rowed 2.07664 0
Danuta Germany Two-rowed 2.216143 0
BRS Greta Brazil Two-rowed 2.23193 0
CIMMYT 25 Mexico Six-rowed 2.231944 0
PFC 99324 Brazil Six-rowed 2.241877 75.42
CIMMYT 42 Mexico Six-rowed 2.253181 0
PFC 2001090 Brazil Two-rowed 2.341368 0
BRS Elis Brazil Two-rowed 2.49313 0
Pesq. agropec. bras., Brasília, v.48, n.7, p.748-756, jul. 2013
DOI: 10.1590/S0100‑204X2013000700007
40 kg ha-1 N were applied on sowing furrows, when the
fifth leaf was totally unfolded (Amabile et al., 2007). Sprinkler irrigation was used based on the volumetric soil water content (θ), measured with a profile probe (Delta T Devices Ltd., Cambridge UK) placed in the planting line (0.10 m; 0.20 m and 0.30 m deep). Irrigations were made when moisture at 0.10 m deep
was approximately 0.26 cm3 cm-3, corresponding to
the consumption of 50% available water. The amount of irrigation was calculated for increasing moisture to 0.35 cm3 cm-3 (field capacity), in the soil profile from
0 to 0.35 m, according to daily readings of the probe. A total of 420 mm net irrigation depth was applied during the study.
Twelve quantitative agro-morphological traits were evaluated as follows: distance from the last knot to the rachis; distance from the flag leaf to rachis; spike length; number of grains per ear; flag leaf area – during the linear phase of grain filling, determined using the ImageJ program (Rasband, 2006); heading date (50% of the plots with 50% of ears or more outside the boot); plant height; lodging degree; estimated grain yield; thousand kernel weight; the best grain quality, according to Brasil (1996); and total protein content, using the Kjeldahl method (Yasuhara & Nokihara, 2001).
Quantitative data were subjected to analysis of
variance. Ten traits showing significant differences were used to estimate the Mahalanobis's generalized
distance (D2) among the genotypes, using Genes
program (Cruz, 1997).
After harvesting, grain samples were sent to a malting quality laboratory (Laboratório de Qualidade da Malteria do Vale, Taubaté, SP, Brazil), in order to analyze micromalting with the following determinations: total protein content (%), according to the Kjeldahl method (Yasuhara & Nokihara, 2001); extract fine grind, dry basis (%); Hartong Index VZ
(45ºC); viscosity 8.6 (mPa s-1); boiled wort color;
soluble nitrogen content (mg per 100 g); Kolbach index (%); friability (%); glassy (%); and beta-glucans, according to the European Brewery Convention (1997).
To assist the selection of elite genotypes and potential genitors according to malting quality traits, it was used a selection index based on an ideotype , for which: total protein content is 11.6%; extract yield, 80.9%; Hartong index VZ, 39.9; viscosity, 1.5 mPa s-1; boiled wort
color, 6.5; soluble nitrogen content, 781 mg 100g-1;
Kolbach index, 42.4%; friability, 87.6%; glassy, 0.2%; and beta-glucans, 25 mg L-1. The genetic dissimilarity
among the thirty accessions, based on ten malting quality traits, was estimated through their standardized average Euclidean distance from the ideotype, using Genes program (Cruz, 1997). The genotypes were organized according to the distance from to their ideotype, by which the ones showing smaller distances were classified as superior.
For the molecular analyses, genomic DNA samples from the elite genotypes were collected from the leaflets, eight days after germination, using CTAB (cetyltrimethyl ammonium bromide) with some modifications (Faleiro et al., 2003). DNA quantification of each sample was performed by spectrophotometry
at 260 nm (A260) and purity was measured based on
absorbance ratio at 260 and 280 nm. After that, DNA samples were amplified to obtain RAPD markers, according to Costa et al. (2005).
At first, 48 decamer primer (Operon Technologies Inc., Alameda, CA, USA) were tested for adjustments made in the PCR reaction. Following this process, 15 primers with greater amplification quantity and quality were selected: OPD (03, 07, and 08), OPF (05, 09, 14, and 20), OPG (05, 08, 15, and 17), and OPH (04, 12, 14, and 20). The reaction products were placed
in agarose gel (1.2%), dyed in 10 µg mL-1 ethidium
bromide, and immersed in TBE buffer (90 mmol L-1
Tris-borate, 1 mmol L-1 EDTA). Electrophoretic
separation was performed for four hours at 90 volts. Gels were photographed using an ultraviolet light.
All RAPD markers obtained were converted into a binary data matrix, and the genetic distance among genotypes was estimated based on the complement of Nei & Li's similarity coefficient, using Genes program (Cruz, 1997).
was calculated using the cophenetic correlation coefficient (r) with software Ntsys‑pc 2.1 (Numerical Classification System) (Rohlf, 2000). Later on, the correlations between the genetic distances in different groups of traits were estimated.
To select elite genotypes and potential genitors for advances in the genetic breeding program based on different traits of interest, a weight-free index or parameter (Elston, 1963) was used along with Genes software (Cruz, 1997). Cut‑off points (ki values)
were defined according to the average traits: spike length (8.85 cm), number of grains per ear (20.66), flag leaf area (14.38 cm²), heading (37.5 days), thousand kernel weight (36.62 g), and distance from the last knot to rachis (30.83 cm). As for estimated grain
yield, the ki value was determined by the mean plus
½ σ (6.187 kg ha-1), and for the best quality grain, the
ki value was 80%, a value recommended by MAPA
(Brasil, 1996). The ki values for lodging and plant height
were set as 0% and 96.5 cm, respectively. Genotypes were selected for the following traits with means above ki values: spike length, number of grains per ear, flag
leaf area, thousand kernel weight, estimated grain yield, and the best quality grain. Genotypes were also selected for the traits with means lower than ki values,
which were: heading, distance from the last knot to the rachis, plant height and lodging.
The selection index for each genotype was calculated. Gains by direct selection were estimated using the following expression: ΔG (%) = (ds × h2)100/X
0, in
which: ΔG is the expected gain with selection (%); ds is the selection differential; X0 is the original average
per trait, and h2 is the heritability coefficient in the
broad sense, using Genes program (Cruz, 1997). The original population considered all accessions, while the improved population only took into consideration the selected genotypes.
Results and Discussion
Genetic variability analyses based on agro- morphological traits, using the Mahalanobis’s generalized distance, showed that genotypes PFC 2004345 and PFC 2005123 were the most dissimilar between themselves. The smallest distance estimate was found for BRS 195 two‑rowed witness and Alliot genotype, although no significant degree of genetic relationship was found among them according
to genealogy. The six‑rowed genotype CPAC 20020098 showed the smallest distance from six-rowed witness BRS 180. Genotype PFC 2005123 was the most distant from BRS 195 and BRS 180, and also showed the largest mean distance in relation to all other genotypes. This amplitude reflects a wide genetic variability among the genotypes, a fundamental condition for the genetic breeding, as it was also observed by Manjunatha et al. (2007) and Shakhatreh et al. (2010) in barley collections according to agro-morphological traits.
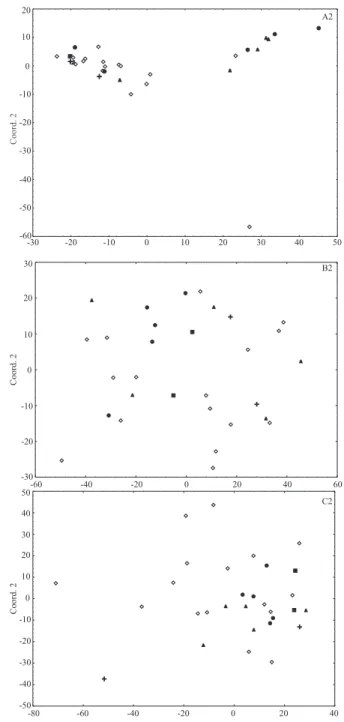
Cluster analysis showed three significant groups of similarity, using the average relative genetic distance 24.73% (Figure 1, A1 and A2) as the cut-off point. Group 1, composed only by genotype PFC 2005123, showed the greatest divergence. Group 2, except for C-70 two-rowed genotype, was composed by six-rowed genotypes, as follows: three Mexican (Vicente Morales, CIMMYT 25, and CIMMYT 42); two North American (BRS 180 and C-70); and the Brazilian genotype PFC 98252, from a North American population and CPAC 20020098, selected from a population of Mexican plants. A tendency of genotype concentration from Mexico was observed, except for genotype CIMMYT 48. This fact can be explained by the emphasis given to the selection and collection of six-rowed materials for an irrigated system from the Mexican breeding program.
Group 3 was composed of 21 out of the 30 genotypes. This conglomeration indicates that most genotypes had high agro-morphological similarity degree, and most of the accessions from the group were from an elite work collection of Embrapa Cerrados. It was possible to verify the structure of a subgroup involving cultivars BRS Elis, BRS Sampa and Scarlett, in which BRS Elis as well as BRS Sampa have BRS 195 as one of their genitors; moreover, BRS Elis’s genitor is cultivar Scarlett. A larger subgroup was composed of BRS 195 with the genotypes mentioned above, indicating that the high similarity found is partially explained by the genic lineage from cultivar BRS 195.
Pesq. agropec. bras., Brasília, v.48, n.7, p.748-756, jul. 2013
DOI: 10.1590/S0100‑204X2013000700007
influenced by the environment (Canci et al., 2003), studies in different environments should be performed. Cluster analyses enabled the formation of five groups. As a cut-off point, the relative average genetic distance of 43.46% was adopted. Three unitary groups were composed of genotypes PFC 2001090, BRS Elis
and variety Scarlett. When studying the accession origins, no clustering tendency was found, since qualitative traits are complex variables and depend on the interacted expression of a great number of genes (Ceccarelli et al., 2007) that are not related to the geographical origin of accessions. It is possible that
0 10 20 30 40 50 60 70
PFC 2005123 CIMMYT 42 CIMMYT 25 Vicente Morales PFC 98252 C-70 CPAC 20020098 BRS 180 Alliot PFC 99324 BRS Greta PFC 2004216 CIMMYT 48 BRS Deméter PFC 2003122 Danuta PFC 2004033 Foster PFC 213660 Lacey PFC 2004345 BRS Elis BRS Sampa Scarlett Cellar PFC 214827-10 BRS 195 M 14 CEV 96046 PFC 2001090
-60 -40 -20 0 20 40 60
-30 -20 -10 0 10 20 30
-80 -60 -40 -20 0 20 40
Coord. 1 -50
-40 -30 -20 -10 0 10 20 30 40 50
0 10 20 30 40 50 60 70 80
Relative genétic dissimilarity (%) PFC 2004033Scarlett
PFC 214827-10BRS Elis PFC 2004216PFC 213660 BRS DeméterBRS 180 Vicente MoralesPFC 98252 CIMMYT 48 PFC 2004345BRS Sampa C-70 PFC 99324Cellar PFC 2005123 Danuta CIMMYT 25M 14 CIMMYT 42 CPAC 20020098Lacey FosterAlliot BRS 195 PFC 2003122CEV 96046 BRS Greta PFC 2001090
-30 -20 -10 0 10 20 30 40 50
-60 -50 -40 -30 -20 -10 0 10 20
Coord. 2
0 10 20 30 40 50 60
BRS Elis Cellar BRS Sampa PFC 2004216 PFC 2004345 CPAC 20020098BRS Deméter CIMMYT 48Foster PFC 98252BRS 180 C-70 Alliot Scarlett PFC 99324 PFC 214827-10PFC 2044033 BRS Greta CIMMYT 42 Danuta PFC 2005123 Vicente MoralesM-14 BRS 195 Lacey CIMMYT 25 PFC 2003122 PFC 213660CEV 96046 PFC 2001090
A1 A2
B1 B2
C1 C2
Coord. 2
Coord. 2
Figure 1. Cluster analysis and dispersion plot of 30 elite barley genotypes, based on the relative genetic dissimilarity (%) calculated using 12 quantitative agronomic traits (A1 and A2), 10 malting quality traits (B1 and B2), and 160 RAPD markers
(C1 and C2). Origin‑based clusters of genetic samples: (◊) Brazil; (▲) Mexico; (■) England; (+) Germany and (●) United
the elite accessions from each origin have a genetic mixture, which might have occurred when obtaining the material from the barley genetic breeding programs made in each country of origin. Therefore, based on the genetic distance among accessions of different groups, the contrasting parents may be selected and used in the hybridization program to generate a greater variability as for the malting quality, which is recommended by Sarkar et al. (2008).
All 15 decamer primers employed generated 141 polymorphic RAPD markers (88.12% of the total), with 10.7 average bands per primer. Primers OPD07, OPD08, OPF05 and OPH12 showed the greatest number of polymorphic bands, while OPH14 enabled the largest amount of monomorphic bands. The high percentage of polymorphic markers and high average of markers obtained by the primers evidenced the existence of a high genetic variability among the barley elite genotypes from the working collection belonging to Embrapa Cerrados. This variability might be explained by the broad genetic base available at the germplasm bank in Brazil. This high variability among barley genotypes have also been reported for other collections although authors have used a genetic base different from the one used at the present study (Abdellaoui et al., 2007; Karim et al., 2009). The genetic dissimilarity estimates showed that the North American cultivars Foster and C-70 were the most similar, while the English barley Prestige and Brazilian FM 404 were the less dissimilar between themselves (Figure 1, C1 and C2). The last two would be more recommended for crossings with the purpose of increasing the variability in the resulting population.
Cluster analyses, using the UPGMA method, revealed the existence of eight similarity groups, with several subgroups, using as cut-off point 45.6% as the mean relative genetic distance (Figure 1, C1). A major group of similarity was formed, in which all six-rowed genotypes were assigned, regardless of their origin. These elite genotypes were obtained from selections and hybridizations made in the USA, Mexico, and Brazil. In this main similarity group, one may evidence the disposition of subgroups of major similarity. One of them includes cultivar BRS 195 and genotype PFC 2003122, which might be explained by the fact that BRS 195 is the genitor of genotype PFC 2003122. Moreover, all Mexican, North American, and English genotypes were assigned in this group.
These analyses indicate a probable consequence of the selection pressure by plant breeders in the mentioned countries. Noteworthy, there should have been a clustering of Mexican and North American genetic materials in a certain moment of the barley breeding program performed in their respective countries, when the plant breeders focused on the selection of six-rowed materials for irrigated environments. On the contrary, Brazilian and German materials showed a greater dissimilarity, not assigned to a single group, which makes it interesting to broaden the genetic base of breeding programs.
Additionally, six peculiar divergent single groups were observed, out of which five were composed of Brazilian genotypes and one was a German genotype. Only genotypes from these two countries had representatives that were not assigned to the main clustering. Group 1 had the genotype PFC 2004033 as the most divergent (Figure 1 C1). This genotype should be used in hybrid combinations and to obtain new populations because of the high divergence it has shown, which therefore enables favorable gene combinations.
The coefficient of phenotypic correlation between the genetic distance and clustering analyses matrices has shown a high magnitude (0.86, 0.91 and 0.84) for agro-morphological, malting quality and molecular data, respectively, providing reliability for the visual assessment of data.
Pesq. agropec. bras., Brasília, v.48, n.7, p.748-756, jul. 2013
DOI: 10.1590/S0100‑204X2013000700007
selection process by plant breeders becomes difficult (Piepho & Williams, 2006).
Bertan et al. (2009) compared genetic and morphological dissimilarities in wheat and also found low correlation values (0.05). Liu et al. (2007) observed that there was no significant correlation among the matrices generated by microsatellite and agro-morphological markers in wheat. However, Lund et al. (2013) observed a certain association between the microsatellite markers and agro-morphological descriptors in barley. According to N’Goran et al. (1994), the possible association between genetic and phenotypic dissimilarity varies with the size and genetic variability of samples, and also with the different properties of molecular markers and morphological traits. The sequence DNA variation not always results in phenotypic variations. Also, the lack of phenotypic variations not always means a lack of DNA variation, since different genes could result in the expression of a same phenotype (Rana et al., 2005).
The lack of association among the estimates should not be considered as a limitation of these tools to access genetic variability; on the contrary, it should be considered as an indication of complementarity among them (Lefebvre et al., 2001; Rana et al., 2005; Li et al., 2008), which can be explained by different properties of molecular markers and qualitative and quantitative traits. Thus, the integration and complementary use of molecular information and qualitative and quantitative traits are important for the selection of both elite genotypes and potential genitors in breeding programs.
The elite genotype selection based on quantitative traits was performed using Elston’s selection index (1963) (Table 1). Since the criteria for cut‑off points
concerning the traits were very strict, only genotypes PFC 99324, BRS 180 and CPAC 20020098 showed values above zero. These are all six-rowed genotypes that meet the established requirements for selection related to agronomic traits, and are therefore appropriate for use in the final stages of the breeding program.
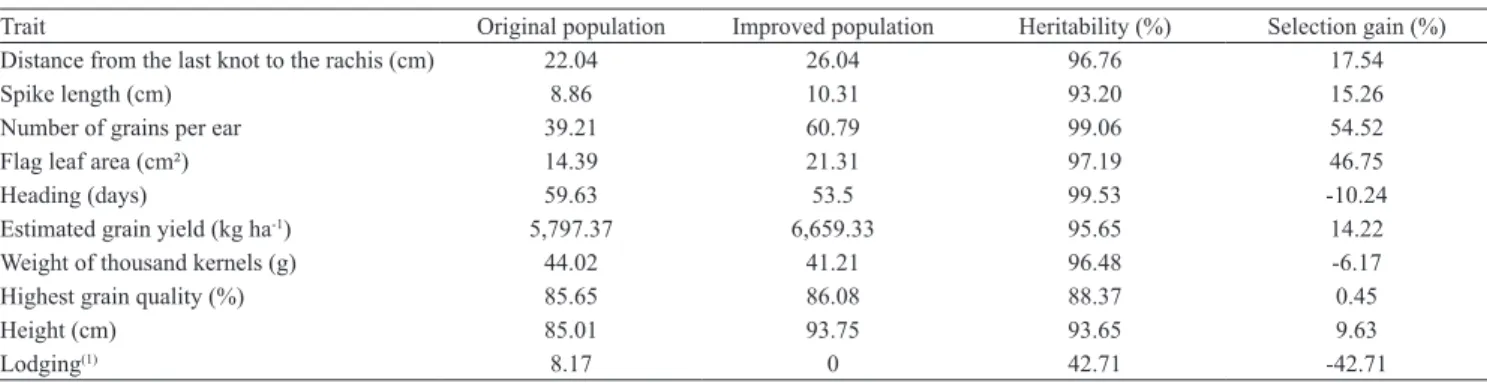
The selected genotypes showed positive selection gains for distance from the last knot to rachis, spike length, number of grains per ear, flag leaf area, estimated grain yield, better grain quality, and plant height (Table 2). Except for plant height, these positive gains are desirable. Although plant height was greater in the selected genotypes, they showed no lodging degree, and exhibited a negative selection gain, which is desirable. The predicted gains, high number of grains per ear, and flag leaf area are in agreement with the barley ideotype defined by Rasmusson (1987), who establishes a genotype with a higher number of grains per ear and leaf area. Negative selection gains were found for heading period (indicating the highest genotype earliness), and also for thousand kernel weight. The latter trait did not strongly affect yield, but it was compensated by other primary yield traits, as the length and number of grains per ear. It is important to emphasize that thousand kernel weight is a trait which contributes for yield increase (Rasmusson, 1987).
The broad heritability coefficients were above 88% for most of the traits, evidencing a higher genetic contribution related to the environmental effect for the phenotype selection (Table 2). Similar results for heading (99.13%) and plant height (95%) were observed by Marquez-Cedillo et al. (2001); for thousand kernel weight (97.32%) by Chand et al. (2008); and for the best quality grain (96.67%) by Fox (2008). Lodging,
Table 2. Estimates of broad heritability, selection gains, mean original population, and improved population for different traits of elite barley genotypes under an irrigated system in the Brazilian savanna.
Trait Original population Improved population Heritability (%) Selection gain (%) Distance from the last knot to the rachis (cm) 22.04 26.04 96.76 17.54
Spike length (cm) 8.86 10.31 93.20 15.26
Number of grains per ear 39.21 60.79 99.06 54.52
Flag leaf area (cm²) 14.39 21.31 97.19 46.75
Heading (days) 59.63 53.5 99.53 -10.24
Estimated grain yield (kg ha-1) 5,797.37 6,659.33 95.65 14.22
Weight of thousand kernels (g) 44.02 41.21 96.48 -6.17
Highest grain quality (%) 85.65 86.08 88.37 0.45
Height (cm) 85.01 93.75 93.65 9.63
Lodging(1) 8.17 0 42.71 -42.71
with an estimated heritability of 42.71%, is in the interval reported by Gut et al. (2004).
Values found for the selection index based on the ideotype were used to select elite genotypes according to their qualitative traits. The genotypes Vicente Morales, Foster, BRS 195, CPAC 20020098 and Alliot (Table 1) showed the closest values to the ideotype.
The position of selected genotypes in the dispersion graphs (Figure 1, A2, B2 and C2) evidenced the genetic distances among them. Based on these distances, the most divergent crosses among the selected genotypes, according to quantitative traits and malting quality, can be indicated as: CPAC 20020098 x Vicente Morales, CPAC 20020098 x BRS 180, Foster x BRS 180, Alliot x BRS 180 and BRS 195 x BRS 180. These crosses enable the combination of targeted traits and maximization of genetic distances among potential genitors, increasing the possibilities of interested genic complementation.
Conclusions
1. The elite barley genotype collection has genetic diversity based on agro-morphological traits, malting quality, and molecular markers.
2. Genetic dissimilarity estimates based on
molecular markers, quantitative and qualitative traits are weakly correlated.
3. There is a complementarity of agro-morphological, quality, and molecular traits when studying the genetic diversity.
4. The use of selection indices and graphical
dispersion analyses of genotypes enables the selection of promising genotypes and crosses, in order to maximize the heterotic effects and genic complementarity in the genetic breeding program for irrigated barley in the Brazilian savanna.
Acknowledgement
To Empresa Brasileira de Pesquisa Agropecuária (Embrapa), and to Conselho Nacional de Desenvolvimento Científico e Tecnológico (CNPq), for financial support.
References
ABDELLAOUI, R.; M´HAMED, H.C.; NACEUR, M.B.; BETTAIEB-KAAB, L.; BEN HAMIDA, J. Morpho-physiological
and molecular characterization of some Tunisian barley ecotypes.
Asian Journal of Plant Sciences, v.6, p.261-268, 2007. DOI:
10.3923/ajps.2007.261.268.
AMABILE, R.F.; MINELLA, E.; OLIVEIRA, M. de O.; FRONZA, V. Cevada (Hordeum vulgare L.). In: PAULA JÚNIOR, T.J. de; VENZON, M. (Ed.). 101 culturas: manual de tecnologias agrícolas. Belo Horizonte: Epamig, 2007. p.263-268.
BERTAN, I.; CARVALHO, F.I.F. de; OLIVEIRA, A.C. de; BENIN, G.; VIEIRA, E.A.; VALÉRIO, I.P. Morphological, pedigree, and molecular distances and their association with hybrid wheat performance. Pesquisa Agropecuária Brasileira, v.44, p.155-163,
2009. DOI: 10.1590/S0100‑204X2009000200007.
BORÉM, A. Hibridação artificial de plantas. Viçosa: UFV, 2009. 625p.
BRASIL. Ministério da Agricultura e Abastecimento. Portaria 691, de 22 de novembro de 1996. Aprova a norma de identidade e qualidade da cevada, para comercialização interna. Diário Oficial [da] República
Federativa do Brasil, 25 nov. 1996. Seção 1, p.24751‑24752.
CANCI, P.C.; NDUULU, L.M.; DILL-MACKY, R.; MUEHLBAUER, G.J.; RASMUSSON, D.C.; SMITH, K.P. Genetic relationship between kernel discoloration and grain protein concentration in barley. Crop
Science, v.43, p.1671‑1679, 2003. DOI: 10.2135/cropsci2003.1671.
CECCARELLI, S.; GRANDO, S.; CAPETTINI, F.; BAUM, M. Barley breeding for sustainable production. In: KANG, M.; PRIYADARSHAN, P.M. (Ed.). Breeding major food
staples. Iowa: Blackwell Publishing, 2007. p.193‑225. DOI:
10.1002/9780470376447.ch7.
CHAND, N.; VISHWAKARMA, S.R.; VERMA, O.P.; KUMAR, M. Worth of genetic parameters to sort out new elite barley lines over heterogeneous environments. Barley Genetics Newsletter, v.38, p.10-13, 2008.
COSTA, A.M.; FALEIRO, F.G.; KARIA, C.T.; SHIRATSUCHI, L.S.;
ANDRADE, R.P. de; LOPES, G.K.B. Variabilidade genética e ecológica de Stylosanthes macrocephala determinadas por RAPD e SIG. Pesquisa Agropecuária Brasileira, v.40, p.899‑909, 2005. DOI:
10.1590/S0100‑204X2005000900010.
CRUZ, C.D. Programa Genes: aplicativo computacional em genética
e estatística: versão windows. Viçosa: UFV, 1997. v.1, 442p.
ELSTON, R.C. A weight-free index for the purpose of ranking or selection with respect to several traits at a time. Biometrics, v.19,
p.85‑97, 1963. DOI: 10.2307/2527573.
EUROPEAN BREWERY CONVENTION. Analytica-EBC.
Nürnberg: Fachverlag Hans Carl, 1997. 680p.
EVANS, D.E.; DAMBERGS, R.; RATKOWSKY, D.; LI, C.;
HARASYMOW, S.; ROUMELIOTIS, S.; EGLINTON, J.K. Refining
the prediction of potential malt fermentability by including an assessment of limit dextrinase thermostability and additional measures
of malt modification, using two different methods for multivariate
model development. Journal of the Institute of Brewing, v.116,
p.86‑96, 2010. DOI: 10.1002/j.2050‑0416.2010.tb00403.x.
FALEIRO, F.G.; FALEIRO, A.S.G.; CORDEIRO, M.C.R.; KARIA, C.T. Metodologia para operacionalizar a extração de DNA de
espécies nativas do Cerrado. Planaltina: Embrapa Cerrados, 2003.
Pesq. agropec. bras., Brasília, v.48, n.7, p.748-756, jul. 2013
DOI: 10.1590/S0100‑204X2013000700007
FAOSTAT: statistical databases. Roma: FAO, 2012. Disponível em:
<http://faostat.fao.org>. Acesso em: 02 jun. 2012.
FOX, G.P. Biochemical and molecular evaluation of quality for
malt and feed barley. 2008. 179p. Thesis (PhD) – Southern Cross
University, Lismore.
FOX, G.P.; KELLY, A.M.; CAKIR, M.; BLOUSTEIN, G.; POULSEN,
D.M.E.; INKERMAN, P.A.; HENRY, R.J. Genetic impacts of the hull on barley grain quality. Journal of the Institute of Brewing, v.112,
p.101‑107, 2006. DOI: 10.1002/j.2050‑0416.2006.tb00238.x. GUT, M.; BICHOŃSKI, A.; WĘGRZYN, S. Heritability, variation and
relationship between frost resistance of winter barley and some of its characters. Electronic Journal of Polish Agricultural Universities,
v.7, 2004. Available at: <http://www.ejpau.media.pl/volume7/issue1/ agronomy/art‑02.html>. Accessed on: 2 May 2011.
KARIM, K.; RAWDA, A.; HATEM, C.-M. Genetic diversity in barley genetic diversity in local Tunisian barley based on RAPD and SSR analysis. Biological Diversity and Conservation, v.2/1, p.27‑35,
2009.
LEFEBVRE, V.; GOFFINET, B.; CHAUVET, J.C.; CAROMEL, B.;
SIGNORET, P.; BRAND, R.; PALLOIX, A. Evaluation of genetic
distances between pepper inbred lines for cultivar protection purposes: comparison of AFLP, RAPD, and phenotypic data. Theoretical
and Applied Genetics, v.102, p.741‑750, 2001. DOI: 10.1007/
s001220051705.
LI, F.; GAN, S.; WENG, Q.; ZHAO, X.; HUANG, S.; LI, M.; CHEN,
S.; WANG, Q.; SHI, F. RAPD and morphological diversity among four populations of the tropical tree species Paramichelia baillonii
(Pierre) Hu in China. Forest Ecology and Management, v.255,
p.1793‑1801, 2008. DOI: 10.1016/j.foreco.2007.12.002.
LIU, J.; LIU, L.; HOU, N.; ZHANG, A.; LIU, C. Genetic diversity of wheat gene pool of recurrent selection assessed by microsatellite markers and morphological traits. Euphytica, v.155, p.249‑258, 2007.
DOI: 10.1007/s10681‑006‑9326‑x.
LUND, B.; ORTIZ, R.; BOTHMER, R. von; ANDERSEN, S.-B. Detection of duplicates among repatriated Nordic spring barley (Hordeum vulgare L. s.l.) accessions using agronomic and morphological descriptors and microsatellite markers. Genetic
Resources and Crop Evolution, v.60, p.1‑11, 2013. DOI: 10.1007/
s10722‑012‑9809‑7.
MANJUNATHA, T.; BISHT, I.S.; BHAT, K.V.; SINGH, B.P. Genetic diversity in barley (Hordeum vulgare L. ssp. vulgare) landraces from Uttaranchal Himalaya of India. Genetic Resources and Crop
Evolution, v.54, p.55‑65, 2007. DOI: 10.1007/s10722‑005‑1884‑6.
MARQUEZ-CEDILLO, L.A.; HAYES, P.M.; KLEINHOFS, A.; LEGGE, W.G.; ROSSNAGEL, B.G.; SATO, K.; ULLRICH, S.E.;
WESENBERG, D.M. QTL analysis of agronomic traits in barley based on the doubled haploid progeny of two elite North American varieties representing different germplasm groups. Theoretical and Applied
Genetics, v.103, p.625‑637, 2001. DOI: 10.1007/PL00002919.
MATUS, I.A.; HAYES, P.M. Genetic diversity in three groups of barley germplasm assessed by simple sequence repeats. Genome,
v.45, p.1095‑1106, 2002. DOI: 10.1139/G02‑071.
N’GORAN, J.A.K.; LAURENT, V.; RISTERUCCI, A.M.; LANAUD, C. Comparative genetic diversity studies of Theobroma cacao L. using RFLP and RAPD markers. Heredity, v.73, p.589‑597, 1994. DOI:
10.1038/hdy.1994.166.
PIEPHO, H.P.; WILLIAMS, E.R. A comparison of experimental designs for selection in breeding trials with nested treatment structure.
Theoretical and Applied Genetics, v.113, p.1505-1515, 2006. DOI:
10.1007/s00122‑006‑0398‑8.
RANA, M.K.; SINGH, V.P.; BHAT, K.V. Assessment of genetic diversity in upland cotton (Gossypium hirsutum L.) breeding lines
by using amplified fragment length polymorphism (AFLP) markers
and morphological characteristics. Genetic Resources and Crop
Evolution, v.52, p.989‑997, 2005. DOI: 10.1007/s10722‑003‑6113‑6.
RASBAND, W.S. ImageJ. Bethesda: U.S. National Institutes of
Health, 2006. Available at: <http://rsb.info.nih.gov/ij/>. Accessed on:
1 Aug. 2011.
RASMUSSON, D.C. An evaluation of ideotype breeding. Crop
Science, v.27, p.1140‑1146, 1987. DOI: 10.2135/cropsci1987.00111
83X002700060011x.
ROHLF, F.J. NTSYS‑pc: numerical taxonomy and multivariate
analysis system. Version 2.1. New York: Exeter Software, 2000. 98p.
SARKAR, B.; VERMA, R.P.S.; MISHRA, B. Genetic diversity for malting quality in barley (Hordeum vulgare L.). Indian Journal of
Agricultural Sciences, v.68, p.163-170, 2008.
SHAKHATREH, Y.; HADDAD, N.; ALRABABAH, M.; GRANDO, S.; CECCARELLI, S. Phenotypic diversity in wild barley (Hordeum
vulgare L. ssp. spontaneum (C. Koch) Thell.) accessions collected in
Jordan. Genetic Resources and Crop Evolution, v.57, p.131-146,
2010. DOI: 10.1007/s10722‑009‑9457‑8.
VERMA, R.P.S.; SARKAR, B. Diversity for malting quality in barley
(Hordeum vulgare) varieties released in India. Indian Journal of
Agricultural Sciences, v.80, p.493‑500, 2010.
YASUHARA, T.; NOKIHARA, K. High-throughput analysis of total nitrogen content that replaces the classic Kjeldahl method. Journal of
Agricultural and Food Chemistry, v.49, p.4581‑4583, 2001. DOI:
10.1021/jf010448z.