Vol.53, n. 6: pp.1477-1486, November-December 2010
ISSN 1516-8913 Printed in Brazil BRAZILIAN ARCHIVES OF
BIOLOGY AND TECHNOLOGY
A N I N T E R N A T I O N A L J O U R N A L
Genetic Divergence in Sweet Cassava Cultivars Using
Morphological Agronomic Traits and RAPD Molecular
Markers
Fabrício Rimoldi
1, Pedro Soares Vidigal Filho
1*, Marcus Vinícius Kvitschal
2, Maria Celeste
Gonçalves-Vidigal
1, Alberto José Prioli
3, Sônia Maria Alves Pinto Prioli
3and Tiago Ribeiro
da Costa
11Departamento de Agronomia; Universidade Estadual de Maringá; Av. Colombo, 5790; 87020-570; Maringá - PR -
Brasil. 2Melhoramento Genético Vegetal; Empresa de Pesquisa Agropecuária e Extensão Rural de Santa Catarina; Rua Abílio Franco, 1500, C. P.: 591; 89500-000; Caçador - SC - Brasil. 3Departamento de Biologia; Universidade Estadual de Maringá; Av. Colombo, 5790; 87020-570; Maringá - PR - Brasil
ABSTRACT
In this work the genetic divergence among 14 sweet cassava cultivars was estimated by their morphological agronomic traits and RAPD molecular markers. The Tocher cluster analysis and the Nearest Neighbor Method were applied. The most dissimilar cultivars were Pão and Guaíra, Fécula Branca and Pão, and Pão and Caipira, while the most similar cultivar were the Fécula Branca and Branca 1, Branca 3 and Branca 1, and Guaíra and Branca 1. The Jaccard’s coefficient showed that the most similar cultivars were Guaíra and Quarenta Quilos, while the most dissimilar were Branca 3 and Amarela da Rama Cinza. The divergence analysis indicated that promising crosses could be made between the Branca 3 cultivar and the Pão, Amarela 1, Fécula Branca and Amarela 2 cultivars for the high genetic divergence, favorable agronomic and culinary traits, and disease resistance on the part of at least one of the parents involved in the cross.
Key words: Genetic diversity; Manihot esculenta; Multivariate analysis.
*Author for correspondence: psvfilho@uem.br
INTRODUCTION
In the Manihot esculenta Crantz species, there are some common problems with the nomenclature and characterization of cultivars. These problems mainly pertain to sweet cassava, due to its cultivation by smallholders that generally select and distribute the cultivars by themselves (Zacharias et al., 2004). Therefore, sometimes the same genotype can possess different names or different genotypes may have the same name
Generally, these descriptors have high herdability, suggesting that they are expressed even in different environments (Fukuda and Guevara, 1998). However, the cultivar characterization based only on morphological descriptors can also be frequently subject to errors that result from variations in environmental conditions, especially if the cultivars under study are of similar origin, or if some agronomic characteristics are not specific (Carvalho and Schaal, 2001; Collard et al., 2005). In contrast, the recent advances in molecular biology techniques have provided useful tools for genetic studies on several plant species. The use of molecular markers may permit, among other aspects, the detection of more expressive genetic differences among the closest genotypes when compared with the use of morphological agronomic descriptors (Collard et al., 2005). Thus, the characterization of accessions kept in the germplasm banks can be more detailed and reliable if molecular markers are associated with the morphological agronomic traits. This considerably reduces the degree of difficulty in detecting the differences among genetically close individuals and further enables the identification of duplicates kept in the germplasm banks (Chavarriaga-Aguirre et al., 1999; Zacharias et al., 2004; Kizito et al. 2007; Zannou et al., 2009). The objective of the present study was to assess the genetic divergence among the traditional sweet cassava cultivars collected in the northern, western, and northwestern regions of Paraná State using morphological agronomic traits and RAPD molecular markers.
MATERIAL AND METHODS
The sweet cassava assessment experiments were set up in the municipality of Maringá (Iguatemi Experimental Farm – UEM) in the northwestern region of Paraná state, which has a wet mesothermic climate with hot summers and rains in the summer and fall rains. The predominant soil in the experimental area was dystrophic Red Latossol, and chemical analysis revealed the following characteristics: pH (H2O): 5.6; H
+ + Al3+ 3.68 cmolc.dm-3; Al3+: 0.00 cmolc.dm-3; Ca2+ + Mg2+: 4.47 cmolc.dm
-3
; Ca2+: 3.25 cmolc.dm -3
; K+: 0.23 cmolc.dm-3; and P: 6.00 mg.dm-3. A total of 14 sweet cassava cultivars, which were collected from the smallholders in the northern, northwestern, and western regions of Paraná state
(Rimoldi et al., 2006), were assessed in a completely randomized plot design with four replications (Cruz and Carneiro, 2006).
The soil was prepared by the minimum preparation system that used only a decompacting plow. In both the assessment periods, planting took place during the first two weeks of October by manually opening hill plots, and the cuttings were placed horizontally in holes that were approximately 0.10 m deep (Sagrilo et al., 2006). Standard crop treatments and fertilization for cassava crop were applied. Sinerge® herbicide (triazin + isoxazolidinon) was used to control the weeds and was applied during the pre-emergence stage at a dose of 4 L.ha-1 of the commercial product. The experimental units measured 8.0 m long by 4.0 m wide with four rows of plants spaced at 1.0 m intervals with 0.80 m between-plant spacing (Kvitschal et al., 2009). The useful area of the plots consisted of two central rows, and 0.80 m from the ends of each row was eliminated.
was expressed in t.ha-1 and obtained by weighing the existing canopy that began at 0.10 m above soil level; j) tuberous root yield (RY) from all plants that were harvested from the useful area of the plot, which was expressed in t ha-1 and obtained by weighing the tuberous roots; k) tuberous root cooking time (CT), which was expressed in min using the adapted Mattson apparatus (Mattson, 1946); and l) tuberous root dry matter percentage (DM) from a 3.0 kg tuberous root sample that was collected from each experimental plot, which was determined by the hydrostatic balance method (Grosmann and Freitas, 1950). The cyanide content (HCN) in the fresh storage root tissue, the cocking time, and the reaction to the bacterial blight of each cultivar evaluated can be found in Rimoldi et al. (2006). Plant tissue was also collected from the young leaves of each cultivar at this time for the analysis of molecular markers. Preliminary assessments of the 14 cultivars showed that every plant of each cultivar that was tested produced identical genotyped, which reflected a reliable degree of repeatability. Therefore, two individuals from each cultivar were assessed in the molecular analysis. DNA was extracted using the Doyle and Doyle (1990) protocol, with minor modifications. Five or six healthy young leaves were removed from each of the two representative plants from the 14 cultivars. The leaves were duly identified, placed in plastic bags, and taken immediately to the laboratory where they were squashed in liquid nitrogen.
A sample of approximately 150 mg of the squashed leaves was then transferred to an Eppendorf tube. After the addition of 700 µl of extraction buffer, the tubes were shaken and placed in a water bath at 60°C for 30 min. After cooling, the tubes were centrifuged for about 10 min, and 700 µl of the supernatant were collected. An equal volume (700 µl) of Sevag (isoamylic Chloroform:Alcohol – 24:1) was added, and the samples were manually shaken for 10 min. After another 10-minute centrifugation, 500 µl of the supernatant were removed, and 50 µl of 10% CTAB and 550 µl of Sevag were added. The samples were shaken and centrifuged for 10 min, and 400 µl of the supernatant were then collected. An equal volume of precipitation buffer (400 µl) was added, and the samples were incubated at room temperature for 15 min. The samples were centrifuged for 5 min, the supernatant was discarded, and 400 µl of high salt TE were added.
The samples were then incubated in a water bath at 65°C for 5 min. The tubes were shaken, 800 µl of chilled isopropyl alcohol were added, and the samples were placed in a freezer (-8°C) for 12 h. The DNA was washed the following morning. The samples were centrifuged, and the supernatant was discarded. To remove the salts, 700 µl of 70% ethanol was added. The sample was again centrifuged for 10 min, the supernatant was discarded, and the samples were dried at room temperature. The DNA was re-suspended in 30 µl RNAse/TE. The DNA was electrophoresed in a 0.8% agarose gel and quantified by comparing the band brightness to three different concentrations of lambda DNA. Based upon previously established standards for RAPD reactions, the concentration of each sample was set at 10 ng.µl-1.
For PCR, the following arbitrary primers were selected: OPJ 07, OPZ 04, OPK 14, OPJ 09, OPI 06, OPI 07, OPL 07, OPZ 09, OPY 16, OPJ 08, OPK 04, OPM 10, and OPM 05 (Operon Technologies, Alameda, CA, USA). The mixture for the amplification reactions (MIX) contained 4 M primers, Tris-KCl Buffer (20 mM Tris-HCl, pH 8.4 and 50 mM KCl) 50 mM MgCl2, 50 mM dNTP, 1 U Taq (2.5 mM) Polymerase, 3 to 5 ng of DNA and enough Milli-Q water to bring the mixture to a total volume of 13 µl.
divergence among the sweet cassava cultivars was assessed by constructing a binary data matrix that referenced the amplified polymorphic fragments of the RAPD molecular markers.
The similarity among the cultivars was estimated by the Jaccard’s coefficient. The complement of the Jaccard’s coefficient was used to analyze the clustering, and, thus, estimate the dissimilarity between the cultivars. The cultivars were then clustered by the nearest neighbor method and dispersed in a bidimensional graph, based upon the binary dissimilarity matrix that uses the computer resources of the GENES program (Cruz, 2006).
RESULTS AND DISCUSSION
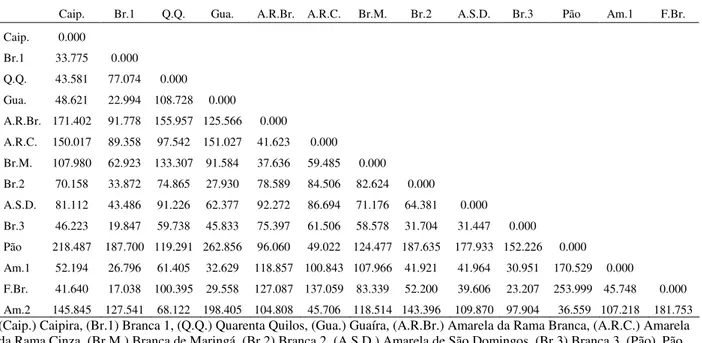
The genetic divergence averages among the sweet cassava cultivars were based upon the Mahalanobis generalized distance, which was estimated from morpho-agronomic traits (Table 1). The greatest genetic distances were observed among the Pão and Guaíra, the Fécula Branca and Pão, and the Pão and Caipira cultivars, which had
D2ii’ values with magnitudes of 262.856, 253.999, and 218.487, respectively. The cultivar pairs that
showed the smallest genetic distance values, and thus that were considered to be the most similar cultivars, were the Fécula Branca and Branca 1, the Branca 3 and Branca 1, and the Guaíra and Branca 1 cultivars, with values of 17.04, 19.85 and 22.99, respectively (Table 1). The Pão cultivar appeared the most frequently in combinations involving the more divergent cultivars, while the Branca 1 cultivar appeared the most frequently in combinations involving the closest cultivars. The Tocher cluster analysis, using the Mahalanobis generalized distance (D2ii’) as a measure of dissimilarity, created six groups of cultivars: Group I included the Branca 1, Fécula Branca, Branca 3, Guaíra, Amarela 1, and Branca cultivars and had a representativeness of 42.85%; Groups II, which included the Pão and Amarela 2 cultivars, III, which included the Amarela da Rama Branca and Branca de Maringá cultivars, and IV, which included the Caipira and Quarenta Quilos cultivars, each with a representativeness of 14.29%; and Groups V, which included the Amarela de São Domingos cultivar, and VI, which included the Amarela da Rama Cinza cultivar, with a representativeness of 7.14% each.
Table 1 - Dissimilarity matrix estimated by the Mahalanobis generalized distance (D2ii’) among the sweet cassava cultivars based on 12 morphological agronomic traits.
Caip. Br.1 Q.Q. Gua. A.R.Br. A.R.C. Br.M. Br.2 A.S.D. Br.3 Pão Am.1 F.Br. Caip. 0.000
Br.1 33.775 0.000 Q.Q. 43.581 77.074 0.000 Gua. 48.621 22.994 108.728 0.000
A.R.Br. 171.402 91.778 155.957 125.566 0.000
A.R.C. 150.017 89.358 97.542 151.027 41.623 0.000 Br.M. 107.980 62.923 133.307 91.584 37.636 59.485 0.000 Br.2 70.158 33.872 74.865 27.930 78.589 84.506 82.624 0.000
A.S.D. 81.112 43.486 91.226 62.377 92.272 86.694 71.176 64.381 0.000 Br.3 46.223 19.847 59.738 45.833 75.397 61.506 58.578 31.704 31.447 0.000 Pão 218.487 187.700 119.291 262.856 96.060 49.022 124.477 187.635 177.933 152.226 0.000 Am.1 52.194 26.796 61.405 32.629 118.857 100.843 107.966 41.921 41.964 30.951 170.529 0.000
F.Br. 41.640 17.038 100.395 29.558 127.087 137.059 83.339 52.200 39.606 23.207 253.999 45.748 0.000 Am.2 145.845 127.541 68.122 198.405 104.808 45.706 118.514 143.396 109.870 97.904 36.559 107.218 181.753
The dendrogram representing the genetic divergence among the sweet cassava cultivars, which was obtained by the nearest neighbor method and used D2ii’ as dissimilarity measurement, created two large groups (Fig. 1). Group I was divided into two subgroups, with a similarity of 43.58%. The first subgroup was formed by the Branca 1, Fécula Branca, Branca 3, Amarela 1, Guaíra, Branca 2, and Amarela de São Domingos cultivars, while the second group was formed by the Caipira and Quarenta Quilos cultivars. Group II was also divided into two subgroups with a similarity of 37.60%. The first subgroup was formed by the Amarela da Rama Branca and Branca de Maringá cultivars. The second subgroup was formed by the Amarela da Rama Cinza, Pão and Amarela 2 cultivars, which highlighted the proximity between the Pão and Amarela 2 cultivars (36.56%).
The Pão, Fécula Branca, and Caipira cultivars presented a good tuberous root yield, a low cyanide content, a fast-to-moderate tuberous root cooking time, a high dry matter content, and a low
incidence of cassava bacterial blight (Rimoldi et al., 2006). This collection of traits indicated that these three cultivars could be promising parents for sweet cassava genetic breeding programs (Coimbra et al., 1998). Although the Guaíra cultivar presented favorable agronomic traits, it also had a high susceptibility to cassava bacterial blight and superelongation (Rimoldi et al., 2006). The Amarela 2 cultivar, which presented satisfactory agronomic and culinary characteristics, should be another good parent choice for programs involving hybridizations, because it also was resistant to cassava bacterial blight and superelongation while presenting high genetic divergence from many of the studied cultivars (Table 1).
In contrast, crosses involving the Amarela 2 and the Quarenta Quilos, Amarela da Rama Cinza and Pão cultivars were not indicated, given the genetic proximity observed between these cultivars (Fig. 1), which would result in a low heterogenetic effect in the resulting progenies.
Branca 1 Fécula Branca Branca 3 Amarela 1 Guaíra Branca 2
Amarela de São Domingos Caipira
Quarenta Quilos Amarela da Rama Branca Branca de Maringá Amarela da Rama Cinza Pão
Amarela 2
I
II
10
Figure 1 - Dendrogram representative of the genetic divergence, based on morphological agronomic traits, among the 14 cultivars, obtained by the nearest neighbor analysis method using D2ii’ as dissimilarity measurement.
With respect to the molecular analyses, the 13 primers generated a total of 119 amplified bands, with an average of 9.15 bands per primer (Table 2). The amplified fragment sizes ranged from 150 to 2,000 base pairs. The selected primers displayed an 83.19% polymorphism rate among the 14 cultivars, and 99 bands, at an average of 7.61 bands per primer, produced a different pattern for at least two separate cultivars. These results demonstrated that there was a wide range of genetic variability among all the 14 cultivars,
which was in line with previously reported results (Farias et al., 1997; Chavarriaga-Aguirre et al., 1999; Zacharias et al., 2004; Peroni et al., 2007; Kizito et al., 2007; Siqueira et al., 2009).
obtained from smallholders; and c) farmers mainly propagated the cassava vegetatively through stem cuttings that were obtained from mature plants in their fields. Occasionally, these small-scale farmers would also incorporate cuttings, which
have been obtained from volunteer seedlings produced by sexual reproduction, into their varieties (Emperaire and Peroni, 2007; Kizito et al. 2007).
Table 2 - Primers used, base sequences, number of polymorphic bands obtained and size of the amplified RAPD fragments of 14 traditional sweet cassava cultivars.
Primer Sequence (5’ 3’) Amplified bands Polymorphic bands Length (pb)
OPI 06 AAGGCGGCAG 12 12 350 to 1,400
OPI 07 CAGCGACAAG 13 7 150 to 1,800
OPJ 07 CCTCTCGACA 12 11 450 to 2,000
OPJ 08 CATACCGTGG 7 6 500 to 1,500
OPJ 09 TGAGCCTCAC 5 5 500 to 1,800
OPK 04 CCGCCCAAAC 13 11 380 to 1,800
OPK 14 CCCGCTACAC 10 7 450 to 2,000
OPL 07 AGGCGGGAAC 6 6 300 to 1,400
OPM 10 TCTGGCGCAC 7 5 300 to 1,800
OPN 05 ACTGAACGCC 8 8 450 to 1,700
OPY 16 GGGCCAATGT 9 8 450 to 2,000
OPZ 04 AGGCTGTGCT 8 5 450 to 1,200
OPZ 09 CACCCCAGTC 9 8 600 to 1,900
An example of a polymorphic band pattern, using the OPK 14 primer, is shown in Figure 2. For this molecular marker, a band of 750 bp was present in the Amarela da Rama Cinza cultivar but absent in the Branca 1, Quarenta Quilos, Guaíra, Amarela de São Domingos, Branca 3, Pão, Amarela 1, and Amarela 2 cultivars. These cultivars were the most divergent shown by molecular analysis (Table 3).
The genetic dissimilarities, which were determined by the arithmetical complement of Jaccard’s coefficient, are shown in Table 3. This methodology has been used in several studies on different crops, which are reported in the literature. Costa et al. (2003) used the Jaccard’s coefficients
to estimate the genetic similarity among sweet cassava cultivars using RAPD molecular markers, and Ceolin et al. (2007) used the Jaccard’s coefficient arithmetic complements to measure the genetic dissimilarity in common bean accessions. In the present study, molecular analysis indicated that the cultivars that were the closest genetically were the Guaíra and Quarenta Quilos (dii’ = 23.38), the Amarela da Rama Branca and Branca de Maringá (dii’ = 26.67), and the Branca de Maringá and Branca 2 (dii’ = 28.24) cultivars. The most divergent combinations were the Branca 3 and Amarela da Rama Cinza and the Branca 3 and Amarela 2 cultivars, with dissimilarity values of 58.03 and 57.84, respectively.
750 pb
1 2 3 4 5 6 7 8 9 10 11 12 13 14
Table 3 - Jaccard’s coefficient (above the diagonal) and its arithmetical complements (below the diagonal), obtained with RAPD molecular markers, among 14 sweet cassava cultivars. Maringá, 2004.
Caip. Br.1 Q.Q. Gua. A.R.Br. A.R.C. Br.M. Br.2 A.S.D. Br.3 Pão Am.1 F.Br. Am.2
Caip. 0.0 0.488 0.575 0.548 0.591 0.564 0.495 0.529 0.472 0.468 0.488 0.558 0.512 0.453
Br.1 0.512 0.0 0.558 0.551 0.574 0.566 0.674 0.624 0.635 0.424 0.628 0.561 0.692 0.642
Q.Q. 0.425 0.442 0.0 0.766 0.698 0.524 0.614 0.563 0.575 0.545 0.524 0.556 0.585 0.506
Gua. 0.452 0.449 0.234 0.0 0.667 0.467 0.587 0.556 0.516 0.482 0.483 0.512 0.506 0.467
A.R.Br. 0.409 0.426 0.302 0.333 0.0 0.527 0.733 0.648 0.624 0.511 0.616 0.556 0.636 0.543
A.R.C. 0.436 0.434 0.476 0.533 0.473 0.0 0.568 0.553 0.602 0.420 0.571 0.627 0.636 0.530
Br.M. 0.505 0.326 0.386 0.413 0.267 0.432 0.0 0.718 0.615 0.449 0.646 0.581 0.687 0.602
Br.2 0.471 0.376 0.437 0.444 0.352 0.447 0.282 0.0 0.621 0.482 0.633 0.585 0.654 0.570
A.S.D. 0.528 0.365 0.425 0.484 0.376 0.398 0.385 0.379 0.0 0.459 0.605 0.578 0.627 0.600
Br.3 0.532 0.576 0.455 0.518 0.489 0.580 0.551 0.518 0.541 0.0 0.455 0.468 0.481 0.422
Pão 0.513 0.372 0.476 0.517 0.384 0.429 0.354 0.367 0.395 0.545 0.0 0.566 0.662 0.653
Am.1 0.442 0.439 0.444 0.488 0.444 0.373 0.419 0.415 0.422 0.532 0.434 0.0 0.653 0.603
F.Br. 0.488 0.308 0.415 0.494 0.364 0.364 0.313 0.346 0.373 0.519 0.338 0.347 0.0 0.593
Am.2 0.547 0.358 0.494 0.533 0.457 0.470 0.398 0.430 0.400 0.578 0.347 0.397 0.407 0.0
(Caip.) Caipira, (Br.1) Branca 1, (Q.Q.) Quarenta Quilos, (Gua.) Guaíra, (A.R.Br.) Amarela da Rama Branca, (A.R.C.) Amarela da Rama Cinza, (Br.M.) Branca de Maringá, (Br.2) Branca 2, (A.S.D.) Amarela de São Domingos, (Br.3) Branca 3, (Pão) Pão, (Am.1) Amarela 1, (F.Br.) Fécula Branca, (Am.2) Amarela 2.
The dendrogram obtained by applying the nearest neighbor analysis method is shown in Figure 3. This analysis divided the cultivars into four main groups. Group 1, which consisted of the Caipira and Branca 3 cultivars, was the most dissimilar (dii’ = 53.24) from the others. Group II consisted of the Guaíra, Quarenta Quilos and Amarela da Rama Branca cultivars, and, within this group, the first two were the most dissimilar (dii’ = 23.37). Group III, which was formed by the Branca 2 and Branca de Maringá cultivars, presented small genetic distances (dii’ = 28.23) and had the most similarities between group members compared with to the other cultivars. Group IV consisted of the Pão, Amarela 2, Branca 1, Amarela de São Domingos, Fécula Branca, Amarela da Rama Cinza, and Amarela 1 cultivars. Within this group,
the genetic proximity between the Pão and Amarela 2 cultivars (dii’ = 34.66), and between the Amarela da Rama Cinza and Amarela 1 cultivars (dii’ = 37.33) was highlighted.
The ability of morpho agronomic traits to illustrate genetic divergence has previously been reported in sweet cassava (Gonçalves-Vidigal et al., 1997; Chavarriaga-Aguirre et al., 1999; Colombo et al., 2000; Carvalho and Schaal, 2001; Zacharias et al., 2004; Kizito et al., 2007; Peroni et al., 2007; Siqueira et al., 2009) in the common bean
(Phaseolus vulgaris) (Ceolin et al., 2007), in
Pão Amarela 2 Branca 1
Amarela de São Domingos Fécula Branca
Amarela da Rama Cinza Amarela 1
Branca de Maringá Branca 2
Amarela da Rama Branca Quarenta Quilos Guaíra Caipira Branca 3
IV
III
II
I
Figure 3 - Dendrogram representative of the genetic divergence among 14 sweet cassava cultivars, obtained by the nearest neighbor analysis method.
This study suggested that a wide range of genetic diversity existed within the sweet cassava germplasm from Paraná state and that this diversity could be useful in the breeding programs. In addition to previous suggestions by Fontes et al. (2002) and Costa et al. (2003) that the genetic distance between the parent cultivars in breeding programs should be high, favorable agronomic traits should be present in at least one, if not both, parents. The data indicates that the Branca 3 cultivar should be crossed with the Pão, Amarela 1, Fécula Branca, and Amarela 2 cultivars for several reasons: a) the high genetic divergence observed between these cultivars, c) the presence of favorable agronomic and culinary characteristics within at least one potential parent, and c) disease resistance on the part of at least one potential parents.
An isolated case that needed great attention from the sweet cassava breeders was the cross between the Branca 3 and Amarela 2 cultivars. This hybridization could be a promising option for the breeder due to the high genetic divergence between these two cultivars, the associated resistance to cassava bacterial blight and superelongation, the low cyanide content, and the shorter cooking time for the tuberous root of the Amarela 2 cultivar (Rimoldi et al., 2006). Although there was high genetic divergence between the Branca 3 and Amarela da Rama Cinza cultivars, they would not be as likely to represent good parents for hybridization, since both of the cultivars were highly susceptible to cassava bacterial blight (Rimoldi et al., 2006).
Since the results that were obtained by the analysis of the morphological agronomic traits were partially similar to those obtained by analysis of the molecular markers, it could be strongly suggested that these results be considered together. When taking into account the genetic divergence results that were estimated by the morphological agronomic traits and by the molecular analyses, the disease resistance/susceptibility of each cultivar, and the agronomic and culinary characteristics of each of the sweet cassava cultivars (Rimoldi et al., 2006), several hybridization options could be suggested from among the more divergent cultivars in order to establish base populations for clone selection. The fact that sweet cassava could be vegetatively propagated means that all heterogenic effects would be apparent in the F1 population, which would greatly facilitate the sweet cassava genetic breeding process.
these cultivars to cassava bacterial blight contraindicated their utility for cross-hybridization.
CONCLUSIONS
• The Mahalanobis generalized distance indicated that the most dissimilar pairs of cultivars were the Pão and Guaíra, the Fécula Branca and Pão, and the Pão and Caipira, whereas the most similar were the Fécula Branca and Branca 1, the Branca 3 and Branca 1, and the Guaíra and Branca 1;
• The Jaccard’s coefficients indicated that the most similar cultivars were the Guaíra and Quarenta Quilos, whereas the most dissimilar were the Branca 3 and Amarela da Rama Cinza;
• The results that were obtained from the agronomic and morphological traits partially agreed with those obtained by the RAPD markers; • Taken together, these data indicated that promising crosses could be made between the Branca 3 cultivar and the Pão, Amarela 1, Fécula Branca, or Amarela 2 cultivars, because of the high genetic divergence observed between the Branca 3 and these cultivars, their favorable agronomic and culinary characteristics, and the disease resistance on the part of at least one parent that would be involved in the cross.
ACKNOWLEDGMENTS
The authors thank the Araucária Foundation, Capes, CNPq and the professors, undergraduates, graduates and staff of the Universidade Estadual de Maringá whose help was essential in carrying out this study.
RESUMO
A divergência genética entre 14 cultivares de mandioca-de-mesa foi estimada mediante o uso de caracteres morfoagronômicos e de marcadores moleculares RAPD. As análises de agrupamento de Tocher e do Vizinho Mais Próximo foram efetuadas. As cultivares mais divergentes foram Pão e Guaíra, Fécula Branca e Pão, e Pão e Caipira, enquanto as mais similares foram Fécula Branca e Branca 1, Branca 3 e Branca 1, e Guaíra
e Branca 1. O coeficiente de Jaccard indicou que as cultivares mais similares foram Guaíra e Quarenta Quilos, enquanto as mais dissimilares foram Branca 3 e Amarela da Rama Cinza. A análise de divergência indicou que cruzamentos promissores deveriam ser efetuados entre as cultivares Branca 3, Pão, Amarela 1, Fécula Branca e Amarela 2 pela alta divergência genética, características agronômicas e culinárias favoráveis, e resistência à doenças de parte de pelo menos um dos parentais envolvidos no cruzamento.
REFERENCES
Allen, A. C. (1994), The origin of Manihot esculenta
Crantz (Euphorbiaceae). Genet. Resour. Crop Evol.,
41, 133-150
Carvalho, L. J. C. B.; Schaal, B. A. (2001), Assessing genetic diversity in the cassava (Manihot esculenta, Crantz) germplasm collection in Brazil using PCR-based markers. Euphytica, 120, 133-142.
Ceolin, A. C. G.; Gonçalves-Vidigal, M. C.; Vidigal Filho, P. S.; Kvitschal, M. V.; Gonela, A.; Scapim, C. A. (2007), Genetic divergence of Phaseolus vulgaris
L. using morpho-agronomic traits by multivariate analysis. Hereditas, 144, 1-9.
Chavarriaga-Aguirre, P.; Maya, M. M.; Tohme, J.; Duque, M. C.; Iglesias, C.; Bonierbale, M. W.; Kresovich, S.; Kochert G. (1999), Using microsatellites, isozymes and AFLPs to evaluate genetic diversity and redundancy in the cassava core collection and to assess the usefulness of DNA-based markers to maintain germplasm collections. Mol. Breed.,5, 263–273.
Choudhury, P. R.; Singh, I. P.; George, B.; Verma, A. K.; Singh N. P. (2008), Assessment of genetic diversity of pigeonpea cultivars using RAPD analysis. Biol. Plant., 52(4), 648-653.
Coimbra, J. L. M.; Guidolin, A. F.; Carvalho, F. I. F. (1998), Coeficientes de trilha, correlações canônicas e divergência genética entre caracteres primários e secundários do rendimento de grãos em genótipos de feijão preto (Phaseolus vulgaris, L.). Pesqui. Agropecu. Gauc.,4, 189-194.
Collard, B. C. Y.; Jahufer, M. Z .Z.; Brouwer, J. B.; Pang, E. C. K. (2005), An introduction to markers, quantitative trait loci (QTL) mapping and marker-assisted selection for crop improvement: The basic concepts. Euphytica, 142, 169-196.
Costa, M. R.; Cardoso, E. R.; Ohaze, M. M. M. (2003), Similaridade genética de cultivares de mandioca (Manihot esculenta, Crantz) por meio de marcadores RAPD. Ciênc. Agrotec.,27, 158-164.
Cruz, C.D. (2006), Programa Genes: versão Windows; aplicativo computacional em genética e estatística. UFV, Viçosa, pp. 648.
Cruz, C. D.; Carneiro, P. C. S. (2006), Modelos biométricos aplicados ao melhoramento genético,
2.ed. rev., UFV – Imprensa Universitária, Viçosa, pp. 585.
Doyle, J. J.; Doyle, J. L. (1990), Isolation of plant DNA from fresh tissues. Focus, 27, 13-15.
Emperaire, L.; Peroni, N. (2007), Traditional management of agrobiodiversity in Brazil: a case study of manioc. Hum. Ecol.,35, 761-768.
Farias, F. J. C.; Ramalho, M. A. P.; Carvalho, L. P.; Moreira, J. A. N.; Costa, J. N. (1997), Parâmetros de estabilidade propostos por Lin e Binns (1988) comparados com o método da regressão. Pesqui. Agropecu. Bras.,32, 407-414.
Fontes, J. R. M.; Sakiyama, N. S.; Cardoso, A. A.; Zambolim, L.; Pereira, A. A. (2002), Avaliação de híbridos F1 de café (Coffea arábica, L.) e respectivos progenitores com marcadores RAPD. Ceres,49, 283-294.
Fukuda, W. M. G.; Guevara, C. L. (1998), Descritores morfológicos e agronômicos para a caracterização de mandioca (Manihot esculenta Crantz). Documentos – 78. Embrapa-CNPMF: Cruz das Almas.
Gonçalves-Vidigal, M. C.; Vidigal Filho, P. S.; Amaral Júnior, A. T.; Braccini, A. L. (1997), Divergência genética entre cultivares de mandioca por meio de estatística multivariada. Bragantia,56(2), 263-271. Grosmann, J.; Freitas, A. G. (1950), Determinação do
teor de matéria seca pelo peso específico em raízes de mandioca. Rev. Agropecu., 14, 75-80.
Iqbal, A.; Khan, A. S.; Khan, I. A.; Awan, F. S.; Ahmad, A.; Khan A. A. (2007), Study of genetic divergence among wheat genotypes through random amplified polymorphic DNA. Genet. Mol. Res., 3(6), 476-481.
Kizito, E. B.; Chiwona-Karltun, L.; Egwang, T.; Fregene, M.; Westerbergh, A. (2007), Genetic diversity and variety composition of cassava on small-scale farms in Uganda: an interdisciplinary study using genetic markers and farmer interviews.
Genetics,130, 301-318.
Kvitschal, M. V.; Vidigal Filho, P. S.; Scapim, C. A.; Gonçalves-Vidigal, M. C.; Sagrilo, E.; Pequeno, M. G.; Rimoldi, F. (2009), Comparison of methods for phenotypic stability analysis of cassava (Manihot esculenta Crantz) genotypes for yield and storage root dry matter content. Braz. Arch. Biol. Technol.,
52(1), 163-175.
Mattson (1946), The cook ability of yellow peas. Acta Agric. Suec., 1, 185-190.
Peroni, N.; Kageyama, P. Y.; Begossi, A. (2007), Molecular differentiation, diversity, and folk classification of ‘sweet’ and ‘bitter’cassava (Manihot
esculenta, Crantz) in Caiçara and Cabloco
management systems (Brazil). Genet. Resour. Crop Evol.,54, 1333-1349.
Rimoldi, F.; Vidigal Filho, P. S.; Gonçalves-Vidigal M. C.; Clemente, E.; Pequeno, M. G.; Miranda, L.; Kvitschal, M. V. (2006), Produtividade, composição química e tempo de cozimento de cultivares de mandioca-de-mesa coletadas no Estado do Paraná.
Acta Sci. Agron., 1(28), 63-69.
Sagrilo, E.; Vidigal Filho, P. S.; Pequeno, M. G.; Gonçalves-Vidigal, M. C.; Scapim, C. A.; Kvitschal, M. V.; Maia, R. R.; Rimoldi, F. (2006), Effect of harvest period on foliage production and dry matter distribution in five cassava cultivars during the second plant cycle. Braz. Arch. Biol. Technol., 49(6), 1007-1018.
Siqueira, M. V. B. M.; Queiroz-Silva, J. R.; Bressan, E. A.; Borges, A.; Pereira, K. J. C.; Pinto, J. G.; Veasey, E. A. (2009), Genetic characterization of cassava (Manihot esculenta) landraces in Brazil assessed with simple sequence repeats. Genet. Mol. Biol., 32(1), 104-110.
Williams, J. G. K.; Kubelik, A. R.; Livak, K. J.; Rafalski, J. A.; Tingey, S. V. (1990), DNA polymorphism amplified by arbitrary primers are useful as genetic markers. Nucleic Acids Res., 18, 6532-6535.
Zacharias, A. M.; Botha, A. M.; Labuschagne, M. T.; Benesi, I. R. M. (2004), Characterization and genetic distance analysis of cassava (Manihot esculenta
Crantz) germplasm from Mozambique using RAPD fingerprint. Euphytica, 138, 49-53.
Zannou, A.; Agbicodo, E.; Zoundjihékpon J.; Struik, A.; Ahanchédé, A.; Kossou, D. K.; Sanni, A. (2009), Genetic variability in yam cultivars from the Guinea-Sudan zone of Benin assessed by random amplified polymorphic DNA. Afr. J. Biotechnol.,8(1), 26-36.