Taís Cristina Bastos Soares(1), Pedro Ivo Vieira Good‑God(2), Fábio Demolinari de Miranda(2), Yaska Janaína Bastos Soares(3), Ivan Schuster(4), Newton Deniz Piovesan(5), Everaldo Gonçalves de Barros(2) and Maurilio Alves Moreira(5)
(1)Universidade Federal do Espírito Santo, Departamento de Zootecnia, CEP 29500‑000 Alegre, ES, Brazil. E‑mail: tcbsoares@yahoo.com.br (2)Universidade Federal de Viçosa (UFV), Departamento de Biologia Geral, Instituto de Biotecnologia Aplicada à Agropecuária, CEP 36571‑000 Viçosa, MG, Brazil. E‑mail: pivggod@yahoo.com.br, fademolinari@yahoo.com.br, ebarros@ufv.br (3)Universidade Estadual do Norte Fluminense, Laboratório de Melhoramento Genético Vegetal, CEP 28013‑602 Campos dos Goytacazes, RJ, Brazil. E‑mail: yaskasoares@yahoo.com.br (4)Cooperativa Central de Pesquisa Agrícola, Caixa Postal 301, CEP 85813‑450 Cascavel, PR, Brazil. E‑mail: ivan@coodetec.com.br (5)UFV, Departamento de Bioquímica e Biologia Molecular, Instituto de Biotecnologia Aplicada à Agropecuária. E‑mail: piovesan@ufv.br, moreira@ufv.br
Abstract – The objectives of this study were to detect quantitative trait loci (QTL) for protein content in soybean grown in two distinct tropical environments and to build a genetic map for protein content. One hundred eighteen soybean recombinant inbred lines (RIL), obtained from a cross between cultivars BARC 8 and Garimpo, were used. The RIL were cultivated in two distinct Brazilian tropical environments: Cascavel county, in Paraná, and Viçosa county, in Minas Gerais (24º57'S, 53º27'W and 20º45'S, 42º52'W, respectively). Sixty-six SSR primer pairs and 65 RAPD primers were polymorphic and segregated at a 1:1 proportion. Thirty poorly saturated linkage groups were obtained, with 90 markers and 41 nonlinked markers. For the lines cultivated in Cascavel, three QTL were mapped in C2, E and N linkage groups, which explained 14.37, 10.31 and 7.34% of the phenotypic variation of protein content, respectively. For the lines cultivated in Viçosa, two QTL were mapped in linkage groups G and #1, which explained 9.51 and 7.34% of the phenotypic variation of protein content. Based on the mean of the two environments, two QTL were identified: one in the linkage group E (9.90%) and other in the group L (7.11%). In order for future studies to consistently detect QTL effects of different environments, genotypes with greater stability should be used.
Index terms: Glycine max, linkage map, molecular markers, recombinant inbred lines, quantitative trait loci.
Mapeamento de QTL quanto ao conteúdo de proteína
em soja cultivada em dois ambientes tropicais
Resumo – Os objetivos deste trabalho foram detectar QTL relativos ao conteúdo de proteína, em soja cultivada em dois ambientes tropicais divergentes, e construir um mapa genético para o conteúdo de proteína em genótipos adaptados a condições tropicais. Foram usadas 118 linhagens recombinantes endogâmicas de soja, obtidas do cruzamento entre as cultivares BARC 8 e Garimpo. A população de linhagens recombinantes endogâmicas foi cultivada em dois ambientes contrastantes: Cascavel, PR, e Viçosa, MG (24º57'S, 53º27'W; e 20º45'S, 42º52'W, respectivamente). Sessenta e seis pares de iniciadores SSR e 65 iniciadores RAPD apresentaram fragmentos polimórficos que segregaram à proporção de 1:1. Foram obtidos 30 grupos de ligação pouco saturados, com 90 marcadores, além de 41 marcas não ligadas. Para as famílias cultivadas em Cascavel, três QTL foram mapeados nos grupos de ligação C2, E, e N, que explicaram 14,37, 10,31 e 7,34% da variação fenotípica do conteúdo de proteína, respectivamente. Para as famílias cultivadas em Viçosa, dois QTL foram mapeados nos grupos de ligação G e #1, que explicaram 9,51 e 7,34% da variação fenotípica do conteúdo de proteína. Com base na média dos dois ambientes, dois QTL foram identificados: um no grupo de ligação E (9,90%) e outro no grupo L (7,11%).Genótipos com maior estabilidade devem ser uados em trabalhos futuros, para a detecção de QTL com efeitos consistentes, em diferentes ambientes.
Termos de indexação: Glycine max, mapa de ligação, marcador molecular, linhagem recombinante endogâmica, locos de características quantitativas.
Introduction
Most Brazilian soybean [Glycine max (L.) Merrill] cultivars present contents of 30 to 45% protein, 20 to 25% lipids, 28 to 35% carbohydrates and about 5% ash (Moreira et al., 1990). Theoretically, by combining
high nutritional value for human and animal consumption (Wilson, 2004). Soybean breeding programs have, therefore, emphasized the development of varieties with high protein content, given the economic importance of this trait (Carrão-Panizzi et al., 2008).
The soybean protein content results from the joint action of various genetic loci and their interactions with the environment, which makes complex the study and the genetic analysis for this characteristic (Sudarić et al., 2006). However, currently, it is possible to break down the genetic variation of quantitatively inherited traits into discrete loci (quantitative trait loci) and to identify those with greater effect. Based on genetic DNA markers, saturated genetic maps can be elaborated and used to detect and locate QTL related to agronomic, physiological and to seed composition characteristics, such as protein content (Boerma, 2000).
Genetic mapping and QTL detection are promising tools to optimize selection in genetic breeding programs, as it allows more accurate study of the genetics of quantitative traits. Selection accuracy can be increased by marker-assisted selection (MAS), especially for characteristics with low heritability or characteristics strongly influenced by the environment (Moreau et al., 2004). QTL detection is also associated to cloning studies and gene characterization, by fine mapping of genomic regions, and to the identifying of candidate genes, related to specific metabolic pathways.
Mapping and QTL detection studies for protein content in seeds have been reported extensively in literature (Chung et al., 2003; Fasoula et al., 2004; Hyten et al., 2004; Panthee et al., 2005). However, many reported QTL have still to be confirmed and their consistency validated (Fasoula et al., 2004). According to Panthee et al. (2005), the QTL reported with greatest consistency for protein content in soybean is located in the MLG I linkage group, close to the Satt292 microsatellite marker. The same study showed the difficulty for validating previously detected QTL, considering the need to carry out experiments in distinct environments, with different population structures and for different genetic backgrounds.
QTL mapping for protein content, involving Brazilian soybean germplasm, has not been reported yet. A study with this objective will allow assessment and comparison of QTL detection under tropical conditions, in addition to involving a different genetic background. Furthermore, efficient development of breeding procedures depends on the understanding of the type of genetic action and of
hereditability of the quantitative traits. The objective of the present study was to detect and map the QTL that control protein content in soybean, based on SSR and RAPD markers, and to start the construction of an intra‑specific genetic map for soybean, involving genotypes adapted to tropical conditions.
Materials and Methods
A population of 118 soybean recombinant inbred lines (RIL) was used, at the F6 generation, obtained by the SSD method, from a cross between 'BARC-8' and the Brazilian cultivar Garimpo. BARC-8 is a high protein content soybean cultivar (500 g kg-1) developed by USDA ARS, Beltsville, MD (Leffel, 1992). Cultivar Garimpo presents normal protein content (360 g kg-1) and was developed by Embrapa Soja, Brazil. The RIL were planted in a randomized blocksdesign with intercalated controls, in December 2001, in two locations in Brazil: Viçosa, MG (20º45'S, 42º52'W, altitude of 650 m, annual rainfall of 1,340 mm), and Cascavel, PR (24º57'S, 53º27'W, altitude of 780 m, annual rainfall of 1,971 mm). Each plot consisted of one 3-m row with 45 cm between rows. The controls used were the parental cultivars. They were intercalated at every 20 families. Seeds were harvested and stored for later analysis of protein content, which were determined by taking a sample of five plants per family. The modified Kjeldahl (Association, 1984) method was used.
The variance analysis for each location was based on the family design with intercalated controls ('BARC-8' and 'Garimpo') (Cruz, 2001). The joint analysis of variance, for the two locations, was carried out using two different models: the first for the controls and the second for the families. In the controls analysis, a factorial model was used to partition the variance among controls, environments and the interaction between controls and environment. The following model was adopted: Yijk = m + Ti +Ak +TiAk + eijk, in which: Yijk is the value of the characteristic for ith control, in the jth replication, in the kth environment; µ is the general mean of the controls; Ti is the effect of the ith control (I = 1,2,...,t); Ak is the effect of the kth environment (j = 1,2); TiAk is the effect as the interaction between the ith control and the kth environment; e
ijk is the random error in the controls, where eijk~NID (θ, σ2).
to one block. Similarly, the family vs. environment interaction was considered in the partition of the variance. The model is written, therefore, as follows: Zik = m +Fi + Ak + FiAk + ek, in which: Zik is the value of the characteristic for the ith family in the kth environment; µ is the general mean of the families; Fi is the effect of the ith family (I = 1,2,...,f); Ak is the effect of the jth environment (k = 1,2); F
iAk is the effect of the interaction between the ith family and the kth environment; e
ik is the random error in the families, where eik = eijk~NID (θ, σ2).
In order to extract the DNA, leaves from 5 plants from each family were collected, wrapped in aluminum foil, frozen in liquid nitrogen and stored at -80°C; DNA was extracted based on Doyle & Doyle (1990). The amplification reactions for the SSR primers were carried out in a total volume of 15 mL, containing 10 mM Tris-HCl, pH 8.3, 50 mM KCl, 2 mM MgCl2, 100 mM of each of dATP, dTTP, dGTP and dCTP deoxynucleotides, 0.6 mM of each primer (Research Genetics, Huntsville, AL, USA), 1 U Taq‑polimerase and 30 ng DNA. The amplifications were conducted in a thermocycler programmed as follows: 7 min at 94oC, 30 x (1 min at 94oC, 1 min at 50oC and 2 min at 72oC), and 7 min at 72oC. The amplified microsatellite fragments were analyzed by electrophoresis in 3% agarose gels, containing 6 µL ethidium bromide (10 mg mL-1) in TBE buffer (90 mM Tris-borate and 2 mM EDTA, pH 7), at 100 volts. The DNA samples were also amplified by the RAPD technique, according to Williams et al. (1990), using decamer primers (Operon Technologies, Alameda, CA, USA). After the run, gels were photographed under ultraviolet light by the Eagle Eye II (Stratagene) photodocumentation system. A total of 567 SSR primer-pairs and 1,200 RAPD primers were tested.
The GQMOL program (Cruz & Schuster, 2004) was used to obtain the linkage map, using the Kosambi map function; the presence of QTL and their effects were identified by multiple regression analysis or composite interval mapping (Zeng, 1993). The markers were grouped using LOD>3 and maximum recombination frequency<0.30. For those markers, which were known to be linked in the consensus map (Song et al., 2004) but were unlinked in the analysis made with LOD>3, a new grouping was performed with LOD>2. The markers order in the linkage group was obtained by RCD algorithm (rapid chain delineation) (Doerge, 1996). For the composite interval analysis (Jansen et al., 1993; Zeng
et al., 1993, 1994), only markers that presented P(β)<0.20 were considered, in order to avoid drastic reduction in the population size due to missing data.
Results and Discussion
Protein content in the 118 RIL families was continuously distributed approximating the normal distribution in the two environments tested ( Figure 1). This result confirms the pattern of polygenic inheritance for protein content control in soybean. The average protein contents of cultivars BARC-8 and Garimpo varied according to the environment. The average protein contents of 'BARC-8' were 51.77 and 54.10%, in Viçosa and in Cascavel, respectively. 'Garimpo' presented an average protein content of 35.58% (Viçosa) and 43.18% (Cascavel).
The RIL families and the parents presented significant genetic variability for protein content and significant
Viçosa
Protein content (%) 0
5 10 15 20 25 30 35
32 34 36 38 40 42 44 46 48 50
Cascavel
Protein content (%) 0
5 10 15 20 25 30 35 40
40 42 44 46 48 50 52 54 56
Number
of
observation
s
Number
of
observations
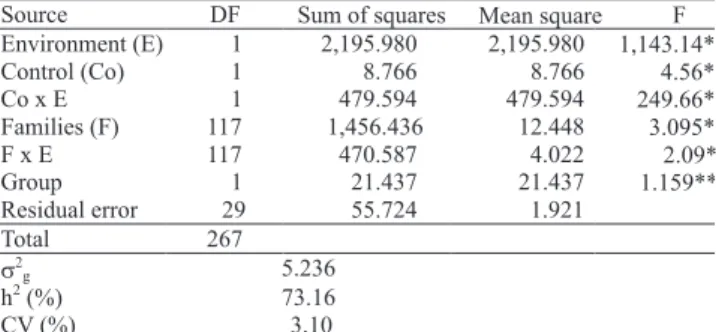
genotype vs. environment interaction (Tables 1 and 2). Protein content heritability, obtained by components of variance, was high in the two locations (Viçosa: 73.47%; Cascavel: 82.11%) and in the joint analysis (73,16%), indicating that most of the variation observed was due to genetic causes. The joint analysis for the two environments indicated also the significant genotype vs. environment interaction for families and controls, showing that environmental factors have considerable influence on the regulation of genes related to protein accumulation in soybean (Table 2). Vieira et al. (2006), studied the same population used in the present work, in generations F7 and F8, cultivated in a greenhouse, and obtained a high heritability value for protein content (99.86%). Piovesan (2000) also obtained high heritability values for protein content, in a diallel with contrasting parents for this trait. These results indicate good possibility for QTL detection, for both environments. Carrão-Panizzi et al. (2008) observed a significant environmental effect in protein fraction contents of 90 Brazilian soybean cultivars.
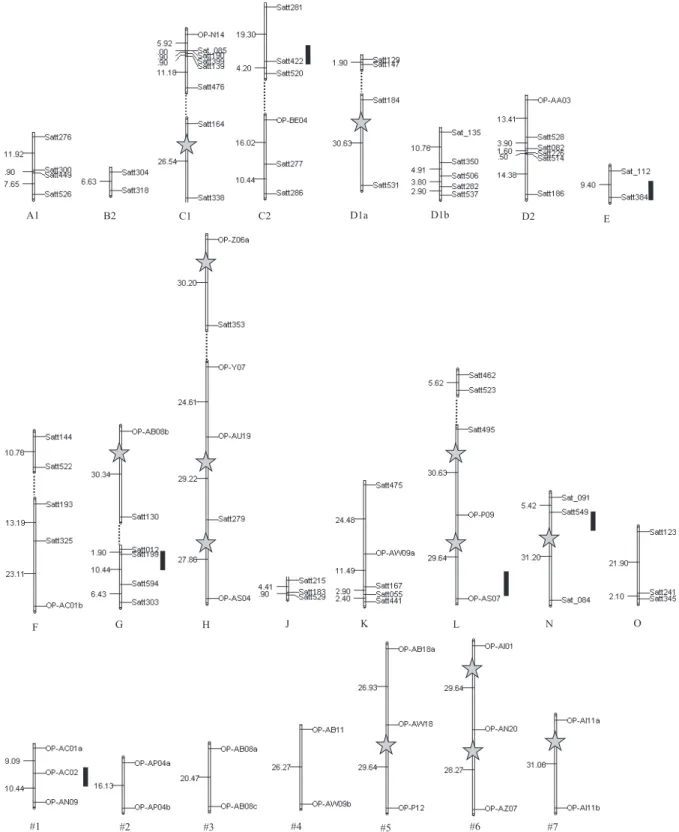
Only 66 (11.64%) of the 567 SSR primer-pairs tested showed polymorphism in the RIL population, segregated according to a 1:1 ratio, and presented good amplification quality. In addition, 127 (10.6%) of the RAPD primers tested showed polymorphism between the parents, of which only 65 (5.41%) presented consistent polymorphism in the RIL population, segregating at 1:1 ratio. Ninety markers were found to be linked, and thirty linkage groups were obtained (Figure 2) in addition to 41 nonlinked markers. The linkage groups obtained were compared with the soybean consensus map (Song et al., 2004). Of these groups, 23 were allocated in 16 linkage groups (A1, B2, C1, C2, D1a, D1b, D2, E, F, G, H, J, K, N and O) of the soybean consensus map. The remaining seven groups were formed only by RAPD markers and, thus, could not be aligned to the consensus map; they were named #1 to #7.
A partial linkage map was built based on SSR and RAPD markers, covering about 829.7 cM of the soybean genome. Although the soybean genome presents about 2,523.6 cM (Song et al., 2004), the partial map obtained in the present study sets the basis for the development of a genetic map for tropical soybean genotypes.
In the QTL analysis by multiple regression, 12 markers where identified with significant effect on the expression of protein content in the RIL populations. Seven markers had significant effect on the variation of the protein content of plants grown in Cascavel (Table 3). The accumulated adjusted R2 of these markers explained 34.19% of the variation in the protein content, in this environment. Two markers (OP-AU04 and Satt549) concentrated about 20.73% of the variation in protein content. The others presented a mean individual effect of 3.62% of the variation observed. Of the seven markers identified, two (OP‑AU04 and OP‑BE13) were not allocated in specific linkage groups, in the map obtained in the present study. The others were located in linkage groups N, G, C2, I and #1 (Table 3). Five markers were identified in Viçosa environment, with significant association that explained 48.79% of the variation in protein content (Table 3). On average, these markers explained individually 11.11% of the variation observed. Of the five markers identified in this environment, only OP-AO06 was not placed in a specific linkage group. The other markers were mapped in linkage groups A1, C2, H and #1 (Table 3). The multiple regression analysis, using the protein content mean of each RIL, in the two locations, identified 10 markers associated with variation in protein content, located in six different linkage groups (A1, C1, C2, K, #1 and #3) (Table 3). Together, these markers explained 41.72% of the variation in the mean protein content. Although this method cannot determine the exact position of the
Table 1. Analysis of variance related to the experiments in Viçosa and Cascavel, and estimates of the genetic variance (σ2g), heritability (h2) and the coefficient of variation (CV).
Source Viçosa Cascavel
DF Mean square DF Mean square
Families 117 9.110** 117 7.360**
Controls 1 1,079.238** 1 444.398**
Residual error 15 2.417 13 1.497
2
g 6.693 6.043
h
2
(%) 73.47 82.11
CV (%) 3.28 2.93
**Significant at 1% probability.
Table 2. Joint analysis of the experiments in Viçosa and Cascavel, and estimates of the genetic variance (σ2g), heritability (h2) and the coefficient of variation (CV).
Source DF Sum of squares Mean square F Environment (E) 1 2,195.980 2,195.980 1,143.14**
Control (Co) 1 8.766 8.766 4.56*
Co x E 1 479.594 479.594 249.66**
Families (F) 117 1,456.436 12.448 3.095**
F x E 117 470.587 4.022 2.09*
Group 1 21.437 21.437 1.159**
Residual error 29 55.724 1.921
Total 267 2 g 5.236 h 2 (%) 73.16
CV (%) 3.10
A1 B2 C1 C2 D1a D1b D2
E
F G H J K L N O
#1 #2 #3 #4 #5 #6 #7
QTL, it can estimate its effect for linked and nonlinked markers, while through composite interval mapping only QTL in linkage groups can be detected. Single marker mapping and multiple regression analysis are important tools for preliminary studies to detect candidate QTL (Doerge, 2002). With the availability of high definition genetic maps, specific genome regions can be delimited and markers can be tested in different genetic backgrounds, speeding up QTL detection.
Three QTL were identified by the composite interval mapping analysis for protein content, for Cascavel environment, and two QTL for Viçosa environment.
In Cascavel environment, QTL were identified in C2 (Satt422–Satt281), E (Satt384–Sat_112) and N (Satt549–Satt084) linkage groups. These QTL explained 14.37, 10.31 and 7.34% of the variation in the protein content in this environment, respectively, presenting an accumulated R2 of 32.02%. The three QTL identified presented additive positive effect, indicating that the alleles from 'BARC-8' confer increased protein content (Table 4). In Viçosa, two QTL were identified in G (Satt199–Satt594) and #1 (OP-AN09–OP-AC02) linkage groups, explaining 9.51 and 7.34% of the variation in the protein content,
Table 3. Multiple regression analysis among the molecular markers and the protein contents of the families cultivated in Viçosa, MG, and Cascavel, PR.
Environment Markers Linkage group
(1)
Multiple regression R
2(2)
(%) F P>F (%)
OP-AU04 Nonlinked 12.61 14.14 0.03
Satt549 N 20.73 12.68 0.22
OP-BE13 Nonlinked 24.37 10.30 3.41
Satt594 G 27.89 9.18 3.37
OP-AC02 #1 30.93 8.41 4.49
Sat_105 I 34.23 8.07 3.32
Viçosa
Satt520 C2 38.84 8.35 0.99
OP-AO06 Nonlinked 14.37 6.21 1.73
OP-AN09 #1 24.68 5.90 3.28
OP-Y07 H 37.95 7.14 0.97
Satt454 A1 47.73 7.76 1.65
Cascavel
Satt281 C2 55.53 8.24 2.19
Satt476 C1 10.27 28.96 0.00
Satt471 A1 17.34 22.58 0.00
Satt286 C2 22.73 7.82 0.61
OP-AB08a #3 27.38 7.14 0.76
Satt518 K 31.43 12.35 0.06
OP-BE04 C2 36.27 10.45 0.16
OP-AN09 #1 39.46 5.89 1.69
Satt164 C1 41.77 7.09 0.89
OP-AX12 Nonlinked 44.51 5.39 2.21
Viçosa and Cascavel
OP-AA15 Nonlinked 46.70 4.39 3.88
(1)According to Song et al. (2004) and Figure 2. (2)Accumulated values; R2
adjusted Viçosa = 34.19%; R2adjusted Cascavel = 48.79%; R2adjusted Viçosa and Cascavel = 41.72%.
QTL Linkage
group
Position (cM)(1)
Markers flanking(2)
Likelihood ratio (LR)
LR critical value(3)
R2 (%)
Additive effect Cascavel
QTL1 C2 7.3 Satt422–Satt281 15.44 6.12 14.37 1.10
QTL2 E 2.4 Satt384–Sat_112 9.54 7.25 10.31 0.79
QTL3 N 6.0 Satt549–Satt084 7.53 6.31 7.34 0.81
Viçosa
QTL4 G 1.4 Satt199–Satt594 9.56 8.13 9.51 -0.95
QTL5 #1 10.0 OP-AN09–OP-AC02 7.76 6.08 7.34 -0.82
Mean of environments: Cascavel and Viçosa
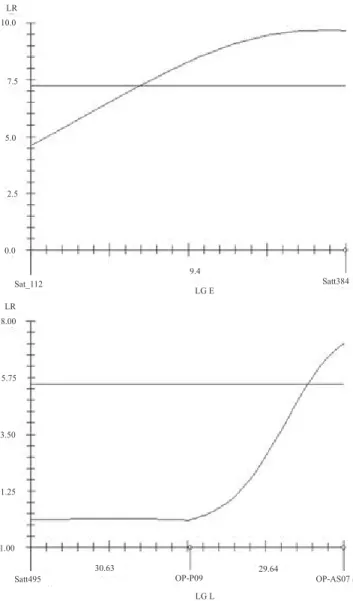
QTL 2 E 9.0 Satt384–Sat_112 9.68 7.25 9.90 1.19
QTL 6 L 0.0 OP-AS07–OP-P09 7.11 5.5 7.11 0.90
Table 4. QTL for protein content in soybean, detected by composite interval mapping, from assessment of RIL in Viçosa, MG, and Cascavel, PR.
(1)Position in relation to the closer marker flanking. (2)The suitable marker to the left of the interval is the reference marker for the column position. (3)
respectively, presenting an accumulated R2 of 16.85%. These QTL had negative additive effect, indicating that the presence of alleles from 'BARC-8' conferred reduction in the protein content in these loci (Table 4). Considering the mean of the two locations, two QTL where identified in E and L linkage groups (Figure 3), which explained, respectively, 9.90 and 7.11% of the variation in the protein content (Table 4). Single marker analysis and composite interval mapping analysis showed that the QTL close to marker Satt549
(LG N) was consistent for the Cascavel environment (Table 3).
Consistent QTL, close to marker OP-AN09 (LG #1), was observed in Viçosa environment, also by the two types of analysis. Linked OP-AC02 and OP-AN09 (LG #1) markers were detected simultaneously by single marker analysis in Cascavel and Viçosa environments. However, just QTL present in Viçosa was confirmed by composite interval mapping (Tables 3 and 4). The marker Satt281 was identified by single marker analysis in Viçosa environment, but was detected by composite interval mapping in Cascavel environment (Tables 3 and 4). According to the Soybase (2008), 76 QTL have been identified and reported as related to protein content. However, little consistency has been observed for QTL expressed in different environments or different populations (Brummer et al., 1997; Fasoula et al., 2004; Panthee et al., 2005). In the present study, this fact might be explained by the high genotype vs. environment interaction observed and by the fact that these QTL can be considered environmentally sensitive (Brummer et al., 1997). Although research on QTL tends to emphasize their validation in different environments and populations, in a real selection scheme, for many times, there are genes of interest which are specific to a certain environment. In this case, environment sensitive QTL can be useful in specific locations for marker-assisted selection.
The QTL located in linkage group E had also been identified for protein content in Cascavel environment. In fact, it seems to be the same QTL, because the confidence intervals for the positioning of the QTL are the same for Cascavel environment and mean analyses. Considering the confidence interval of two LR units (Schuster & Cruz, 2004), the confidence interval for the localization of the QTL in linkage group E extends from the position of marker Satt384 to 6.4 cM of it, for the data from Cascavel, and from the position of Satt384 marker to 6.9 cM of it, for the mean data of the two locations (Figure 3). The QTL detected in linkage group L, close to marker OP‑AS07, was not identified in neither locations, in the individual analyses. The QTL in E and L linkage groups can, therefore, be considered a candidate stable QTL, although more studies should be conducted to validate them. Stable QTL are considered of great use for breeding programs and for use in MAS. These QTL may be associated with genes that will lead to general adaptability or stability of genotypes under
Satt495
30.63
OP-P09
LGL
29.64
OP-AS07 -1.00
1.25 3.50 5.75 8.00 LR LR
10.0
7.5
5.0
2.5
0.0
Sat_112
9.4
LGE
Satt384
selection. Recognizing QTL in the early breeding generations, in the same genetic background, means that MAS could be used, even under limited conditions, that is, in the same population. Since the control of complex characteristics is conditioned by several genes, which can be regulated differently in distinct environments, it is expected that different QTL will be identified. Similarly, distinct genetic backgrounds can condition the identification of different QTL. Further studies should be carried out to increase the coverage and saturation of the map and to validate QTL for protein content in tropical environments.
Conclusions
1. Genotypes with greater stability must be used to consistently detect QTL effects for different environments.
2. The QTL in E and L linkage groups are probably stable QTL, although more studies should be conducted to validate them.
Acknowledgements
To Coordenação de Aperfeiçoamento de Pessoal de Nível Superior, to Conselho Nacional de Desenvolvimento Científico e Tecnológico, and to Fundação de Amparo à Pesquisa do Estado de Minas Gerais, for financial support.
References
ASSOCIATION OF OFFICIAL ANALYTICAL CHEMISTS. Official methods of analysis. 14.ed. Washington, 1984. 1141p. BOERMA, H.R. DNA markers: are they worth cost? Proceedings of the American Seed Trade Association, Soybean Seed Research Conference Chicago, IL. Dec 1999. ASTA, Washington, DC. 2000.
BRUMMER, E.C.; GRAEF, G.L.; ORF, J.; WILCOX, J.R.; SHOEMAKER, R.C. Mapping QTL for seed protein and oil content in eight soybean populations. Crop Science, v.37, p.370-378, 1997.
CARRÃO-PANIZZI, M.C.; KWANYUEN, P.; ERHAN. S.Z.; LOPES, I.O.N. Genetic variation and environmental effects on beta-conglycinin and glycinin content in Brazilian soybean cultivars. Pesquisa Agropecuária Brasileira, v.43, p.1105-1114, 2008.
CHUNG, J.; BABKA, H.L.; GRAEF, G.L.; STASWICK, P.E.; LEE, D.J.; CREGAN, P.B.; SHOEMAKER, R.C.; SPECHT, J.E. The seed protein, oil, and yield QTL on soybean linkage group I.
Crop Science, v.43, p.1053-1067, 2003.
CRUZ, C.D. Programa genes: aplicativo computacional em genética e estatística. Viçosa: UFV, 2001. 648p.
CRUZ, C.D.; SCHUSTER, I. GQMOL: aplicativo computacional para análise de dados moleculares e de suas associações com caracteres quantitativos. Versão 2.1. Viçosa: UFV, 2004. Available at: <www.ufv.br/dbg/gqmol/gqmol.htm>. Accessed on: June 18, 2008.
DOERGE, R.W. Constructing genetic maps by rapid chain delineation. Journal of Quantitative Trait Loci, v.2, p.121-132, 1996.
DOERGE, R.W. Mapping and analysis of quantitative trait loci in experimental populations. Nature Reviews Genetics, v.3, p.43-52, 2002.
DOYLE, J.J.; DOYLE, J.L. Isolation of plant DNA from fresh tissue. Focus, v.12, p.13-15, 1990.
FASOULA, V.A.; HARRIS, D.K.; BOERMA, H.R. Validation and designation of quantitative trait loci for seed protein, seed oil, and seed weight from two soybean populations. Crop Science, v.44, p.1218-1225, 2004.
HYTEN, D.L.; PANTALONE, V.R.; SAMS, C.E.; SAXTON, A.M.; LANDAU-ELLIS, D.; STEFANIAK, T.R.; SCHMIDT, M.E. Seed quality QTL in a prominent soybean population. Theoretical and Applied Genetics, v.109, p.552-561, 2004.
JANSEN, R.C. Maximum likelihood in a generalized linear finite
mixture model by using the EM algorithm. Biometrics, v.49, p.227-231, 1993.
LEFFEL, R.C. Registration of high-protein soybean germplasm lines BARC-6, BARC-7, BARC-8 and BARC-9. Crop Science, v.32, p.502, 1992.
MOREAU, L.; LEMARIÉ, S.; CHARCOSSET, A.; GALLAIS,
A. Economic efficiency of one cycle of marker‑assisted selection. Crop Science, v.40, p.329-337, 2000.
MOREIRA, M.A. Programa de melhoramento genético da qualidade de óleo e proteína da soja desenvolvido na UFV. In: CONGRESSO BRASILEIRO DE SOJA, 1., 1990, Londrina.
Anais. Londrina: Embrapa Soja, 1990. p.99-104.
PANTHEE, D.R.; PANTALONE, V.R.; WEST, D.R.; SAXTON, A.M.; SAMS, C.E. Quantitative trait loci for seed protein and oil concentration, and seed size in soybean. Crop Science, v.45, p.2015-2022, 2005.
PIOVESAN, N.D. Aplicação de cruzamentos dialélicos no melhoramento genético do teor protéico em soja. 2000. 91p. Dissertation (M.Sc.) - Universidade Federal de Viçosa, Viçosa. SCHUSTER, I.; CRUZ, C.D. Estatística genômica aplicada a populações derivadas de cruzamentos controlados. Viçosa: UFV, 2004. 568p.
SONG, Q.J.; MAREK, L.F.; SHOEMAKER, R.C.; LARK K.G.; CONCIBIDO, V.C.; DELANNAY, X.; SPECHT, J.E.; CREGAN, P.B. A new integrated genetic linkage map of the soybean. Theoretical and Applied Genetics, v.109, p.122-128, 2004.
SUDARIĆ, A.; ŠIMIĆ, D.; VRATARIĆ, M. Characterization of
genotype by environment interactions in soybean breeding programmes of Southeast Europe. Plant Breeding, v.125, p.191-194, 2006. VIEIRA, A.J.D.; OLIVEIRA, D.A. de; SOARES, T.C.B.; SCHUSTER, I.; PIOVESAN, N.D.; MARTÍNEZ, C.A.; BARROS, E.G. de; MOREIRA, M.A. Use of the QTL approach to the study of soybean trait relationships in two populations of recombinant inbred lines at the F7 and F8 generations. Brazilian Journal of Plant Physiology, v.18, p.281-290, 2006.
WILLIAMS, J.G.; KUBELIK, A.R.; LIVAK, K.J.; RAFALSAKI,
J.A.; TINGEY, S.V. DNA polymorphisms amplified by arbitrary
primers are useful as genetic markers. Nucleic Acids Research, v.13, p.6531-6535, 1990.
WILSON, R.F. Seed composition. In: BOERMA, H.R.; SPECHT, J.E. (Ed.). Soybeans: improvement, production, and uses. 3rd ed. Madison: ASA, CSSA, SSSA, 2004. p.621-677.
ZENG Z.B. Precision mapping of quantitative trait loci. Genetics, v.136, p.1457-1468, 1994.
ZENG, Z.B. Theoretical basis of separation of multiple linked gene effects on mapping quantitative trait loci. Proceedings of the National
Academy of Sciences of the USA, v.90, p.10972-10976, 1993.