Article
, Vol. 29, No. 9, 1944-1950, 2018Printed in Brazil - ©2018 Sociedade Brasileira de Química
*e-mail: [email protected]; [email protected]
A Validated NMR Approach for MDMA Quantification in Ecstasy Tablets
NathaliaS.Almeida,aLuizE.C.Benedito,aAdrianoO.Maldaner*,band AlineL.deOliveira*,a
aInstituto de Química, Universidade de Brasília, 70910-000 Brasília-DF, Brazil
bInstituto Nacional de Criminalística, Polícia Federal, SAIS Quadra 07 Lote 23,
70610-200 Brasília-DF, Brazil
In recent years, ecstasy trafficking has grown in complexity and tablets has been commonly sold containing different contents of 3,4-methylenedioxymethamphetamine (MDMA) or even other psychoactive substances. In contrast, identification and quantification of drugs of abuse is still a challenge, once the access to drug standards is very restricted in Brazil. In this work, ecstasy tablets seized by the Brazilian Federal Police have their chemical composition identified and quantified by gas chromatography and quantitative 1H nuclear magnetic resonance based on an internal
standard approach (IS-1H-qNMR). Both methods were validated and showed suitable results for
the figures of merit. IS-1H-qNMR shows excellent results of accuracy (relative error < 5%) and
precision (relative standard deviation (RSD) < 2%). Comparatively, IS-1H-qNMR is more efficient
and versatile than gas chromatography to accomplish in a single analysis the identification and quantification of target analytes. Since the method does not require a specific reference material, it is cost effective and provides agility to routine forensic analysis.
Keywords: ecstasy, MDMA, qNMR, forensic analysis, validation
Introduction
The term “ecstasy” is typically used to describe tablets containing 3,4-methylenedioxymethamphetamine (MDMA), or its hydrochloride salt (MDMA.HCl), which vary in shapes, dimensions, colors, and logos. In recent years, the ecstasy trafficking has grown in complexity and diversification. The addition of other amphetamine type substances (ATS) became a common practice and substances such as 3,4-methylenedioxyethylamphetamine (MDEA), 3,4-methylenedioxyamphetamine (MDA), and other chemicals classes, such as piperazines or cathinones, are occasionally detected. Moreover, tablets are commonly sold containing little or no MDMA, or with an extremely
high content of MDMA.1
A study on the composition of ecstasy tablets in Brazil, carried out on samples from 150 different seizures (from August 2011 to July 2012) showed a strong tendency in tablet adulteration. An unexpected result was the presence
of methamphetamine in 22% of the tablets analyzed.2
Despite seizures of ATS are generally less frequent in Latin America than in other global markets, considerable
amounts were seized in Brazil in 2014 (238 kg) and 2015 (153 kg).1
This scenario is associated with the unregulated and illegal activity,3-6 and in-depth characterization of ecstasy
tablets can provide important information for intelligence services as well as public health agencies. The chemical profiling analysis allows, for example, the comparison of samples similarity, indication of geographic origin, definition of distribution networks, evaluation of synthetic routes, and other valuable information to law enforcement agencies.
The most widely used technique for MDMA quantification in ecstasy tablets is the gas chromatography (GC), which can be coupled with various detectors, such as mass spectrometry (MS), flame ionization detector (FID) or nitrogen phosphorus detector (NPD). On the other hand, the determination of ecstasy purity can also be conducted by methods that do not involve a separation step, such as near infrared spectroscopy (NIR) and quantitative nuclear magnetic resonance of hydrogen (1H-qNMR).7-9
Actually, the 1H-qNMR spectroscopy could be more
containing the target analyte, which is, in the case of illicit drugs in developing countries, not always readily available, extremely expensive and difficult to obtain. Besides that, NMR can simultaneously perform the identification and quantification of other substances also present in ecstasy tablets, like adulterants, that is still a challenge in forensic drug analysis.7,10,11
Herein, we develop and validate an 1H-qNMR
analytical method, based on an internal standard approach
(IS-1H-qNMR), for quantification of MDMA in ecstasy
tablets. The IS-1H-qNMR method is simple, accurate and
fast, and does not demand any previous separation step. Once the GC-FID is a reference method routinely used in forensic laboratories, it was used to evaluate the NMR-based method. Finally, the validated method was applied to a set of ecstasy tablets seized by Brazilian Federal Police.
Experimental
Chemical and reagents
All chemicals were of analytical grade or better and used without additional purification procedures. Dipentylphthalate (97.0%) was obtained from Acros Organics (Brazil). Maleic acid (MA, 99.99%) and dimethyl sulfone (DMS, 99.73%) certified standards, diethylamine, chloroform and deuterium oxide (D2O) were obtained from
Sigma-Aldrich (Brazil). The MDMA.HCl certified standard (99.6%) was obtained from National Measurement Institute (Australia). A total of 38 different ecstasy tablets were
analyzed by GC-FID and 1H-qNMR. The seized tablets
were obtained from the National Institute of Criminalistics of the Brazilian Federal Police. Before analysis, tablets were manually crushed in mortar into fine powders.
GC-FID experiments
Quantitative analyses were a routine practice in the Brazilian Federal Police laboratory to study the cocaine profile12 and a similar GC-FID MDMA.HCl quantification
protocol was firstly validated to be used as a reference method to IS-1H-qNMR analysis.
Approximately 10 ± 0.01 mg of sample or MDMA.HCl reference material were weighted in an XP205 Mettler Toledo scale, mixed with 10.0 mL of dispensed internal standard solution (dipentylphthalate at 0.490 mg mL-1 in
CHCl3 / 0.2% diethylamine) and carefully stirred until
dissolution. Freshly prepared solutions were transferred to 2 mL glass vials and sealed for further gas chromatography injection. Homogenized seized samples were used to evaluate some of the figures of merit in validation stages
(e.g. precision and stability), due to the low availability of
MDMA.HCl standards.11
The GC was performed with an Agilent Technologies® 6890N gas chromatograph equipped with flame ionization detector and 25 m × 0.2 mm × 0.33 µm RXI-1MS or DB-1MS Agilent Technologies® columns. Injector was operated in the split mode (50:1) at 280 °C and injection volume of 1 µL. Helium was used as the carrier gas at constant flow rate of 1.0 mL min-1. The oven temperature
was programmed as follow: 150 °C (2 min), followed by a heating ramp of 30 °C min-1 up to 315 °C (hold for
4.5 min). The total analysis time was 12 min. The FID was maintained at 320 °C, with hydrogen flow rate of 35.0 mL min-1, air flow rate of 350.0 mL min-1 and nitrogen
flow rate of 35.0 mL min-1.
For GC-FID validation, the following figures of merit were assessed: linearity, selectivity, precision, accuracy, robustness (Youden’s test), stability, limits of detection (LOD) and quantification (LOQ) and uncertainty estimation. The Grubbs test was applied for outliers identification.13,14 GC-FID was used to identify other active
ingredients, like adulterants, on seized ecstasy tablets.
NMR spectroscopy experiments
For IS-1H-qNMR, MA and DMS certified standards
were used to evaluate the figures of merit, in which MA was assigned as internal standard and DMS as the analyte to be quantified. To assure that the IS-1H-qNMR method
could be applied to MDMA quantification, MDMA.HCl certified reference material was also used to verify some figures of merit.
Approximately 20 ± 0.01 mg of sample and 11 ± 0.01 mg of MA were weighted in the same Eppendorf tube. The powders were mixed in 1.2 mL of D2O, stirred 1 min in a
vortex and centrifuged 5 min at 2,000 rpm to separate any insoluble material. About 1 mL of the clear upper solution was carefully transferred with a pipette to the NMR tubes.
The IS-1H-qNMR measurements were carried out
on a Bruker Avance III HD 600 instrument (operating at 600.13 MHz) equipped with 5 mm broadband observe probe (BBFO). Lock and shimming adjustments were done automatically for all samples. Tuning and matching adjustment were done manually. The 90° pulse value was automatically calculated using the pulsecal command. To avoid sidebands and minimize eventual signal overlapping
all 1H spectra were acquired without sample spinning
and with 13C decoupling during acquisition (zgig30 pulse
sequence). The following parameters were optimized for
IS-1H-qNMR: 30° pulse angle, pre-acquisition delay of
time of 2.7 s at a sweep width of 20 ppm), irradiation frequency offset (o1p) of 6.17 ppm, relaxation delay of 25 s and a total of 16 scans and 4 dummy scans. To ensure complete relaxation, all acquisitions were made with a relaxation delay of at least 10 times the largest T1
(spin-lattice relaxation time) value. For determination of the relaxation delay value, T1 measures of all analytes were
previously performed by inversion-recovery experiments. T1 constants ranged from typical 2 s values for MDMA to
approximately 6 s for DMS and MA molecules. The sample temperature in the probe was maintained at 28 °C.
Fourier transformation (FT) was applied after zero filling the data to 64 k time domain points. The acquired NMR spectra were manually phase-corrected and baseline was automatically set with fifth order polynomial function. The spectra were referenced by TSP-d4 (sodium-2,2,3,3-d4
-3-trimethylsilylpropionate) signal (0 ppm) and integrations were manually made using Bruker Topspin 3.2 software. For quantification, a well-known equation was applied, which includes the molar weight, integral area, number of protons of the reference compound and analyte, as well as purity and gravimetric mass of the reference.6,9
For validation, the following figures of merit were evaluated: linearity, selectivity, precision, accuracy, robustness (Youden’s test), stability, limits of detection and quantification, and uncertainty estimation. Grubbs test was applied for outliers identification13,14 and results of samples analyzed by both
GC-FID and IS-1H-qNMR were evaluated by paired t-test.
Infrared spectroscopy (FTIR/ATR (attenuated total reflectance), Nicolet iS10 model, equipped with a SMART iTR accessory) was used to identify the main ecstasy tablets cutting agents. The active ingredients were selectively extracted with methanol and the insoluble material was dried and analyzed by FTIR/ATR.
Results and Discussion
Validation of MDMA quantitative analysis by GC-FID
An analytical curve was plotted for MDMA.HCl
concentrations ranging from 0.02 to 0.90 mg mL-1. As
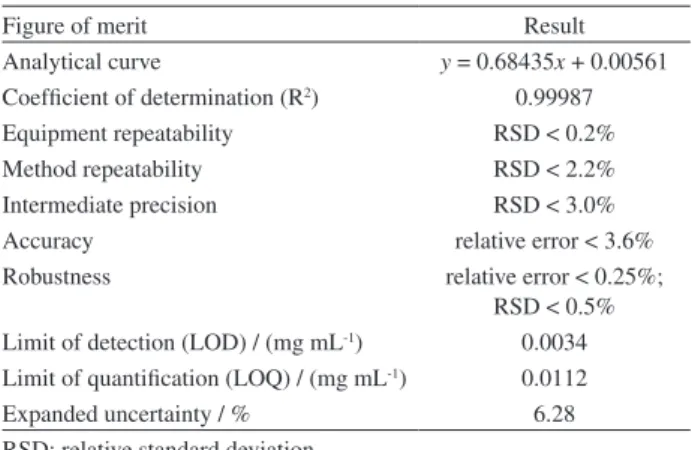
shown in Table 1, GC-FID method demonstrates excellent results for all assessed analytical parameters. The analytical curve presents low residues (< 0.01) and a relative standard deviation (RSD) smaller than 2.0% at all measured points. The method was considered linear over the entire studied concentration range. The method is also precise in terms of repeatability (same analyst, same day, six replicates at three levels of MDMA concentration) and intermediate precision (same analyst and equipment in different days; same equipment in the same day by different analysts; same
analyst in the same day and in different equipment). The GC-FID method was also accurate in high (80%), medium (40%) and low (20%) levels of MDMA.HCl purity with certified standard mixtures with cellulose and robust for all variables evaluated (flow rate, injector temperature, oven temperature, split ratio, injection volume). The limits of detection and quantification and the combined standard uncertainty are adequate for the proposed application.
The potential interference of some traditional ATS (MDEA, MDA and amphetamine) and pharmaceutical adulterants (paracetamol, caffeine, mephedrone, benzocaine, phenacetin, lidocaine, aminopyrine, levamisole and procaine) present in ecstasy tablets was also evaluated. The chromatograms analyses (Figure S1 in the Supplementary Information (SI) section) show that the GC-FID method is selective for MDMA, since no interferents are present in its individual elution zone.
The stability was also assessed for solutions stored 2 months in freezer (–15 °C) and 13 days at room temperature. Relative errors are smaller than ± 5.0% during those periods.
Once validated, the GC-FID method was applied to the United Nations Office on Drugs and Crime (UNODC) proficiency test.15 The quantitative result of an
MDMA-containing sample analyzed by our method was amongst the 10 most accurate results of 98 attendees’ laboratories from different countries, confirming the efficiency of our method. Currently, this method is part of the quality assurance system of Brazilian Federal Police laboratory and has been used routinely.
Validation of IS-1H-qNMR method
Initially, MA and DMS solutions were used as reference to evaluate the figures of merit of a general method for
Table1. GC-FID validation results
Figure of merit Result
Analytical curve y = 0.68435x + 0.00561 Coefficient of determination (R2) 0.99987
Equipment repeatability RSD < 0.2%
Method repeatability RSD < 2.2%
Intermediate precision RSD < 3.0%
Accuracy relative error < 3.6%
Robustness relative error < 0.25%;
RSD < 0.5% Limit of detection (LOD) / (mg mL-1) 0.0034
Limit of quantification (LOQ) / (mg mL-1) 0.0112
Expanded uncertainty / % 6.28
quantitative analysis by 1H-qNMR using internal standard.
Once satisfactory results were achieved, the particularities
for quantification of MDMA.HCl by IS-1H-qNMR were
addressed.
In order to assess the linearity of IS-1H-qNMR method,
a curve ranging from 5 to 95% of MA/(DMS + MA) molar ratio was constructed. For this purpose, the integral values of MA (6.4 ppm, singlet) were used to quantify DMS (3.1 ppm, singlet). The linear regression and the coefficient of determination (R2 = 1.00000) shows a clear
linear relationship between the molar ratio of expected values (gravimetric) and the experimental values (NMR integral) on the analyzed range. The residues obtained are small (less than 0.3%) and homoscedastic, with suitable distribution along the curve, and thus confirm the linearity of the method.
The IS-1H-qNMR method shows good precision
results in all three tests (equipment repeatability, method repeatability and intermediate precision). The equipment repeatability, analyzed at 61% MA/(DMS + MA) molar ratio, showed an RSD of 0.08%. The RSD values obtained for method repeatability and intermediate precision are lower than 2% for the three levels of molar ratio evaluated (low (10%), medium (60%) and high (80%)). Good results are also observed in the accuracy assessment, once the relative errors obtained for the three levels of molar ratio evaluated are lower than 4%.
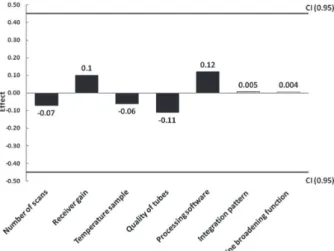
Number of scans, receiver gain, sample temperature, quality of NMR tubes (Selection or Economy Wilmad®), processing software (ACD/Spectrus Processor or Bruker Topspin 3.2), integration criterion (automatic or manual integration) and line broadening function were the parameters selected to assess the method robustness. After analysis of 16 samples, the effect of each parameter was calculated using the Youden’s test. Results presented in Figure 1 show that all analyzed parameters have effects’ values within the confidence interval (CI). Therefore, they do not affect the results of quantification by IS-1H-qNMR
and the method is considered robust in regard to acquisition and processing of the parameters investigated.
The LOD and LOQ were calculated by curve extrapolation and are 0.12 and 0.41% of molar ratio of DMS, respectively, which means that the minimum quantified amount of DMS is 0.03 mg, considering a weighing of 10.00 mg of MA.
Solutions containing MA and DMS are stable for at least 20 days at room temperature, since subsequent analyses show relative errors below 0.5% for low, medium and high levels of molar ratio evaluated.
The combined standard uncertainty calculation takes into account contributions from all important uncertainty
sources, like gravimetric mass and molecular weight of MA and DMS, purity of MA, integral ratio of MA and DMS and recovery. The combined standard uncertainty was 0.27% and the calculated contribution of each component shows that recovery is the main factor for whole method uncertainty (85.66%). This result is expected once recovery is actually a combination of various factors, such as sample preparation and purity of internal standard and analyte. The expanded uncertainty is obtained by each sample’s purity, in percentage, multiplied by the combined standard uncertainty value (0.54%) to 95% confidence coverage factor (k = 2). Afterward, the final results to determine DMS purity and expanded uncertainty, obtained by the validated
1H-qNMR method, are 99.90 ± 0.54%. The uncertainty
estimation of the 1H-qNMR method presents acceptable
value and corroborates the power of this technique when combined with careful sample preparation.
Quantitative analysis of MDMA.HCl by 1H-qNMR
Once the validation of a general IS-1H-qNMR approach
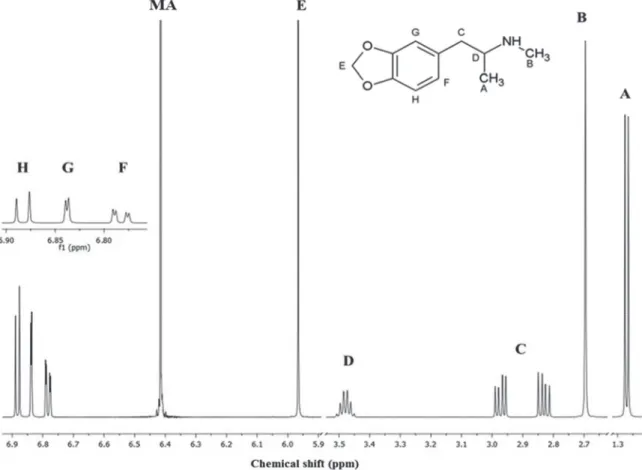
has been concluded, the same procedure was applied to MDMA.HCl quantification. Complete assignment of
MDMA.HCl signals in 1H NMR spectrum is presented
in Figure 2 and summarized in Table S1 (SI section). The signal of the methylenedioxy group (5.97 ppm; E signal in Figure 2) was chosen to quantify MDMA.HCl, since it is a singlet in a relatively quiet region, reducing the possibility of interference, and it can be used to discriminate MDMA.HCl from other ATS, such as methamphetamine and amphetamine.
Selectivity of IS-1H-qNMR for MDMA is initially
demonstrated by verifying that the signals used for quantification, MA (6.42 ppm) and MDMA.HCl (5.97 ppm), and the signals of the main adulterants or cutting agents
Figure1. Effect of different parameters evaluated to 1H-qNMR method
found in real samples (amphetamine, aminopyrine, caffeine, sucrose and procaine) do not present overlapping. This is shown in Figure S2 (SI section). In addition, MDMA.HCl quantification performed in the presence of a mixture of the main adulterants showed a relative error below 4%, a value that is considered acceptable for the method.
The precision of the method was also determined for MDMA.HCl (3 replicates) and showed an RSD value of 1.82%, very close to the one found in the MA/DMS solutions, and considered adequate for the proposed application.
The accuracy experiments previously performed with DMS cannot be directly applied for solutions of different analytes or solvents. A good recovery depends on the extraction step, which is particularly critical in samples with lower purity, and recovery experiments must be designed considering matrix complexity. In our method, the accuracy was evaluated by the analysis of mixtures of cellulose and 40% of MDMA.HCl standards (3 replicates), and the relative error values obtained for MDMA are below 4.5%. These values are similar to those found in the MA/DMS solutions, showing that the method is also accurate to MDMA.HCl analyte.
The LOQ and LOD were determined by means of signal-to-noise (S/N) ratio of 30 and 10, respectively. The LOQ and LOD are 0.67 and 0.22%, respectively, far below the lowest MDMA.HCl concentration determined in real samples.
The stability of MDMA.HCl and MA solutions in D2O was also assessed using the solutions prepared for
recovery experiment. Solutions were analyzed, stored at room temperature in NMR tubes and analyzed again in 72 h. Relative errors < 0.2% showed that the solutions can be considered stable for the period studied.
IS-1H-qNMR method uncertainty was also estimated
for MDMA.HCl determination. The contribution of each component (gravimetric mass, molecular weight, purity of internal standard, integral ratio of analyte and internal standard and recovery) was calculated considering the square of the standard uncertainty. The result shows that recovery is again the main factor for NMR uncertainty (98.53%). The expanded uncertainty was obtained by each sample’s purity, in percentage, multiplied by the combined standard uncertainty value (1.06%) and the 95% confidence coverage factor (k = 2). It is interesting to note that the expanded uncertainty of MDMA quantification
Figure 2. Molecular structure and 1H NMR spectrum (600.13 MHz) of MDMA.HCl in D
2O with MA (internal standard). The letters identify hydrogens
by IS-1H-qNMR method (2.12%) is lower than the value
estimated by the GC-FID reference method (6.28%).
Quantitative analysis of MDMA in seized ecstasy tablets
Finally, real samples of seized ecstasy tablets were analyzed and MDMA was quantified both by GC-FID
and IS-1H-qNMR validated methods. Seizures were
separated in 38 batches according to geographical origin, apprehension date and physical characteristics (e.g. shape, color and logo). The seized tablets present seventeen different logos, weights between 158 and 430 mg and five different excipients were identified by FTIR analysis (cellulose, sucrose, starch, talc, and fatty esters of long chain). In fact, cellulose was identified in more than 60% of the batches. Besides MDMA, at least one adulterant (among aminopyrine, caffeine, procaine or amphetamine) was identified in 15% of analyzed samples. The MDMA. HCl purity ranges from 10 to 77%, representing mass of 39 to 152 mg per tablet.
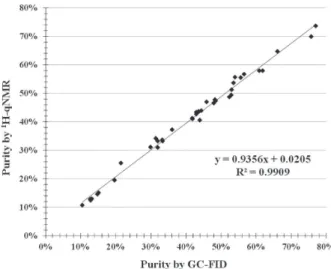
A comparison of GC-FID and IS-1H-qNMR results
is shown in Figure 3. The curve presents an adequate correlation with slope of 0.936, interception on the y-axis at 0.02 and R2 value of 0.9909. As desired, the residues
calculated for IS-1H-qNMR method and those predicted
by the curve are below 5% for all samples. Moreover, the residues values are randomized and show neither bias nor curvatures.
When applying a paired t-test, in which the null
hypothesis (H0) is the equality of the two methods results
(H0: mean of the paired differences (µ) = 0), the value of
observed t (tobs = 1.93) is included in the critical region
defined by tabulated values (–2.026 < tobs < 2.026) and
the p-value is greater than 0.05 (p = 0.061). Then, H0 is acceptable at the 5% level of significance. In addition, the µ value for H0 is within the limits obtained for the 95% confidence interval (–0.0003 < µ < 0.01243). Therefore, the results obtained by the two methods can be considered statistically equal.
Conclusions
The IS-1H-qNMR method applied to MDMA
quantification in ecstasy tablets developed in this work was validated with very good results. The sample preparation is simple, fast and convenient. Since it is not necessary to prepare specific analytical curves, this method demands less work and time. Besides that, the possibility of NMR to identify virtually any active substance of an illegal drug and to quantify it without using the standard of the target analyte are the major advantages of this technique when compared to the commonly used chromatographic methods. In fact, once the method does not demand for specific certified reference material, it can be applied to reduce costs and to provide agility for forensic analysis, which always handles urgency in results and faces unpredictable samples composition.
Supplementary Information
Supplementary information is available free of charge at http://jbcs.sbq.org.br as PDF file.
Acknowledgments
The authors would like to thank the Brazilian Federal Police, the U.S.A. Drug Enforcement Administration’s Special Testing and Research Laboratory and Doctor Patrick Hays. This work is supported by FINEP-CTINFRA (1/2009) and CNPq (422168/2016-5). PeQui Project is supported by FINEP/MCT (01.09.0275-00) and INCTAA/ CNPq. We would like to thank Victor Ferrão for the cover image.
References
1. United Nations Office on Drugs and Crime (UNODC); Global Synthetic Drugs Assessment, UNODC: Vienna, 2017. Available
at http://www.unodc.org/documents/scientific/Global_Drugs_ Assessment_2017.pdf, accessed in November 2017.
2. Togni, L. R.; Lanaro, R.; Resende, R. R.; Costa, J. L.; J. Forensic Sci.2015, 60, 147.
3. Bell, S. E.; Burns, D. T.; Dennis, A. C.; Matchett, L. J.; Speers, J. S.; Analyst2000, 125, 1811.
Figure 3. Comparison of quantification results obtained by GC-FID and
4. Parrott, A. C.; Psychopharmacology2004, 173, 234.
5. Cole, J. C.; Bailey, M.; Sumnall, H. R.; Wagstaff, G. F.; King, L. A.; Addiction2002, 97, 1531.
6. Gimeno, P.; Besacier, F.; Chaudron-Thozet, H.; Girard, J.; Lamotte, A. A.; Forensic Sci. Int.2002, 127, 1.
7. Hays, P. A.; J. Forensic Sci.2005, 50, 1.
8. Van Deursen, M. M.; Lock, E. R.; Portman-van der Neer, A. J.; Sci. Justice2006, 46, 135.
9. Schneider, R. C.; Kovar, K. A.; Forensic Sci. Int.2003, 134, 187.
10. Hays, P. A.; Thompson, R. A.; Magn. Reson. Chem.2009, 47, 819.
11. Malz, F.; Jancke, H.; J. Pharm. Biomed. Anal.2005, 38, 813.
12. Maldaner, A. O.; Botelho, E. D.; Zacca, J. J.; Camargo, M. A.; Braga, J. W.; Grobério, T. S.; J. Braz. Chem. Soc.2015, 26, 1227.
13. Cesar, I. C.; Pianetti, G. A.; Braz. J. Pharm. Sci.2009, 45, 235. 14. Instituto Nacional de Metrologia, Qualidade e Tecnologia
(INMETRO); Orientações sobre Validação de Métodos Analíticos; INMETRO: Rio de Janeiro, 2011. Available at
http://www.inmetro.gov.br/Sidoq/Arquivos/Cgcre/DOQ/DOQ-Cgcre-8_04.pdf, accessed in April 2017.
15. https://www.unodc.org/unodc/en/scientists/international- collaborative-exercises-ice-2014-round-2-summary-report---seized-materials.html, accessed in December 2016.
Submitted: December 15, 2017
Published online: April 3, 2018