HOW EARNINGS ANNOUNCEMENT IMPACT
FAANG STOCK PRICES?
André Tiago Torres Lopes Magone
Master in Finance
Supervisor:
Professor Doutor José Dias Curto, Associate Professor, ISCTE - IUL Business School, Quantitative Methods for Management and Economics Department
Acknowledgements
First, I am grateful to God, for allowing me to successfully surpass all obstacles faced during the path towards this thesis and completing another step in my academic career.
I would like to thank Prof. José Dias Curto, Associate Professor at ISCTE-IUL Business School, Quantitative Methods for Management and Economics Department, for his commitment to the role of supervisor. His office door was always open whenever I ran into a troubled spot or had any questions about my research. He consistently allowed this paper to be my own work whilst steering me in the right direction whenever he thought I needed it. Without his participation, inputs and valuable comments, this thesis could not have been successfully completed.
Secondly, I would like to express my deepest gratitude to my family, to my Mom, my Dad, my little sister, “Titi” and “Avó Ani”, for all the guidance and support in the hardest times, without whom I would not have gotten this far. Thank you for being there for me since I can remember. Also, a warm thank you to my lovely girlfriend for the consistent support, love and believing in me.
Finally, to all my supportive friends, and anyone who, somehow, helped me during the writing of this thesis, a sincere and heartfelt thanks.
Abstract
Beginning in the late '30s, stock market event studies intend to provide more information about market movements and behavior, around the major events during the year, allowing market players to make better and more sustained investment decisions.
This paper analyzes how the FAANG stocks behave when quarterly earnings announcement results are reported. To answer this question, we compare the performance of 7 different announcements for each firm, by the calculation of the abnormal returns, using 3 different normal models with 2 different extensions, and test the statistical robustness with 4 different statistical tests. Our results showed different price reactions around events, but consistent high abnormal returns on an individual event and period analysis on the day after the announcement.
Results also revealed that on a multi-period analysis, the stocks are not consistently positive or negative, leading to symmetric high abnormal returns and a low percentage of abnormal performance. At the same time, on a multi-event analysis, results, by type of news, show significant under and overreactions on the stock market price movements.
However, the efficient market hypothesis is not consistent when the news, resulting from the announcement, incorporate the stock price. From a safety perspective, this study emphasizes on the necessity to consider the impact of quarterly earnings announcement reports, on FAANG stock prices, and consequently on market players’ investment decisions.
Keywords: Abnormal returns; Stock Price; Earnings announcement; Efficient market hypothesis; News sentiment; Price reaction; Market behavior
Sumário
Com início no final dos anos 30, os estudos sobre eventos nos mercados de capitais surgem com o intuito de proporcionar mais informação sobre os movimentos e o comportamento do mercado, em torno dos maiores eventos anuais, permitindo aos players de mercado tomar decisões de investimento mais sustentadas.
Esta tese analisa como é que as ações FAANG reagem, quando é anunciado o relatório dos resultados trimestrais das empresas. Para conduzir a análise, iremos comparar a performance de 7 anúncios, diferentes para cada empresa, através do cálculo dos abnormal returns, utilizando 3 modelos normais com 2 extensões diferentes, e testar a robustez estatística através de 4 testes. Os resultados demonstram diferentes reações dos preços em torno dos eventos. Mais precisamente, abnormal returns elevados e consistentes, no dia após o anúncio, numa análise individual.
Os resultados também revelaram que, numa análise de vários períodos, as ações não apresentam consistência positiva ou negativa, levando a abnormal returns simétricos e uma percentagem reduzida de abnormal performance. Ao mesmo tempo, numa análise multi-eventos, os resultados, de acordo com o tipo de notícias, são significativamente baixos e demonstram reações exageradas nos movimentos de preço no mercado acionista.
No entanto, a Hipótese de Mercado Eficiente não é consistente quando as notícias relacionadas com os anúncios trimestrais incorporam o preço da ação. De forma geral, o estudo enfatiza a necessidade de considerar o anúncio dos resultados trimestrais nos preços das ações FAANG e, consequentemente, nas decisões de investimento dos players de mercado.
Keywords: Abnormal returns; Stock Price; Earnings announcement; Efficient market hypothesis; News sentiment; Price reaction; Market behavior
Table of Contents
1.Introduction ...1
2. Literature Review ...4
2.1. INTRODUCTION TO EMH ...4
2.1.2. Where Does Information Come From?...4
2.1.3. Market Efficiency Anomalies ...5
2.2. EVENT STUDIES ...5
2.2.1 Long Vs Short ...6
2.2.2 Event Study Methodology...6
2.2.3. Earnings Announcement ...7 2.2.4. Post-Earnings Announcement ...8 2.2.5. Earnings Surprise ...8 2.3. RESEARCH GOALS ...9 3. Methodology ... 10 3.1 EVENT STUDIES ... 10
3.2 NORMAL PERFORMANCE MODELS ... 12
3.2.1 Statistical Models ... 13
3.2.1.1 Single Factor Statistical Models ... 13
3.2.1.2 Multi-Factor Statistical Models ... 15
33.3 ESTIMATION OF MODEL... 16
3.3.1 Abnormal Returns ... 16
3.3.2 Cumulative Abnormal Returns ... 17
3.4 TEST STATISTICS ... 18
3.4.1 Parametric Tests ... 19
3.5 MARKET EXPECTATIONS AND EARNINGS SURPRISE ... 24
3.6. DATA GATHERING AND COLLECTION ... 26
3.6.1. Estimation Model ... 26
4. Empirical Evidence ... 27
4.1.1 Sample Observations AR ... 27
4.1.2 Sample Observations CAR ... 34
4.2 FROM AR AND CAR TO AAR AND CAAR ... 39
4.2.1. AR To AAR ... 39
4.2.1.1 Sample Observations AAR... 40
4.2.2 AAR Statistical Tests ... 45
4.2.3. CAR To CAAR ... 48
4.2.3.1 Sample Observations CAAR ... 48
4.2.3 CAAR Statistical Tests ... 51
4.3 RESULTS SUMMARY AND LIMITATIONS... 53
4.3.1 Statistical Power ... 55 5. Future Research ... 57 6. Conclusion ... 58 7. Bibliography ... 61 8. Appendix ... 67 8.1 APPENDIX A – EQUATIONS... 67
8.2 APPENDIX B – RESULTS EXPLANATION ... 69
List of Tables
Table 1 – Description of hypothesis and parametric tests used on different levels of analyze ... 18
Table 2 – Amazon abnormal returns and t-test value per model ... 28
Table 3 - Apple abnormal returns and t-test value per model ... 30
Table 4 -Facebook abnormal returns and t-test value per model ... 30
Table 5 – Netflix abnormal returns and t-test value per model ... 32
Table 6 – Google abnormal returns and t-test value per model ... 33
Table 7 – Amazon cumulative abnormal return values per category and t-test value ... 36
Table 8 – Apple cumulative abnormal return values per category and t-test value ... 36
Table 9 – Facebook cumulative abnormal return values per category and t-test value ... 36
Table 10 – Google cumulative abnormal return values per category and t-test value ... 36
Table 11 – Netflix cumulative abnormal return values per category and t-test value ... 36
Table 12 – Amazon average abnormal returns and t-test value per type of news ... 40
Table 13 – Apple average abnormal returns and t-test value per type of news ... 41
Table 14- Facebook average abnormal returns and t-test value per type of news ... 42
Table 15 -Google average abnormal returns and t-test value per type of news ... 43
Table 16 – Netflix average abnormal returns and t-test value per type of news ... 44
Table 17 – Amazon AAR results for parametric tests ... 45
Table 18 – Apple AAR results for parametric tests ... 46
Table 19 – Facebook AAR results for parametric tests ... 46
Table 20- Netflix AAR results for parametric tests ... 46
Table 21- Google AAR results for parametric tests ... 47
Table 22 - Amazon CAAR parametric tests results ... 51
Table 23- Apple CAAR parametric tests results ... 52
Table 24 - Facebook CAAR parametric tests results ... 52
Table 25 - Netflix CAAR parametric tests results ... 52
Table 26 - Google CAAR parametric tests results... 52
Table 27- Apple estimation parameters description ... 71
Table 28 – Amazon estimation parameters description ... 71
Table 29 - Facebook estimation parameters description ... 71
Table 31- Netflix estimation parameters description ... 72
Table 32 – Apple single factor CAR values per event ... 73
Table 33 - Apple multi-factor CAR values per event ... 73
Table 34 – Amazon single factor CAR values per event ... 74
Table 35 – Amazon multi-factor CAR values per event ... 74
Table 36 – Facebook single factor CAR values per event ... 75
Table 37 – Facebook multi-factor CAR values per event ... 75
Table 38 – Google single factor CAR values per event ... 76
Table 39 – Google multi-factor CAR values per event ... 76
Table 40 – Netflix single factor CAR values per event ... 77
Table 41 – Netflix multi-factor CAR values per event ... 77
Table 42 – Netflix correlation between AR (1) and Earnings Surprise ... 78
Table 43 – Google correlation between AR (1) and Earnings Surprise ... 78
Table 44 – Facebook correlation between AR (1) and Earnings Surprise ... 78
Table 45 – Amazon correlation between AR (1) and Earnings Surprise ... 78
Table 46- Apple correlation between AR (1) and Earnings Sur ... 78
Table 47- Apple model´s average AR evolution from day -10 to event day ... 79
Table 48 – Apple model´s average AR evolution from day 1 to day 10 ... 79
Table 49 - Amazon model´s average AR evolution from day -10 to event day ... 79
Table 50- Amazon model´s average AR evolution from day 1 to day 10 ... 80
Table 51- Facebook model´s average AR evolution from day -10 to event day ... 80
Table 52 – Facebook model´s average AR evolution from day 1 to day 10 ... 80
Table 53 Google model´s average AR evolution from day -10 to event day ... 81
Table 54 - Google model´s average AR evolution from day 1 to day 10 ... 81
Table 55 – Netflix model´s average AR evolution from day -10 to event day ... 81
List of Figures
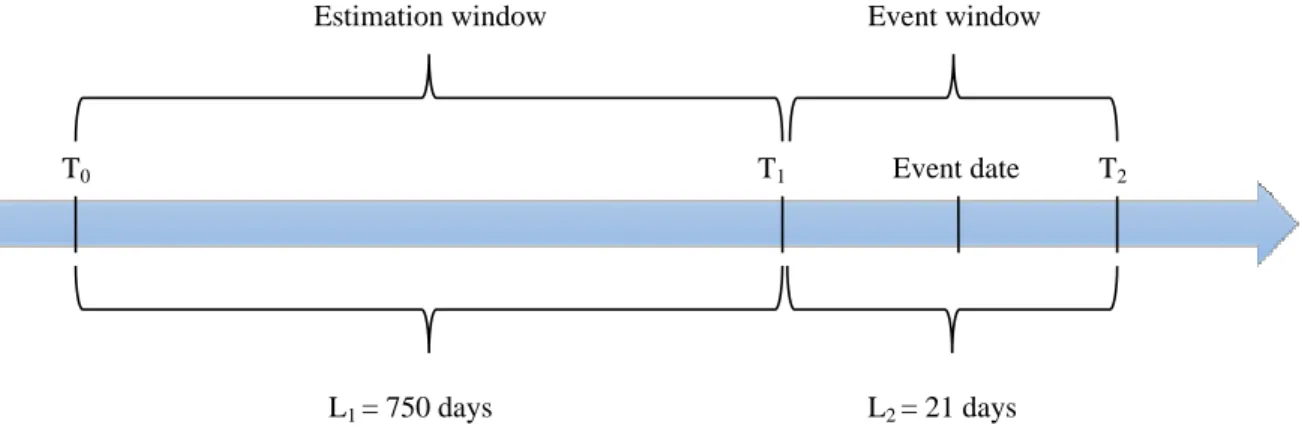
Figure 1- Event study timeline ... 12
Figure 2 – Amazon abnormal returns during the event window for each event... 29
Figure 3 - Apple abnormal returns during the event window for each event ... 29
Figure 4 - Facebook abnormal returns during the event window for each event ... 31
Figure 5 - Netflix abnormal returns during the event window for each event ... 32
Figure 6 - Google abnormal returns during the event window for each event ... 33
Figure 7 – Amazon multi-period CAAR results ... 48
Figure 8 – Apple multi-period CAAR results ... 49
Figure 9 - Facebook multi-period CAAR results... 49
Figure 10 – Google multi-period CAAR results ... 50
List of Abbreviations
AR – Abnormal Returns
CAR – Cumulative Abnormal Returns AAR – Average Abnormal Returns
CAAR – Cumulative Average Abnormal Returns EPS – Earnings per Share
VIX – CBOE Volatility Index
𝑹𝑰𝑵𝑫 – Average Return Industry Proxy
SMB – Small Minus Big HML – High Minus Low RMW- Robust Minus Weak
CMA- Conservative minus Aggressive FF - Fama French
EMH – Efficient Market Hypothesis
FAANG – Facebook, Amazon, Apple, Netflix, Google P/E – Price-to-Earnings Ratio
M&A – Mergers and Acquisitions CAPM – Capital Asset Pricing Model MM – Market Model
1.Introduction
The market behavior after an earnings announcement is considered to be one of the most effective ways to prove that asset’s price do not adjust all public information available immediately, and often investors profit based on public information. Several researches have empirically found that stock prices after earnings announcements do not adjust as quickly as expected by the efficient market hypothesis (EMH), allowing investors to profit on the margin generated in between market adjustments. Findings have also shown that earnings announcement expectancy is largely affected by tone and type of information of press releases near the event, causing what’s referred to as “Post earnings announcement drift”. Other variables impact the direction and the amplitude of the stock price movement after the event, such as post earnings surprise and private information.
These findings have been supported by a variety of theoretical explanations, on articles of the main authors working in event studies, Patell and Wolfson (1981), Boehmer, Musumeci and Poulsen (1991), Fama and French (1992), Kothari and Warner (2006) and Kolari and Pynnonen (2010), Our main focus is to comprehend and study the behavior of FAANG stock prices (Facebook, Apple, Amazon, Netflix and Google) after earnings announcement. We investigate abnormal returns performance of 35 different earnings events, 7 for each FAANG stocks.
On this study we make three contributions to existing literature. First, as mentioned above, we focus on market abnormal return movements after the earnings announcements on the FAANG stocks, specifically, 10 days before and 10 days after the event day using a 750 days estimation window. We study the abnormal performance behavior, statistical significance and possible linear correlation between FAANG stocks events, what is the impact among events from each company. Second, much like existing literature, our study also focuses on behavioral effects around the event base, most precisely after the announcement. In order to test another type of variables, we run a linear regression model to understand how market earnings surprise value influence the abnormal returns scale. Third, we perform a joint study of FAANG average abnormal returns and average cumulative abnormal returns through a series of parametric tests, in order to properly conclude about the significance of results. Also, and consequently, infer to the investor’s perspective, practical material to increase the quality of the investment decisions towards the FAANG stocks after the earnings announcement report.
Our empirical analysis uses the earnings announcement dates of FAANG stocks, from the second quarter of 2017 until the last quarter of 2018. We will analyze 35 earnings announcements, 7 per firm, in terms of abnormal returns activity. Every earnings announcement will be treated as an event and conducted by the following empirical strategy. For each stock, the event window used will be from 10 days before the event date to 10 days after. As estimation window we will consider 750 days before the first day of the event window. Daily data will be used in order to catch the presence of abnormal returns on a short-term analysis.
Abnormal returns are the difference from the estimated return through a specific model and the return that was registered. To estimate the returns in order to calculate the abnormal returns, single factor and multi-factor models were used. Inside the single factor, the most common model, the Market Model, was used with two extensions on the error term, GARCH and EGARCH to account for time-varying volatility effects and shocks. On the multi-factor side, the Fama-French (FF hereinafter) three factors plus the VIX Index, and another model with a proxy for the tech industry and the VIX were chosen in order to mitigate risks.
The market proxy used is the S&P 500 Index for all the models. To investigate the presence of significant abnormal return, we will test the abnormal returns performance, through the estimation models, by calculating the abnormal returns, average abnormal returns, cumulative abnormal returns and cumulative average abnormal return and test the statistical robustness through the parametric tests, t-test, adjusted Patell test, adjusted cross-sectional test and skewness corrected test. All tests will be done under specific conditions and assumptions that will be shown and explained during the study. The null hypothesis, (non-presence of abnormal returns performance) will be rejected at 5% and 1% significance level for the abnormal returns, and at 10% and 5% for the parametric tests.
FAANG stocks show evidence of a not stable and constant behavior with large speculation and expectancy from the market players due to the small percentage (21.74%) of statistically significant CAR values. Regarding the sensitivity to news, the correlation coefficient, between abnormal returns and type of news, is on average, 0.176 and 0.36 in absolute value which represents weak linear correlation. Also, we see that 60% of the firms present abnormal
The parametric tests displayed a rejection of the null (abnormal returns equal to 0) at 5% on day 1 after the announcement on, 80% for the Patell test, 20% for the BMP test and 20% for the skewness correct 𝑡 𝑡𝑒𝑠𝑡. Thus, the results support the true rejection of the null only in 20% of the firms. For the CAAR values, we do not have sufficient evidence to reject the null hypothesis and conclude about the presence of statistically significant abnormal returns on a multi event and multi day analysis.
From all the event we conclude that, individually, events impact stock prices. on the day after the announcement, presenting a good profit margin basis for investor to trade on public news. The magnitude of the impact derives from a lot of variables, some studies on this thesis, others to be approached on future works, but taking out of the equation private news and insider trading pressure, in a cumulative analysis, all stocks show different bearish and bullish patterns of abnormal performance, leading investors to be able to better understand the stock price tendency around and after the earnings announcement reports.
Following the thesis structure, in the next section we discuss the Literature Review about the event studies and its contribution to test the EMH and to the finance literature in general. After, we approach the general methodology on event studies and propose the methodology used to address our analysis. Data gathering and empirical evidence are focused on the last sections before the conclusion and in the end, we suggest some points to consider on future researches.
2. Literature Review
In the following subsections, the theory behind event studies, the impact of information in the markets as well as the anomalies of the market and the way that event studies test the EMH will be addressed.
2.1. Introduction to EMH
Can information be used to improve our investing performance?
Efficient Market Hypothesis suggests that we cannot profit based on new information. EMH supports Fama (1970:383) definition that “A market in which prices always “fully reflect” all
available information”. In other words, the asset´s market price reflects the true price as the asset
reflects all available value-relevant information. This theory expands into three different forms (Fama, 1970), weak form, semi-strong form and strong form of efficiency.
Many studies were conducted in this field, from the theory construction in the 1960s, Fama (1965a, 1965b) and Samuelson (1965) to the establishment of empirical corroboration on the 1970´s Fama (1970, 1976a). After that, the theory becomes challenged by Behavioral Finance, Thaler (1999) and Shiller (2003), Adaptive Market Hypothesis, Lo (2004) and many other authors.
2.1.2. Where does information come from?
Information can be distinguished into three types according to its provenience. The exchanges, SEC filings1 and news. This type of information matches the three different forms of market efficiency since one is based on technical indicators, the other on fundamentals and public news and the last on private news.
As previous studies suggest, the information does affect asset prices (Easley et al., 2002). In the current study, the aim is on event studies, which is based on the effect of mostly public information and the sentiment about that information on stock prices after earnings announcements. As previously studied, event studies showed significant results on asset price responsiveness to new information (Mackinlay, 1997), which opens the window of opportunity to test the possible delays in the price adjustment (Busse and Green, 2002).
2.1.3. Market Efficiency Anomalies
Though reasonably supported in early empirical work, reported in Fama (1970, 1991), anomalies have been documented in later work that contradicts the efficient market hypothesis. EMH is violated in the field of event studies as asset prices show that new information has a significant impact on returns. If the semi-strong form of market efficiency was correct, P/E ratio over time should not demonstrate a linear relationship with returns, although Shiller (2005) suggests that the lower the P/E ratio the higher the return, which indicates that this fundamental indicator is a good predictor of returns.
Furthermore, Henry (2008), showed that abnormal market returns tend to be higher or lower based on press releases’ tone, suggesting a correlation between time of the press release and the impact of unexpected earnings. To challenge the strong market efficiency, many authors studied the field of insider trading, suggesting relevant profit bases in comparison to investors based only on public information (Macey and Haddock, 1987). Literature is reviewed very briefly on this topic since the paper does not focus on these types of anomalies.
2.2. Event Studies
In EMH theory it is assumed that capital markets reflect all available information about a firm in the stock prices and event studies appear as a tool to test and verify the validation of this theory. Event studies movement started in the 1930s, on a study conducted by Dolley (1933). Further and more recent studies appear in Breinlich et al. (2018), but during the years, many researchers have developed the event study methodology to perform this type of analysis (Ball and Brown, 1968; Armitage, 1995; Corrado, 2011) and all the others previously mentioned in the study.
The analysis is in its most common form, focused on stock returns, and less used, with a focus on trading volumes and volatilities. McWilliams and Siegel (1997: 626) state that an event study methodology, “determines whether there is an ´abnormal` stock price effect associated with an
unanticipated event. From this analysis the researcher can infer the significance of the event”.
Return event studies quantify an event’s economic impact calculating abnormal returns by deducting the normal returns that would have been realized if the analyzed event would not have taken place. While the actual returns can be empirically observed, the normal returns need to be estimated. For this, the event study methodology uses expected return models. In earlier empirical work, an event study is referred to as a semi-strong-form test of market efficiency (Fama, 1970).
Over the years, numerous researchers have performed event studies, whether the topic of interest was stock splits, dividend announcements or quarterly earnings. Kothari and Warner (2006) state that there were over 550 published event studies. In sum, in the event study methodology, the researcher hypothesizes that markets adjust to new information immediately assuming EHM as null hypothesis (Kothari, 2001).
2.2.1 Long vs Short
On event studies, the event window can be short or long and can be considered in days, months or years. On one hand, concerning longer-term effects, the related methodology that has been developed captures if an event has had a persistent impact on stock prices over long periods 2. On the other hand, by Kothari (2001) definition, short term event studies can be characterized as studies estimating the abnormal returns up until one year from the event date. This paper will focus on short term event studies, considering a 21 days event window.
In the long term, many studies show that abnormal returns spread over long horizons. The main literature on this subject is present on Fama (1998), Kothari and Warner (1997), Schwert (2001), and Kothari (2001). More detailed discussions appear in (Barber and Lyon (1997), Kothari and Warner (1997), Lyon, Barber, and Tsai (1999), Fama (1998), Brav (2000), Jegadeesh and Karceski (2004), Viswanathan and Wei (2004), Eckbo, Masulis, and Norli (2006).
2.2.2 Event Study Methodology
Every event study is calculated based on an expected return model which has some methodological assumptions behind (Brown and Warner, 1980).
The following three are the most important:
1. Event window stock returns of a particular event study accurately reflect the economic impact of the event;
2. Event is unexpected and has not yet been factored into the stock price;
3. There are no other events during the event window, which could be responsible for the stock price change.
Depending on the expected return model used, more assumptions need to be met. For the most common model, the Market Model, which is being used in this paper, the relationship between the stock and the market needs to remain stable throughout the estimation and event window. Only then, the alpha and beta factors, which are established with a regression analysis during the estimation window, can be used to predict expected returns for the event window (Schimmer, Levchenko, and Müller, 2015)
When testing for market efficiency, the researcher must always use a returns’ normal model, where the tests are jointly testing market efficiency and the asset-pricing model. This creates a joint-hypothesis problem and, conclusions about market inefficiency cannot be accepted naively without
acknowledging a potential model misspecification’s effect on the results (Fama, 1991). Fama states in the same article that one way to possibly minimize this problem is to use daily data
in event studies, allowing a precise measure of how quickly the stock price responds. Event study methodology will be reviewed later in this paper.
The next section will review some of the earlier research on earnings announcements applied to event study methodology.
2.2.3. Earnings Announcement
The semi-strong form of market efficiency states that stock market prices reflect all publicly available information and therefore, trading on this basis is not profitable. If it were true, investors couldn’t outperform the market by trading on public information. Is the hypothesis valid? A few studies supported the EMH by observing zero abnormal returns while, on the other hand, studies observed abnormal returns and empirically proved market inefficiency. This mixed evidence gives further scope for empirical investigation of EMH on the capital market, Bernard and Thomas (1989 and 1990) and Freeman and Tse (1989) argue that stock markets do not adjust instantly to new information flow, therefore investors can make abnormal profits by trading based on earnings data. Ball and Kothari (1991) concluded that earnings announcement usually include information which is not available to the market and excess returns are generated after the announcement day. All this evidence demonstrate that earnings announcements contain information which is not available to markets and stock prices fail to reflect all the information released to the public.
2.2.4. Post-Earnings Announcement
Post earnings announcement drift referred by Shivakumar (2007: 434) as the “longest standing
anomaly in the finance and accounting literature”, represents a contradiction to the efficient
market hypothesis. The drift implies market under-reaction to earnings news. which means that information does not immediately adjust to prices. It was first documented by Ball and Brown (1968) and after, more detailed studies were conducted by Watts (1978) and Ball and Bartov (1996). Ball and Brown (1968) established that asset prices do not always immediately reflect the new earnings information and firms, experiencing positive or negative earnings surprises, have been documented to encounter drifts in estimated cumulative abnormal returns, upward or downward for some time after the event day.
Bernard and Thomas (1989) propose two hypotheses for the post-earnings announcement drift. First, there is the possibility that part of the price´s response to new information is delayed, due to failure in assimilating available information. Second, when the drift has been observed, in research where the normal returns are estimated with the CAPM, studies have shown that the model fails to properly adjust the securities for risk (Foster, Olsen, and Shevlin, 1984; Ball, Kothari and Watts, 1993).
In previous sections, some documented anomalies in contradiction to the efficient market hypothesis were briefly introduced. Questions have been raised about whether the post-earnings announcement drift exists, independently of other anomalies, but what are the implications of the post-earnings announcement drift for securities trading? Kothari (2001:196) states that “the post
earnings announcement drift appears to be incremental to a long list of anomalies that are inconsistent with the joint hypothesis of market efficiency and an equilibrium asset-pricing model”.
A few years later, Shivakumar (2007) pointed out that, a trading strategy using the post-earnings announcement drift is still profitable, nearly forty years after its first realization.
2.2.5. Earnings Surprise
Investors are not able to fully recognize the market shocks created by earnings announcement hence, they misestimate future expected earnings. In the next quarters, when earnings are announced, stock prices adjust to different results instead of the predicted based on past time series of announcements, causing a surprise shock in the market. Research by Liu and Thomas (2000)
shows that a significant portion of the market reaction surrounding earnings announcements is attributable to other information, released around the announcement date, rather than the earnings information itself. Prior research has predominantly focused on earnings surprise and very little attention has been directed towards non-earnings information released around the earnings announcement date. Information presented on press releases and the way that the information is written is a major factor when it comes to influencing market price movements. Press releases “construct” investors’ sentiment towards the earnings report of that quarter (Henry, 2008). Experts predict the next quarterly earnings EPS and compare their estimations to the real value when the report comes out. The difference between the predicted and the reported EPS value generates a percentage of surprise. Could this surprise be correlated with the abnormal return movements? In the results section, we will discuss the possible existing correlation in more detail.
2.3. Research Goals
Research question:
How earnings announcements impact in stock price movements? (FAANG stocks event study analysis)
Goals of the paper:
• Test whether FAANG stocks follow a semi-strong form of EMH or not.
• Test if FAANG stocks market reactions to quarterly earnings announcement through 35 different events generate abnormal returns and if they are statistically significant.
• Test if the difference, between predicted and reported EPS related to an earnings announcement, is somehow correlated with FAANG stock price movements
Hypothesis that will be tested:
• If Abnormal Return (AR), Cumulative Abnormal Returns (CAR), Average Abnormal Returns (AAR) and Cumulative Average Abnormal Return (CAAR) are approximately equal to zero. • If there is randomness in the occurrence of AARs.
• If AAR are sensitive to the type of news (“Good”, “Bad”, “No news”)
• If parametric tests corroborate with the possible rejection of the null on AARs and CAARs. • If exists a correlation between earnings surprise and abnormal returns on the day after the announcement date.
3. Methodology
In this section, the methodology used is described. The first subsection presents the overall framework, in other words, the research paradigm. The second and third subsections present the research processes, more specifically, the choice of window, models, and variables applied in the study. The fourth and fifth subsections explain the test statistics used and hypothesis tested, as well as the market expectations and surprises.
3.1 Event Studies
From the literature review section, it was possible to conclude that post-earnings announcement drift tends to violate the semi-strong form efficiency market hypothesis. So, it is important to introduce an event study approach to test the performance of capital markets. The underlying assumption of this approach is that capital markets follow a semi-strong form of efficiency. For that, it is necessary to measure the valuation effects of earnings announcements, as well as, examine the response of stock price around the event’s earnings announcement, by treating and process data in MS Excel and Event Study Tools ARC 3.
The event study framework has not changed drastically since the late 1960s when Ball and Brown (1968) and Fama et al. (1969) introduced their methodology concerning the estimation of abnormal returns (AR) as an important measure to test the market’s efficiency in response to announcement events. Moreover (Fama, 1991:1602) states that event studies are an important part of finance and states that “event studies are the cleanest evidence we have on efficiency”.
There are short (< 1 year) and long-horizon (> 1 year up to 5 years) event studies. As in Kothari and Warner (2006), long-horizon event studies have been improved in recent years, but short-term horizon remains more reliable. In line with this conclusion, we will conduct our event study in a short-term paradigm. To construct an event study, it is necessary to design the event study timeline. For this, we will follow the first two steps of the standard event study technique (Brown and Warner 1985).
Firstly, based on data from the estimation window, also known as control period, the market model is estimated through a regression model, which is used to determine the normal behavior of a stock’s return in comparison with the market or industry Index. Secondly, the event window is centered on the announcement day and encompasses a set number of days around the event day. This length in short-term events is normally between 1 and 20 days excluding the event date. Abnormal returns are calculated on this window, based on the predicted and observed returns. In this period, we will calculate the abnormal returns to understand the abnormal performance and gather information to conclude on the stock price response to new information, generated by the earnings announcement.
For the present event study, we will focus on FAANG stock’s quarterly earnings announcements. More precisely, for each firm, we will analyze 7 quarterly reports between the 2nd quarter of 2017
and the 4th quarter of 2018. Trading data is collected daily and the study window is based on short
term horizon. Although, there are challenges regarding the use of daily data for event studies (Brown and Warner, 1985), as Kothari and Warner (2006: 8) state, daily data “permits more
precise measurements of abnormal returns and more informative studies of announcement effects”.
The estimation window should be chosen in a way that the returns are not compromised with their performance within the event. Armitage (1995) suggests that results are not sensitive to varying estimation window lengths as long as the window exceeds 100 days. Moreover, Holler (2014) on his meta-research analysis concluded that the main window length spreads out between 30 and 750 days. The event windows typically range in their lengths between 1 and 11 days and center symmetrically around the event day. The most common choice of event length in a recent paper by Oler, Harrison, and Allen (2007) is 5 days.
We decide that the estimation window length will have 750 trading days, the event window 21 trading days, including 10 days before the event date and 10 days after, to capture early and late market adjustments (Figure 1). Considering that the estimation window will count in descending order, 750 days starting before the first day of the event window, the estimation window will be adjusted for every event.
Figure 1- Event study timeline
From previous literature, many event studies have been performed and the methodology has become fairly standardized over time. In this thesis we adopt the below summarized methodology: 1. Identify the stocks to analyze.
2. Select the frequency of data to use (daily, weekly, monthly or annually). 3. Identify the announcement day and define the event type (short or long term). 4. Identify the estimation and event window length.
5. Choose the market proxy, normal returns model and exogenous variables for the multi-factor. 6. Compute the abnormal returns, average abnormal returns, cumulative abnormal returns, cumulative average abnormal returns.
7. Compute the 4 main statistical tests, 𝑡 𝑡𝑒𝑠𝑡 , 𝐴𝑑𝑗𝑢𝑠𝑡𝑒𝑑 𝑆𝑡𝑎𝑛𝑑𝑎𝑟𝑑𝑖𝑧𝑒 𝐶𝑟𝑜𝑠𝑠 𝑆𝑒𝑐𝑡𝑖𝑜𝑛𝑎𝑙 𝑡𝑒𝑠𝑡,
𝐴𝑑𝑗𝑢𝑠𝑡𝑒𝑑 𝑃𝑎𝑡𝑡𝑒𝑙 𝑡𝑒𝑠𝑡 and 𝑆𝑘𝑒𝑤𝑛𝑒𝑠𝑠 𝐶𝑜𝑟𝑟𝑒𝑐𝑡𝑒𝑑 𝑡𝑒𝑠𝑡.
8. Test the hypothesis and evaluate the results.
3.2 Normal Performance Models
Event studies are used to measure the impact of a specific event on a firm’s value and prices. To accurately conclude on the results, it is necessary to appropriately choose the normal return model. To estimate the normal returns, there are two types of models, statistical and economic (MacKinlay, 1997). The author affirms that statistical models follow (MacKinlay, 1997: 7) “the
assumption that asset returns are jointly multivariate normal and independently and identically distributed through time is imposed”. However, in general, these assumptions lead to analysis´s
problems, therefore we will use statistical tests to minimize their impact.
T0 T1 Event date T2
Estimation window Event window
3.2.1 Statistical Models
Statistical models are separated into two categories, single factor and multi-factor models. The most popular model according to financial literature, for an event study, is the Market Model, which includes a single factor model. Supported by Holler (2004) meta-research, almost 80% of papers elaborated throughout the years used the MM as estimation model and only 4% used multi-factor models.
As the estimation model, we will use a combination of single and multi-factor models to compare and conclude with more accuracy about the significance of the event results. As single factor model, we will use the MM with two different extensions on the error term and for multi-factor, two models with different types and numbers of variables, are used.
3.2.1.1 Single Factor Statistical Models
The MM is the most common approach to calculate expected returns. This model overcomes the impact of general market movements in a rudimentary way by assuming a constant and linear relation between individual asset returns and the return of a market Index.
Although the type of estimation model used, represent a huge factor in the quality of the results, the market proxy Index choice is also a main aspect to obtain accurate results. In general, the Index that is considered the most capable to portrait the American market is S&P500, which is the one used to calculate abnormal returns on this study. Market Model general equation assumes the following form:
r𝑖𝑡 = 𝛼𝑖 + 𝛽𝑖𝑟𝑚𝑡+ 𝜀𝑖𝑡 (1)
Where r𝑖𝑡is the return of the stock of asset 𝑖 on day 𝑡, 𝑟𝑚𝑡 is the return of the reference market on day 𝑡, αi is the intercept of the value of r𝑖 when 𝑟𝑚 equals to zero, 𝛽𝑖 is the regression coefficient (estimation of the systematic risk for asset 𝑖) and a measure of the sensitivity of r𝑖𝑡on the reference market. The 𝜀𝑖𝑡 is zero mean error term on the asset 𝑖 on the period 𝑡.
It is assumed that 𝜀𝑖𝑡 is uncorrelated to the market return 𝑟𝑚𝑡 and firm return r𝑗𝑡 with 𝑖 ≢ 𝑗 not autocorrelated, and homoscedastic. Moreover, the variance (𝜎𝜀2𝑖), beta (𝛽
𝑖), alpha (𝛼𝑖) are the parameters of the model. The estimation results are displayed on Table 27, Table 28, Table 29, Table 30 and Table 31 (Appendix B).
Although the MM is widely accepted as a standard model for event studies, it has also some limitations. The model assumes that risk-free interest rate, included in the 𝛼 factor, is constant, which conflicts with the assumption that market returns vary over time and assume homoscedasticity on the error term. To diminishing the homoscedasticity impacts on results, we expand the MM using a GARCH model to deal with conditional heteroskedasticity of error term; see equation (4). As in Corhay and Tourani (1996) and Wang et al (2002), MM with GARCH expansion is used to account for time-varying volatility effects to obtain more efficient results. The GARCH (q,p) model is defined as:
r𝑖𝑡 = 𝜇𝑡+ 𝑢𝑖𝑡 (2)
𝑢𝑖𝑡 = 𝜎𝑡𝑧𝑡 (3)
And the conditional variance (Bollerslev, 1986) may be written as: 𝜎𝑡2 = 𝑤 + ∑ 𝑢𝑖𝜀𝑡−𝑖2 + ∑ 𝛽𝑖𝜎𝑡−𝑗2 𝑝 𝑗=1 𝑞 𝑖=1 (4)
Where r𝑖𝑡 represents the log return of an asset at time , 𝑢𝑖𝑡 is the mean-corrected return of an asset at time 𝑡, 𝜇𝑡 is the conditional mean of r𝑖𝑡 , 𝜎𝑡2 is the conditional variance at time 𝑡 conditioned on the history, 𝑢 and 𝛽 the parameters of the model and 𝑧 the sequence of independent and identically distributed standardized random variables (i.e. E[𝑟|] = 0, VAR [𝑟| ] = 𝜎𝑡2).
By handling the MM with GARCH expansion (2), the general feature of conditional heteroscedasticity is added to the equation allowing the MM to successfully capture time-varying volatility. GARCH application’s main problem is the non-distinction of positive and negative market movements, failing to explain the “leverage effects”, which are observed in the financial time series (Matei, 2009). First observed by Black (1976), leverage effects represent a tendency of variation in stock prices to be negatively correlated with changes in stock volatility. The effect of a shock upon the volatility is asymmetric, meaning that the impacts of good news and bad news are distinct (Matei, 2009). For this reason, we will also estimate the MM with EGARCH expansion (5), assuming non-symmetric effect events on the stocks and volatility, to obtain better results.
The equation of conditional variance (Nelson, 1991) is written as: ln 𝜎𝑡2 = 𝑤 + ∑ 𝛼𝑖|𝑢𝑡−𝑖| 𝜎𝑡−𝑖 + 𝑞 𝑖=1 ∑ 𝛾𝑖 𝑞 𝑖=1 |𝑢𝑡−𝑖| 𝜎𝑡−𝑖 + ∑ 𝛽𝑖 𝑙𝑛 𝜎𝑡−𝑖 2 𝑞 𝑖=1 (5)
Where the asymmetry coefficient, 𝛾𝑖 allows the leverage effect to be accounted for. Hence, positive and negative values of 𝑢𝑡−𝑖 have a different impact on volatility at time 𝑡. "Unlike the
GARCH model, the logarithmic transformation of the conditional variance implies no restrictions on the parameters are required to ensure that 𝜎𝑡> 0" (Curto, 2018: 32).
In the present study, single factor model used for expected normal returns calculations is the MM without any extension and, with GARCH and EGARCH extension (4), (5).
3.2.1.2 Multi-factor Statistical Models
Multifactor models are used to construct portfolios with certain risk characteristics with the final goal of mitigating issues in relation to CAPM model (Equation (37), Appendix A) and thus, provide better estimates for benchmarked returns in event studies. The literature around multi-factor model is limited but suggests that multi models produce only marginal benefits over a standard MM in predicting event day normal returns. However, they generate less skewed abnormal returns, which are better suited for statistical tests (Ahern, 2009).
The most known multi-factor model is the Fama and French three-factor model, (Equation (38), Appendix A). This model has three factors: size of firms, book-to-market values and excess return on the market. In other words, SMB, HML and portfolio's return less the risk-free rate of return, are the three factors used (Fama and French, 1993). Behind the multi-factor models remain the idea that a model with more variables can explain better the market behavior. In comparison to single models, multi-factor, despite their several limitations, offer increased explanatory power and flexibility.
In the event study field, the use of multifactor models does not decrease the forecast error bias, in comparison to more simple methods. Instead, only the characteristic-based benchmark approach exhibits no mean bias in any sample grouping. Power can also be improved slightly on test statistics (Ahern, 2009).
In the present study we will use 2 multi-factor models, a model with 2 variables and another one with 3 variables. More precisely, on the first one, industry proxy is one of the variables, calculated
through the average of SP NA Tech Index and IGM Index, and as second variable the VIX Index (6). These variables will be used to catch investor sentiment towards the market and,
industry performance to better explain stock performance.
r𝑖𝑡 = 𝛼𝑖 + 𝛽𝑖(𝑟𝑚𝑡) + 𝛽𝑗(𝑟𝐼𝑛𝑑) + 𝛽𝑙(𝑟𝑉𝐼𝑋) + 𝜀𝑖𝑡 (6) The second multi-factor model used is an extension of FF three-factor model, adding volatility risk adjustment, through VIX Index to the equation (7). This will be an adaptation of the FF 4 factor model presented by Carhart (1997), (Equation (39), Appendix A).
r𝑖𝑡 = 𝛼𝑖+ 𝛽𝑖(𝑟𝑚𝑡 − 𝑟𝑓) + 𝛽𝑗(𝑆𝑀𝐵) + 𝛽𝑙(𝐻𝑀𝐿) + 𝛽𝑙(𝑟𝑉𝐼𝑋) + 𝜀𝑖𝑡 (7) Further research was conducted by Fama and French (2015) with the introduction of other risk factors. Along with the original three factors, the new model adds two more factors, profitability and investment. Few studies have been conducted with these multi-factor models leaving space to new and further research in this area (Equation (40), Appendix A).
What differs among these models are the assumptions about the expected return and risk for the stock. In practice, gains from using more sophisticated models are limited because the variance of abnormal returns is not reduced significantly by choosing these models (Brown and Warner, 1985; MacKinlay, 1997).
33.3 Estimation of Model
Through the MM choice and parameters presented in the previous sub-section, the respective choice of methods and calculations will be explained in the following sub-sections, considering S&P500 Index as a proxy of the market.
3.3.1 Abnormal Returns
Abnormal returns are the difference between the actual return and expected return from the normal model calculation, making them an essential measure to evaluate the impact of an event. More precisely, abnormal returns are essential in determining the asset's risk-adjusted performance when compared to the overall market or benchmark Index.
An abnormal return is referred to as, either a positive or a negative abnormal return, depending on where the actual return falls in comparison to the normal return.
Abnormal returns on are calculated as follows:
𝐴𝑅𝑖𝑡 = 𝑟𝑖𝑡− (𝛼̂ + 𝛽𝑖𝑟𝑚𝑡) (8) Where 𝐴𝑅𝑖𝑡 the abnormal return, which is the disturbance term 𝜀𝑖𝑡 on the event window of the MM for firm 𝑖 at the period 𝑡. The actual return for firm 𝑖 at the period 𝑡, 𝑟𝑖𝑡, and 𝛼̂ − 𝛽𝑖(𝑟𝑚𝑡) is the expected return.
As in Corrado and Truong (2008), daily stock returns calculated with a logarithmic function, perform better test specifications in event studies. There are two different measures to aggregate abnormal returns that are normally used in the finance literature for an event study, BHAR (Buy-and-Hold Abnormal Returns) and CAR (Cumulative Abnormal Returns). As in Loughran and Ritter (1995) and Fama (1998), BHAR method provides best returns when the focus is on long-horizon event studies. While it is true for long-term studies, it is also true that CARs perform better for short-term studies. The focus of the study relies on short term and CARs will be used as the comparison method.
3.3.2 Cumulative Abnormal Returns
A hierarchy of abnormal returns calculated is compounded to cumulative abnormal returns (CARs), which can be averaged to cumulative average abnormal returns (CAARs) in cross-sectional studies. The cumulative abnormal return method is normally used to determine how accurate the model is. More often, it is used to investigate the impact of any extraneous events affecting stock prices. Additionally, the authors, Kothari and Warner (2008), suggest that this measure should be used to see how fast the market reacts to new information and consequently test the semi-strong form of EMH.
CARs method is the sum of the abnormal returns of the stock 𝑖 at the period 𝑡 (9).
𝐶𝐴𝑅𝑖 = ∑ 𝐴𝑅𝑖𝑡 𝑇2
𝑡=𝑇1+1
(9)
Performance analysis of abnormal returns for multiple events may give typical stock market response patterns. So, the standard abnormal returns associated with a specific period, 𝑁 days before and after the event day, gives us the following formula for average abnormal returns:
𝐴𝐴𝑅𝑖 = 1
𝑁∑ 𝐴𝑅𝑖𝑡 𝑁
𝑖=1
(10) After calculating the cumulative and average abnormal returns, we perform the CAARs (11). This measure is known to have significant statistical importance in addition to the AAR because it adds the cumulative effect on abnormal returns.:
CAAR = 1
𝑁∑ 𝐶𝐴𝑅𝑖 𝑁
𝑖=1
(11) The statistical tests considering these measures will be approached in the following section.
3.4 Test Statistics
The literature on event study test statistics is very rich, as is the range of significance tests. Generally, significance tests can be grouped in parametric and nonparametric tests. Parametric tests assume that an individual firm's abnormal returns are normally distributed, whereas nonparametric tests do not rely on such assumptions. In research, scholars commonly complement a parametric test with a nonparametric test to verify research findings (Schipper and Smith,1983). Table 1 – Description of hypothesis and parametric tests used on different levels of provides an overview of the hypothesis and test statistics that will be used in the study.
Null Hypothesis Parametric tests Test level 𝐻0: 𝐴𝑅 = 0
Hypothesis 1 𝐴𝑅 𝑡 𝑡𝑒𝑠𝑡 Individual Event
𝐻0: 𝐶𝐴𝑅 = 0
Hypothesis 2 𝐶𝐴𝑅 𝑡 𝑡𝑒𝑠𝑡 Multi-period Event
𝐻0: 𝐴𝐴𝑅 = 0 Hypothesis 3 𝐴𝐴𝑅 𝑡 𝑡𝑒𝑠𝑡 𝐴𝑑𝑗𝑢𝑠𝑡𝑒𝑑 𝐶𝑟𝑜𝑠𝑠 𝑠𝑒𝑐𝑡𝑖𝑜𝑛𝑎𝑙 𝑡𝑒𝑠𝑡 𝐴𝑑𝑗𝑢𝑠𝑡𝑒𝑑 𝑃𝑎𝑡𝑒𝑙𝑙 𝑡𝑒𝑠𝑡 𝑆𝑘𝑒𝑤𝑛𝑒𝑠𝑠 𝑐𝑜𝑟𝑟𝑒𝑐𝑡𝑒𝑑 𝑡𝑒𝑠𝑡 Multi-Event 𝐻0: 𝐶𝐴𝐴𝑅 = 0 Hypothesis 4 𝐴𝑑𝑗𝑢𝑠𝑡𝑒𝑑 𝐶𝑟𝑜𝑠𝑠 𝑠𝑒𝑐𝑡𝑖𝑜𝑛𝑎𝑙 𝑡𝑒𝑠𝑡 𝐴𝑑𝑗𝑢𝑠𝑡𝑒𝑑 𝑃𝑎𝑡𝑒𝑙𝑙 𝑡𝑒𝑠𝑡 𝑆𝑘𝑒𝑤𝑛𝑒𝑠𝑠 𝑐𝑜𝑟𝑟𝑒𝑐𝑡𝑒𝑑 𝑡𝑒𝑠𝑡
Multi-Period and Multi-Event
Parametric test statistics ground on the classic 𝑡 − 𝑡𝑒𝑠𝑡. On the other hand, further research on the area developed tests to correct the t-test's prediction error where the most widely used tests are the ones developed by Patell (1976) and Boehmer, Musumeci, and Poulsen (1991). As shown in Table 1, to accurately conclude on our model results and the sample significance, we will test, not only the AR and CAR t-test for each event but also, AAR and CAAR t tests. We are searching for market anomalies, thus the rejection of 𝐻0 confirms the presence of anomalies in the market. A rejection of the alternative hypothesis confirms otherwise. On the next subsection, all tests and hypotheses will be explained in detail.
The power of using test statistics is being able to accurately capture abnormal returns that differ from zero with some statistical validity. An informed choice of test statistic should be based on the research setting and the statistical issues that analyzed data holds. Specifically, event-date clustering poses a problem leading to cross-sectional correlation of abnormal returns, and distortions from event-induced volatility changes. Cross-sectional correlation arises when sample studies focus on events that happened for multiple firms at the same day(s). Therefore, these issues introduce a downward bias in the standard error of regression and thus overstates the t-statistic, leading to an over-rejection of the null hypothesis. To overcome this issue, several authors introduce new statistics parametric tests that will be reviewed on the next subsection.
3.4.1 Parametric Tests
Parametric tests assume that individual firm’s abnormal returns are normally distributed as in Campbell and Wasley (1993). The normality of abnormal returns is a key assumption underlying to use parametric tests for event studies. The parametric test used for this event study are the adjusted Patell (21), adjusted cross sectional test (28) and, skewness corrected test (31). As previously presented, to overcome the downward bias generated by the statistical issues that analyzed data holds, we decided to use the most known and used parametric test on the event study literature to correctly analyze the results.
Patell (1976) and Patell and Wolfson (1981) tried to overcome the t-test's proneness to event-induced volatility by standardizing the event window's ARs. The author used the dispersion of the estimation interval's ARs to limit the impact of stocks with high return standard deviations. However, the test too often rejects the true null hypothesis, particularly when samples are characterized by non-normal returns, low prices or little liquidity.
Moreover, the test has been found to still be affected by event-induced volatility changes, (Campbell and Wasley, 1993; Cowan, and Sergeant, 1996; and Kolari and Pynnone, 2010). Boehmer, Musumeci and Poulsen (1991) resolved this issue by developing a test statistic robust against volatility-changing events. Furthermore, the simulation study of Kolari and Pynnönen (2010) indicates an over-rejection of the null hypothesis, if cross-sectional correlation is ignored. Also. Kolari and Pynnonen (2010) developed an adjusted version for both test statistics that accounts for cross-sectional correlation. Details about these parametric tests can be found in the following descriptions.
𝑻𝟏: 𝑻 𝒕𝒆𝒔𝒕
Introduced by Gosset (1908), 𝑡 𝑡𝑒𝑠𝑡 (12) is the most used test on event study literature. In this test statistic, the mean excess return is divided by its estimated standard error of regression, which is estimated from the time-series of mean excess returns.
𝑡𝐴𝑅𝑖𝑡 = 𝐴𝑅𝑖𝑡 𝑆𝐴𝑅𝑖𝑡
, (12)
𝐴𝑅 𝑡 𝑡𝑒𝑠𝑡 is calculated under the null (Hypothesis 1). where 𝑆𝐴𝑅𝑖𝑡 (13) is the standard error of regression.4
𝑆𝐴𝑅2 𝑖 = 1 𝑀𝑖− 2 ∑ (𝐴𝑅𝑖𝑡) 2 𝑇1 𝑡=𝑇0 (13)
Second, we provide t statistics of the cumulative abnormal returns for each firm. 𝑡𝐶𝐴𝑅𝑖𝑡 = 𝐶𝐴𝑅𝑖𝑡
𝑆𝐶𝐴𝑅𝑖𝑡 (14)
𝐶𝐴𝑅 𝑡 𝑡𝑒𝑠𝑡 is calculated under the null (Hypothesis 2) where 𝑆𝐶𝐴𝑅𝑖𝑡 (15) is the standard error of regression.5
𝑆𝐶𝐴𝑅2 𝑖 = 𝐿2 𝑆𝐴𝑅2 𝑖 (15)
For the AARs, we calculate the 𝑡 𝑡𝑒𝑠𝑡 as below. 𝑡𝐴𝐴𝑅𝑖𝑡 =𝐴𝐴𝑅𝑖𝑡
𝑆𝐴𝐴𝑅𝑖𝑡 (16)
𝐴𝐴𝑅 𝑡 𝑡𝑒𝑠𝑡 is calculated under the null (Hypothesis 3)
where 𝑆𝐴𝐴𝑅𝑖𝑡 (17) is the standard error of regression across firms at time 𝑡. 𝑆𝐴𝐴𝑅2 𝑖 = 1 𝑁 − 1 ∑(𝐴𝑅𝑖𝑡− 𝐴𝐴𝑟𝑡) 2 𝑁 𝑖=1 (17) CAARs 𝑡 𝑡𝑒𝑠𝑡 is calculated on equation (18).
𝑡𝐶𝐴𝐴𝑅𝑖𝑡 =
𝐶𝐴𝐴𝑅𝑖𝑡
𝑆𝐶𝐴𝐴𝑅𝑖𝑡 (18)
where 𝑆𝐶𝐴𝐴𝑅𝑖𝑡 (19) is the standard error of regression of the cumulative abnormal returns across the sample.
The 𝑡 𝑡𝑒𝑠𝑡 has a major advantage, which is the simplicity of the calculations. However, it is prone to cross-sectional correlation and volatility changes (Brown and Warner, 1985). For this reason, further statistical test has to be added to the study to achieve accurate conclusions.
𝑻𝟐: 𝑨𝒅𝒋𝒖𝒔𝒕𝒆𝒅 𝑺𝒕𝒂𝒏𝒅𝒂𝒓𝒅𝒊𝒛𝒆𝒅 𝑹𝒆𝒔𝒊𝒅𝒖𝒂𝒍 𝒕𝒆𝒔𝒕 (𝑨𝒅𝒋𝒖𝒔𝒕𝒆𝒅 𝑷𝒂𝒕𝒕𝒆𝒍)
The standardized residual test also as known as Patell test, developed by Patell (1976), is one of the cross-sectional independence tests. The standardization (20) reduces the effect of stocks with large returns but assumes abnormal returns’ cross sectional and no event induced change in the variance, across the event period of abnormal returns.
SAR𝑖𝑡 = 𝐴𝑅𝑖𝑡 𝑆𝐴𝑅𝑖𝑡
(20) SAR𝑖𝑡 are Student’s t distributed with 𝑀𝑖− 2 degrees of freedom 6 under Hypothesis 3.
6 Degrees of freedom of an estimate is the number of independent pieces of information that went into calculating the estimate. In this case we will use 2, 𝑀𝑖− 2.
𝑆𝐶𝐴𝐴𝑅2 𝑖 = 1 𝑁 − 1 ∑(𝐴𝑅𝑖𝑡− 𝐴𝐴𝑟𝑡) 2 𝑁 𝑖=1 (19)
Boehmer et al. (1991) found that, under the absence of an event induced variance, this test is well specified and has appropriate power. Patell has been known to be immune to how ARs are distributed across the (cumulated) event window but has limitations that prone to cross-sectional correlation and event-induced volatility. Kolari and Pynnönen (2010) propose a modification to the Patell test to account for cross-correlation of the abnormal returns.
Using the standardized abnormal returns (20), the forecast-error corrected standard error of regression (25), and defining as the average of the sample cross-correlation of the estimation period abnormal returns, the adjusted Patell test for Hypothesis 3 is:
Where 𝐴𝑆𝐴𝑅𝑡 (22) is the sum over the sample of the standardized abnormal returns with standard error of regression (23), on Pattel test (24) .
𝐴𝑆𝐴𝑅𝑡= ∑ SAR𝑖𝑡 𝑁 𝑖=1 (22) 𝑆𝐴𝑆𝐴𝑅2 𝑡 = ∑𝑀𝑖− 2 𝑀𝑖− 4 𝑁 𝑖=1 (23) 𝑧𝑃𝑎𝑡𝑒𝑙𝑙,𝑡 = 𝐴𝑆𝐴𝑅𝑡 𝑆𝐴𝑆𝐴𝑅𝑡 (24) As event-window abnormal returns are an out-of-sample forecasts, 𝑆𝐴𝑅2 𝑖𝑡 is the adjusted standard error of regression by the forecast error:
𝑆𝐴𝑅2 𝑖𝑡 = 𝑆𝐴𝑅2 𝑡(1 + 1 𝑀𝑖 + (𝑟𝑚𝑡− 𝑟̅𝑚) 2 ∑𝑇𝑡=𝑇1 0(𝑟𝑚𝑡− 𝑟̅𝑚)2 ) (25)
For Hypothesis 4, see equations (41) to (44) (Appendix A).
In sum, adjusted Patell test improves Patell test by its immunity to cross sectional correlation. 𝑧𝑃𝑎𝑡𝑒𝑙𝑙,𝑡 = 𝑧𝑃𝑎𝑡𝑒𝑙𝑙,𝑡 √ 1
𝑻𝟑: 𝑨𝒅𝒋𝒖𝒔𝒕𝒆𝒅 𝑺𝒕𝒂𝒏𝒅𝒂𝒓𝒅𝒊𝒛𝒆𝒅 𝑪𝒓𝒐𝒔𝒔 𝑺𝒆𝒄𝒕𝒊𝒐𝒏𝒂𝒍 𝒕𝒆𝒔𝒕 (𝑨𝒅𝒋𝒖𝒔𝒕𝒆𝒅 𝑩𝑴𝑷 𝒕𝒆𝒔𝒕)
Harrington and Shrider (2007) found that, in a short horizon, we should always use tests that are robust against cross-sectional variation. They found that standardized cross-sectional test, for AAR (26) and CAAR (Equations (45) to (48), Appendix A) a good candidate for a robust parametric test in conventional event studies.
𝑧𝐵𝑀𝑃,𝑡 = 𝐴𝑆𝐴𝑅𝑡 √𝑁𝑆𝐴𝑆𝐴𝑅𝑡
(26) With 𝐴𝑆𝐴𝑅𝑡 defined as in equation (22) and with standard error of regression:
𝑆𝐴𝑆𝐴𝑅2 𝑡 = 1 𝑁 − 1∑ (𝑆𝐴𝑅𝑖,𝑡− 1 𝑁𝑆𝐴𝑅𝑖,𝑡) 2 𝑁 𝑖=1 (27) As for strengths, it presents immunity to the how ARs are distributed across the (cumulated) event window and accounts for event-induced volatility and serial correlation. As limitations, the test is prone to cross-sectional correlation. Kolari and Pynnönen (2010) propose a modification to the BMP test to account for cross-correlation of the abnormal returns. Using the standardized abnormal returns (𝑆𝐴𝑅𝑖,𝑡) and defining 𝑟̅ as the average of the sample cross-correlation for the estimation period abnormal returns, the adjusted BMP-test statistic for Hypothesis 3 is:
𝑧𝐵𝑀𝑃,𝑡 = 𝑧𝐵𝑀𝑃,𝑡 √ 1 − 𝑟̅
1 + (𝑁 − 1) 𝑟̅ (28)
As for strengths, the test is immune to how AR are distributed across the event window and it accounts for event induced volatility, serial correlation, and cross-correlation.
𝑻𝟒: 𝑺𝒌𝒆𝒘𝒏𝒆𝒔𝒔 𝑪𝒐𝒓𝒓𝒆𝒄𝒕𝒆𝒅 𝑻𝒆𝒔𝒕
The skewness-adjusted t-test, introduced by Hall (1992), corrects the cross-sectional 𝑡 𝑡𝑒𝑠𝑡 for
skewed abnormal return distribution. This test is applicable for averaged abnormal return (Hypothesis 3) and the cumulative averaged abnormal return (Hypothesis 4). The cross-sectional
standard error of regression (unbiased by sample size) for the CAARs follow:
𝑆𝐶𝐴𝐴𝑅2 = 1 𝑁 − 1∑(𝐶𝐴𝑅𝑖− 𝐶𝐴𝐴𝑅) 2 𝑁 𝑖=1 (29)
And the skewness estimation (unbiased by sample size) is given by: γ = 𝑁 (𝑁 − 2)(𝑁 − 1)∑(𝐶𝐴𝑅𝑖− 𝐶𝐴𝐴𝑅)3𝑆𝐶𝐴𝐴𝑅−3 𝑁 𝑖=1 (30) Then, the skewness adjusted test statistic for CAAR is given by
𝑡𝑠𝑘𝑒𝑤 = √𝑛 (𝑆 +1 3γ𝑆 2+ 1 27γ 2𝑆3 + 1 6𝑁γ) (31) Where S is equal to 𝐶𝐴𝐴𝑅
𝑆𝐶𝐴𝐴𝑅 , which is asymptotically standard normal distributed.
The literature on skewness correct-test is presented by Hall (1992), Cramer (1961) and Rimoldini (2013). The aim in using this test is to correct-test statistics for skewed distributions. All tests will be analyzed at 5% and 10% levels of significance. Results related to the test statistics presented in this subsection will be shown and analyzed in the next section.
3.5 Market Expectations and Earnings Surprise
To what concerns the importance of market expectations, Fried and Givoly (1982) measured the performance of an alternative, knowing from their previous study that analysts’ forecasts results are not accurate. Prediction errors are more associated with the price asset movement and, consequently, Fired and Givoly (1982: 85) were able to conclude that “analysts’ forecasts provide
a better surrogate for market expectations than forecasts generated by time-series models”.
The main reason for time series models to be presented as an alternative to market expectations is not reliable, because it is further impaired by the underlying assumptions that earnings-generating processes are stationary alongside stable parameters. Also, the model characteristics are applied to all firms involved. In the literature, there are distinguishable views to apply EPS surprises methods, some are used for time series models while others used for analysts’ forecasts.
We will rely and follow the methods provided by Yan and Zhao (2011) based on the analyst forecasts. The formula they used can be translated as the difference between the reported EPS and expected EPS, divided by the absolute value of the expected EPS:
Earnings Surpise𝑖𝑞 = 𝑅𝑒𝑝𝑜𝑟𝑡𝑒𝑑 𝐸𝑃𝑆𝑖𝑞− 𝐸𝑥𝑝𝑒𝑐𝑡𝑒𝑑 𝐸𝑃𝑆𝑖𝑞
Where, 𝑅𝑒𝑝𝑜𝑟𝑡𝑒𝑑 𝐸𝑃𝑆𝑖𝑞is the actual 𝐸𝑃𝑆 announced on the earnings announcement date for firms 𝑖 in quarter 𝑞, and the 𝐸𝑥𝑝𝑒𝑐𝑡𝑒𝑑 𝐸𝑃𝑆𝑖𝑞 is the mean analyst forecast of 𝐸𝑃𝑆. All divided by the absolute value of the 𝐸𝑥𝑝𝑒𝑐𝑡𝑒𝑑 𝐸𝑃𝑆𝑖𝑞.
To analyze if the results are somehow correlated with market surprise towards the announcement report, we will calculate the AAR assuming three scenarios (33), (34) and (35).
Data will be collected on Yahoo Finance and equations for calculations will be as follows:
1) 𝑅𝑒𝑝𝑜𝑟𝑡𝑒𝑑 𝐸𝑃𝑆𝑖𝑞 − 𝐸𝑥𝑝𝑒𝑐𝑡𝑒𝑑 𝐸𝑃𝑆𝑖𝑞 |𝐸𝑥𝑝𝑒𝑐𝑡𝑒𝑑 𝐸𝑃𝑆𝑖𝑞| > 5% → 𝐺𝑜𝑜𝑑 𝑁𝑒𝑤𝑠 (33) 2) 𝑅𝑒𝑝𝑜𝑟𝑡𝑒𝑑 𝐸𝑃𝑆𝑖𝑞− 𝐸𝑥𝑝𝑒𝑐𝑡𝑒𝑑 𝐸𝑃𝑆𝑖𝑞 |𝐸𝑥𝑝𝑒𝑐𝑡𝑒𝑑 𝐸𝑃𝑆𝑖𝑞| < 5% → 𝐵𝑎𝑑 𝑛𝑒𝑤𝑠 (34) 3) −5% < 𝑅𝑒𝑝𝑜𝑟𝑡𝑒𝑑 𝐸𝑃𝑆𝑖𝑞 − 𝐸𝑥𝑝𝑒𝑐𝑡𝑒𝑑 𝐸𝑃𝑆𝑖𝑞 |𝐸𝑥𝑝𝑒𝑐𝑡𝑒𝑑 𝐸𝑃𝑆𝑖𝑞| < 5% → 𝑁𝑜 𝑛𝑒𝑤𝑠 (35) Also, we will test if the ARs are correlated with Earnings surprise by using Pearson correlation coefficient, formula shown below:
𝑟𝑥𝑦= ∑ 𝑥𝑖𝑦𝑖− 𝑛𝑥̅𝑦̅ (𝑛 − 1)𝑠𝑥𝑠𝑦
(36) Where 𝑛 is the sample size, 𝑥𝑖 and 𝑦𝑖 the individual sample points, 𝑥̅ the sample mean and 𝑠𝑥 the sample standard error of regression.
Authors, as Jegadeesh and Livnat (2006) find that the post-earnings drift may not be so strong because it is very difficult to confirm future information to the original earnings surprise. Others, as Kinney et al. (2002) claim that earnings surprise is not a good indicator for market reactions on earnings announcement. In the present study, our goal is test if the AAR are sensible to market surprises and also test whether or not a linear or inverse relationship between Earnings Surprise and AR exists. On section 4, we will explain the results in detail.