Gut evacuation rates in Nephrops norvegicus (L., 1758): laboratory and field estimates
6
0
0
Texto
(2) Atlantic and Mediterranean Sea (Udekem d’Acoz, 1999), based on field and laboratory observations, and to compare the results obtained by the two techniques. MATERIAL AND METHODS Field study Norway lobsters, N. norvegicus, were collected off the south coast of Portugal, from a single trawl operation conducted from a commercial boat during July 1998 on fishing grounds at an average depth of 600 m, in the vicinity of 36°51’N and 7°43’E. This was a short, two-hour trawl in order to guarantee the maximum survival rate of the lobsters. Immediately after capture, a first batch of 10 randomly selected individuals, consisting of both males and females (Table 1), were killed by immersion in 10% buffered formalin. These were considered time 0 (T0) individuals. The remaining individuals were divided into 5 similar groups of 10 (Table 1) and placed in five insulated 60 l boxes with a lid and filled with sea water to minimise temperature changes. The boxes were kept on deck. The sea water temperature was lowered and maintained at 14ºC for the duration of the experiment, representing the average temperature at the depth of capture (Ambar, 1983). This relatively low temperature was achieved by means of ice packs to avoid any salinity change, and the water was aerated by means of aquarium pumps powered by AA batteries. At time intervals of 1, 2, 3.5, 5 and 7 hours one group of 10 individuals were sacrificed by immersion in 10% buffered formalin (“serial slaughter method”; Windell, 1967) (Thorpe, 1977; Héroux and Magnan, 1996); 48 hours later, in the laboratory, they were transfered into 70º ethyl-alcohol. The biological sampling analysis included carapace TABLE 1. – Nephrops norvegicus. Field study experiment: characteristics of Norway lobster groups; Ti , group slaughtered at time I; Sex ratio, male/female; CL, carapace length; s e, standard error.. length measurements (to the nearest 0.01 mm), sex determination and stomach removal (preserved in 70º alcohol). Each of the 60 stomachs collected was cut open under a stereomicroscope. The content was then dispersed in distilled water and filtered through a predried and weighed Whatman-GF/C glass microfibre filter, using a vacuum pump system. The filters with the stomach contents were then dried for 48 hours at 60ºC. The stomach content weights were calculated by subtraction of the filter dry weights (to the nearest 0.0001 g). The trophic spectrum is dominated by decapod crustaceans, euphausids, peracarids and fish remains, and does not differ seasonally (Cristo, 1998). Laboratory experiments The Norway lobsters used in this experiment were also caught with bottom trawling off the south coast of Portugal during December 1997 at depths of about 600 m, in the vicinity of 36°50’N and 7°43’E. All the individuals were maintained in a closed sea water system (Encarnação et al, 2000), with a temperature of 14ºC, salinity of 37‰, pH of 8, and constant levels of nitrites and ammonia (<0.2 mg/l). The acclimatisation period took several weeks, during which the lobsters were fed with shrimp, fish and pelleted food. In January 1998, the lobsters were measured (carapace length to the nearest 0.01mm), weighed (to 0.01g) and sexed. The specimens were assigned to one of 7 groups of 10 individuals, making sure that all groups had similar size ranges (Table 2). Each individual was kept in its own individual plastic compartment, with water flowing and circulating over all the compartments. Before the experiment was carried out, the lobsters were starved for 8 days. The specific diet choTABLE 2. – Nephrops norvegicus. Laboratory experiment: characteristics of Norway lobster groups. Ti , group slaughtered at time i; sex ratio, male/female; CL, carapace length; s e, standard error. Groups. Groups T0 T1 T2 T3.5 T5 T7. Sex ratio. CL range (mm). Mean CL (mm). se. 4/6 6/4 4/6 4/6 5/5 6/4. 32.81 - 48.93 31.86 - 46.91 29.81 - 50.08 32.15 - 46.64 31.28 - 49.36 28.46 - 46.50. 37.15 39.72 37.69 39.95 39.06 38.18. 1.49 1.94 1.63 1.53 2.19 1.17. 342 M. CRISTO. T0 T0.5 T1 T2 T3.5 T5 T7. Sex ratio 9/1 6/4 7/3 9/1 7/3 9/1 5/4. CL range (mm) Mean CL (mm) 26.20 - 42.92 27.09 - 42.41 27.88 - 43.96 27.92 - 43.14 28.30 - 44.10 28.50 - 44.16 29.03 - 47.67. 35.16 35.97 36.47 36.30 37.07 37.84 38.55. se 1.76 1.60 1.61 1.52 1.54 1.54 1.86.
(3) sen was a small shrimp of the family Crangonidae Palaemonetes varians. This material was chosen considering that crustaceans are the main source of food for Nephrops norvegicus (Cristo, 1998; Cristo and Cartes, 1998) and one of the preferred preys in laboratory experiments (Cristo and Encarnação, 2000). In addition, P. varians is very easy to collect, and therefore the experiment could be based on freshly caught food. Approximately 2 g of fresh whole shrimp was given to each lobster. The relationship between shrimp dry weight (DW g) and shrimp wet weight (WW g) was determined by linear regression:. Pearcy, 1987; Andrade et al, 1996) and crustaceans (Hill, 1976; Sardá and Valladares, 1990). Following Elliott (1972): Wt = W0 e-Rt. where W0 is the stomach content weight at the beginning of the time interval (T0), Wt is the stomach content weight at time t, and R is the instantaneous evacuation rate. Wt can also be expressed as percentage of the initial food ingested, where Wt = W of stomach content x 100 W0. 2. DW (g) = 0.25475 WW (g) - 0.00791 (n = 32, r = 0.959). (2). or for the laboratory study Wt =. W of stomach content (W of food supplied – W of food uneaten) Correction factor. x 100 (3). RESULTS AND DISCUSSION In field studies, since we have no possibility for determining the amount of food in the stomach of the individuals without sacrificing them, we have to assume that the mean stomach content of all the individuls used in the experiment is comparable to the sample taken at time T0. The serial analysis of the mean dry weight stomach content showed a continous decrease over the duration of the experiment (Fig. 1). After 7 hours only aproximately 30% of the initial content remained in the stomach (Fig. 2). 0.16 Y = 0.1101 e-0.177 x R2 = 0.943. 0.14 0.12 0.10. Wt (g). As most of the lobsters feed avidly, 15 minutes after the shrimp had been supplied all the uneaten shrimp was removed from each compartment and stored separately prior to drying (at 60ºC for 48 hours) and weighing (to the nearest 0.0001 g). At this time, the first group of 10 individuals was sacrificed (in 10% buffered formalin) and this was considered the time 0 (T0) group. The “serial slaughter method” was used at time intervals of 0.5, 1, 2, 3, 5 and 7 hours (Hill, 1976; Joll, 1982; Amundsen and Klemetsen, 1988; Sardá and Valladares, 1990). The method for accurately determining the stomach content dry-weight was the same as described for above the field study. The amount of dry food ingested was determined by the difference between the calculated dry food supplied and the dry food removed from the boxes, a value usually greater than the amount of food that really reaches the stomach (Dagg, 1974; Hill, 1976), due to the loss of body fluids and small particles produced during the process of mastication. Therefore, the percentage of loss was determined by the analysis of the stomach content in the T0 individuals. This correction factor (CF) was applied to all individual ingested food values. In both trials, the analysis was carried out using the mean values of stomach contents in each batch (n=10). Standard errors were estimated. The exponential model was used to describe the relation between food evacuation and time and for the determination of the instantaneous evacuation rate (R). This model is more appropriate for describing the evacuation of small, relatively easily digested particles from the stomach (Jobling, 1986), which is the case of Nephrops norvegicus. This approach has been widely use both in fish (Persson, 1986, Brodeur and. (1). 0.08 0.06 0.04 0.02 0.00 0. 1. 2. 3. 4. 5. 6. 7. Hours FIG. 1 – Field study. Exponential curve of decrease in the mean stomach contents (g) and standard errors over time in Nephrops norvegicus. GUT EVACUATION RATES IN NEPHROPS NORVEGICUS 343.
(4) 100 Y = 99.839 e-0.177 x R2 = 0.942. 90 80 70. % Wt. 60 50 40 30 20 10 0 0. 1. 2. 3. 4. 5. 6. 7. Hours FIG. 2 – Field study. Exponential curve of the percentage of the mean stomach contents as a function of the initial content over time in Nephrops norvegicus.. The estimated instantaneous evacuation rate obtained was R = 0.177 h-1, either using the approach of Equation 1 or Equation 2, In the laboratory experiment, it was estimated that only 52% of the food ingested actually reached the stomach. The correction factor, CF = 0.52 was applied to all individual ingested food values in Equation 3. The results from laboratory experiments are presented in Figures 3 and 4. The amount of food actually consumed was accurately determined for each group slaughtered.. The estimated instantaneous evacuation rate obtained was R = 0.172 h-1, either using the approach of Equation 1 or Equation 3. The instantaneous evacuation rate has often been estimated for fish through laboratory experiments (Brodeur and Pearcy, 1987; Amundsen and Klemetsen, 1988; Parrish and Margraf, 1990; Andrade et al, 1996). Though this laboratory methodology has been widely applied to marine invertebrates such as copepods, amphipods or euphausids (Kiørboe and Tiselius, 1987; Clarke et al, 1988; Dam and Peterson,1988; Perissinotto and Pakhomov, 1996), there have only been a few attemps to apply this methodology to decapod crustaceans (Hill, 1976; Joll, 1982; Sardá and Valladares, 1990). This method assumes that laboratory conditions, starvation before feeding, and lack of prey diversity may have a limited effect on the evacuation rate (Héroux and Magnan, 1996). According to the same authors, one advantage of this method is that individuals are presumed to be unstressed after acclimatisation and during the experience; it is also possible to control the quantity of food ingested by each individual. Determination of R using field experiments has also been carried out for fish (Garcia and Adelman, 1985; Boisclair and Leggett, 1988; Parrish and Margraf, 1990; Héroux and Magnan, 1996). However, in crustaceans, in situ experiments have been limited to non-decapods such as copepods (Kiørboe and Tiselius, 1987; Dam and Peterson,1988), amphipods (Pakhomov and Perissinotto, 1996) or euphausids 100. 0.16. Y = 97.379e-0.172x R2 = 0.934. -0.1 72 x. Y = 0.1292e R2 = 0.934. 0.14. 80. 60. 0.10. % Wt. Wt (g). 0.12. 0.08. 40. 0.06 20. 0.04 0. 0.02 0. 1. 2. 3. 4. 5. 6. 7. Hours FIG. 3 – Laboratory experiment. Exponential curve of decrease in the mean stomach contents (g) and standard errors over time in Nephrops norvegicus.. 344 M. CRISTO. 0. 1. 2. 3. 4. 5. 6. 7. Hours FIG. 4 – Laboratory experiment. Exponential curve of the percentage of the mean stomach contents as a function of the initial content over time in Nephrops norvegicus..
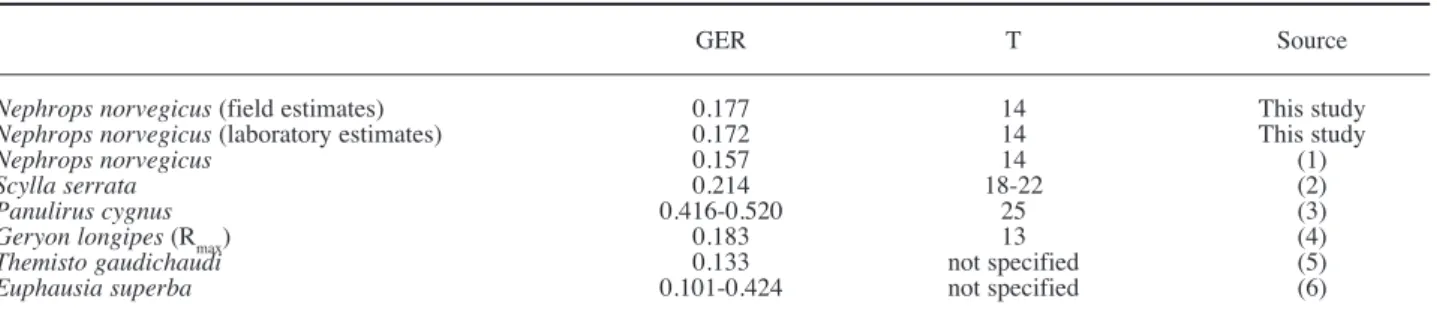
(5) TABLE 3. – Nephrops norvegicus. Comparison of gut evacuation rates for different crustacean species (GER) (h-1). Temperature, T(ºC). Sources: (1), recalculated from Sardá and Valladares, 1990; (2), Hill, 1976; (3), recalculated from Joll, 1982; (4), Maynou and Cartes 1998; (5), Pakhomov and Perissinotto 1996; (6), Perissinotto and Pakhomov, 1996.. Nephrops norvegicus (field estimates) Nephrops norvegicus (laboratory estimates) Nephrops norvegicus Scylla serrata Panulirus cygnus Geryon longipes (Rmax) Themisto gaudichaudi Euphausia superba. GER. T. Source. 0.177 0.172 0.157 0.214 0.416-0.520 0.183 0.133 0.101-0.424. 14 14 14 18-22 25 13 not specified not specified. This study This study (1) (2) (3) (4) (5) (6). (Clarke et al, 1988; Perissinotto and Pakhomov, 1996). An alternative method for estimating R is based on the Rmax procedure (Héroux and Magnan, 1996; Maynou and Cartes, 1998). In field studies it is assumed that the stress due to capture and holding may have negligible effects on the evacuation rate. This method has the advantage of integrating all field conditions, natural prey diversity, and evacuation rate without any forced starvation period (Héroux and Magnan, 1996). According to Elliott (1972) and Irigoien (1998) the initial gut content should not significantly affect the evacuation rate, with temperature being the limiting factor. Other authors (Jobling and Davies, 1979; Dam and Peterson, 1988) also concluded that temperature was the most important factor affecting evacuation rate, and since this parameter was maintained constant throughout both the experiments, the instantaneous evacuation rate should be similar. The R values estimated from laboratory experiments R = 0.172 h-1 and field experiments R = 0.177 h-1 are practically identical, suggesting that these are realistic values for the temperature considered (14ºC) (Elliott, 1972). In fact, both values must be considered as instantaneous evacuation rates for diets based on crustaceans, since for softer prey species this value can be higher (Sardà and Valladares, 1990) Table 3 summarises gut evacuation rates calculated in previous published data for several different crustacean species. The results obtained in this study for both experiments are very similar, and are within the range of the values in the literature, even when different methodologies were used (i.e. Rmax of Maynou and Cartes, 1998). From data collected in previously published studies on fish, Worobec (1984) and Pakhomov et al. (1996) established equations relating temperature T with gut evacuation rates R; For T = 14ºC, the same temperature at which these experiments were. conducted, both Worobec’s linear model (1984) and the power relation of Pakhomov et al. (1996) give R = 0.20 h-1. ACKNOWLEDGEMENTS The author expresses her gratitude to Prof. Margarida Castro for her critical reading of the manuscript and help in statistical treatments and to Prof. Karim Erzini for the English corrections. This study was partially funded by the PRODEP 5.2 programme. REFERENCES Ambar, I. – 1983. A shallow core of Mediterranean water off western Portugal. Deep-sea Res. 30: 677-680. Amundsen, P.A. and A. Klemetsen. – 1988. Diet, gastric evacuation rates and food consumption in a stunted population of Artic charr Salvelinus alpinus L., in Takvatn, northern Norway. J. Fish Biol. 33: 697-709. Andrade, J.P., K. Erzini and J. Palma. – 1996. Gastric evacuation and feeding in the gilthead sea bream reared under semi-intensive conditions. Aquac. Intern. 4: 129-141. Boisclair, D. and W.C. Leggett. – 1988. In situ experimental evaluation of the Elliott and Persson and the Eggers models for estimating fish daily ration. Can. J. Fish. Aquat. Sci. 45: 138-145. Brodeur, R.D. – 1984. Gastric evacuation rates for two foods in the black rockfish Sebastes melanops Girard. J. Fish Biol. 24: 287298. Brodeur, R.D. and W.C. Pearcy. – 1987. Diel feeding chronology, gastric evacuation and estimated daily ration of juvenil coho salmon, Oncorhynchus kisutch (Walbaum), in the coastal marine environment. J. Fish Biol. 31: 465-477. Bromley, P.J. – 1987. The effects of food type, meal size and body weight on digestion and gastric evacuation in turbot, Scophthalmus maximus L.. J. Fish Biol. 30: 501-512 Clarke, A., L.B. Quetin and R.M. Ross. – 1988. Laboratory and field estimates of the rate of faecal pellet prodution by Antarctic krill, Euphausia superba. Mar. Biol. 98: 557-563. Cristo, M. – 1998. Feeding ecology of Nephrops norvegicus (Decapoda: Nephropidae). J. Nat. Hist. 32: 1493-1498. Cristo, M. and J. E. Cartes. – 1998. A comparative study of the feeding ecology of Nephrops norvegicus (L.), (Decapoda: Nephropidae) in the bathyal Mediterranean and the adjacent Atlantic. Sci. Mar. 62: 81-90. Cristo, M. and P. Encarnação. – 2000. Laboratory estimates of the daily ration of the Norway lobster Nephrops norvegicus (L.) (Decapoda) from the southern coast of Portugal. Crustacean Issues 12: 698-695. GUT EVACUATION RATES IN NEPHROPS NORVEGICUS 345.
(6) Dagg, M.J. – 1974. Loss of prey body contents during feeding by an aquatic predator. Ecology 55: 903-906. Dam, H.G. and W.T. Peterson. – 1988. The effect of temperature on the gut clearance rate constant of planktonic copepods. J. Exp. Mar. Biol. Ecol. 123: 1-14. Elliott, J.M. – 1972. Rates of gastric evacuation in brown trout, Salmo trutta L. Freshwat. Biol. 2: 1-18. Encarnação, P., J. Reis and M. Castro. – 2000. A closed sea water system for experimental trials with the Norway lobster, Nephrops norvegicus. . Crustacean Issues 12: 697-700. Garcia, L.M. and I.R. Adelman. – 1985. An in situ estimate of daily food consumption and alimentary canal evacuation rates of common carp, Cyprinus carpio L. J. Fish Biol. 27: 487-493. Héroux, D. and P. Magnan. – 1996. In situ determination of daily ration in fish: review and field evaluation. Environ. Biol. Fish. 46: 61-74. Hill, B.J. – 1976. Natural food, foregut clearance-rate and activity of the crab Scylla serrata. Mar. Biol. 34: 109-116. Irigoien, X. – 1998. Gut clearance rate constant, temperature and inicial gut contents: a review. J. Plankton Res. 20: 997-1003. Jobling, M. – 1980a. Gastric evacuation in plaice, Pleuronectes platessa L.: effects of dietary energy level and food composition. J. Fish Biol. 17: 187-196. Jobling, M. – 1980b. Gastric evacuation in plaice, Pleuronectes platessa L.: effects of temperature and food size. J. Fish Biol. 17: 547-551. Jobling, M. – 1986. Mythical models of gastric and implications for food consumption studies. Environ. Biol. Fish. 16: 35-50. Jobling, M. and P.S. Davies. – 1979. Gastric evacuation in plaice, Pleuronectes platessa L.: effects of temperature and meal size. J. Fish Biol. 14: 539-546. Joll, L.M. – 1982. Foregut evacuation of four foods by the western rock lobster, Panulirus cygnus, in aquaria. Aust. J. Freshwater Res. 33: 939-943. Kiørboe, T. and P.T. Tiselius. – 1987. Gut clearance and pigment destruction in a herbivorous copepod, Acartia tonsa and the determination of in situ grazing rates. J. Plankton. Res. 9: 525-534. Maynou, F. and J.E. Cartes. – 1997. Field estimation of daily ration in deep-sea shrimp Aristeus antennatus (Crustacea: Decapoda) in the western Mediterranean. Mar. Ecol. Prog. Ser. 153: 191-196. Maynou, F. and J.E. Cartes. – 1998. Daily ration estimates and comparative study of food consumption in nine species of deep-. 346 M. CRISTO. water decapod crustaceans of the NW Mediterranean. Mar. Ecol. Prog. Ser. 171: 221-231. Murtaugh, P.A. – 1984. Variable gut residence time: problems in inferring feeding rate from stomach fullness of a mysid crustacean. Can. J. Fish. Aquatic. Sci. 41: 1287-1293. Pakhomov, E.A. and R. Perissinotto. – 1996. Trophodynamics of the hyperiid amphipod Themisto gaudichaudi in the South Georgia region during late austral summer. Mar. Ecol. Prog. Ser. : 91-100. Pakhomov, E.A., R. Perissinotto and C.D. McQuaid. – 1996. Prey composition and daily rations of myctophid fishes in the Southern Ocean. Mar. Ecol. Prog. Ser. 134: 1-14. Parrish, D.L. and F.J. Margraf. – 1990. Gastric evacuation rates of white perch, Morone americana, determined from laboratory and field data. Environ. Biol. Fish. 29: 155-158. Perissinotto, R. and E.A. Pakhomov. – 1996. Gut evacuation rates and pigment destruction in the Antarctic krill Euphausia superba. Mar. Biol. 125: 47-54. Persson, L. – 1979. The effects of temperature and differeent food organisms on the rate of gastric evacuation in perch (Perca fluviatilis). Freshw. Biol. 9: 99-104. Persson, L. – 1986. Patterns of food evacuation in fishes: a critical review. Environ. Biol. Fish. 16: 51-58. Sardà, F. and F.J. Valladares. – 1990. Gastric evacuation of different foods by Nephrops norvegicus (Crustacea:Decapoda) and estimation of soft tissue ingested, maximum food intake and cannibalism in captivity. Mar. Biol. 104: 25-30. Thorpe, J.E. – 1977. Daily ration of adult perch, Perca fluviatilis L. during summer in Loch Leven, Scotland. J. Fish Biol. 11: 55-68. Udekem d’Acoz, C. d’ – Inventaire et distribution des crustacés décapodes de l’Atlantique nord-oriental, de la Méditerranée et des eaux continentales adjacentes au nord de 25º N. Patrimoines naturels (M. N. H. N./S. P. N.), 40: 383 p. Windell, J.T. – 1967. Rates of digestion in fishes. In: S.D. Gerking, (ed.), The Biological Bases of Freshwater Fish Production, pp. 151-173. Blackwell Scientific Publications, Oxford. Worobec, M.N. – 1984. Field estimates of the daily ration of winter flounder, Pseudopleuronectes americanus (Walbaum), in the Southern New England salt pond. J. Exp Mar. Biol Ecol. 77: 183-196. Scient. ed.: F. Sardà.
(7)
Imagem
Documentos relacionados
Para o alívio da gengivite que normalmente acontece nas crianças quando ocorre a erupção dos primeiros dentes, pode ser útil os pais massajarem levemente a gengiva da
Tal configuração torna os elétrons 4f íons livres portadores de momento angular total J devido à interação entre os momentos orbital L e de spin S,
O Acórdão em questão trata da investigação de factos vinculados à prática de dois crimes de homicídio qualificado. Haviam sido colhidos no local do crime “vestígios
A dimensão investigativa deste relatório de Prática Pedagógica do Mestrado de Educação Pré-Escolar e Ensino do 1.º Ciclo do Ensino Básico procura abordar as ideias que alunos
Descobri que o nome “armorial” servia, ainda, para qualificar os “cantares” do Romanceiro, os toques de viola e rabeca dos cantadores – toques ásperos,
The description of immature stages was based on specimens reared in laboratory, and data of natural history and behavior were observed both in laboratory and in the field on its
Para além disto destaca-se facilmente o empenho e dedicação que Botelho de Sousa tem no estudo das temáticas de interesse para Marinha, assim como a vontade de mostrar o que
A Técnica de Intervenção Precoce, numa fase anterior à exploração do método de leitura, tinha uma opinião diversificada, pelo facto de considerar o mesmo, uma estratégia
