LABORATORY CONDITIONS
RESGALLA JR., C.1, BRASIL, E. S.1 and SALOMÃO, L. C.2 1CTTMar/uNIVALI, C. P. 360, CEP 88302-202, Itajaí, SC, Brazil
2Instituto de Biociências, uSP, São Paulo, Brazil
Correspondence to: Charrid Resgalla Jr., CTTMar/uNIVALI, C. P. 360, CEP 88302-202, Itajaí, SC, Brazil, e-mail: [email protected]
Received August 9, 2004 – Accepted November 8, 2004 – Distributed February 28, 2006 (With 5 figures)
ABSTRACT
Physiological studies of the mussel Perna perna in Brazil are almost 30 years behind those of other,
more exhaustively investigated species, such as Mytilus edulis. Little is known about the variations in
physiological rates due to size and the consequences of maintaining P. perna in laboratory conditions.
This work investigated the variations in respiration, clearance, excretion and absorption efficiency rates of P. perna, classified by size and acclimatized in a laboratory, monitoring the mussels’ respiration rates and biometry over a period of 30 days, in laboratory conditions. The respiration, clearance and excretion rates presented an allometric relation with the dry weight of the organisms, with b values of 0.66, 0.48 and 0.91 respectively. On the other hand, these same rates, when considered by weight (specific rates) showed a relationship that was inverse to the size of the organisms. Only the absorption efficiency was independent of the weight of the mussel. In terms of acclimatization, it was observed that it takes 10 days
for the respiration rate of the mussel P. perna to stabilize in laboratory conditions, after which it follows a
routine metabolism.
Keywords: Perna perna, physiology, acclimatization, respiration, clearance, excretion, absorption
efficiency.
RESUMO
Taxas fisiológicas do mexilhão Perna perna (Linnaeus, 1758) em diferentes classes de tamanho e condições de manutenção em laboratório
O estudo da fisiologia dos mexilhões Perna perna no Brasil apresenta uma defasagem de aproximadamente
30 anos em relação a outras espécies mais exaustivamente investigadas como Mytilus edulis. O conhecimento
acerca das variações das taxas fisiológicas em função do tamanho e as conseqüências da manutenção de
P. perna em laboratório foram pouco estudadas. Neste trabalho, investigaram-se as variações das taxas de
respiração, clareamento, excreção e a eficiência de absorção de P. perna aclimatados em laboratório em
diferentes classes de tamanho, assim como foi realizado um acompanhamento de suas taxas respiratórias e de sua biometria ao longo de 30 dias de manutenção em condições laboratoriais. As taxas de respiração, clareamento e excreção apresentaram uma relação alométrica com o peso seco dos organismos, obtendo-se como valores de b de 0,66, 0,48 e 0,91 respectivamente. Por outro lado, estas mesmas taxas quando ponderadas pelo peso (taxas específicas) mostraram uma relação inversa com o tamanho dos organismos. A eficiência de absorção foi à única taxa que mostrou independência com o peso do mexilhão. Em termos
de aclimatação, observou-se que o mexilhão P. perna leva 10 dias para estabilizar a sua taxa de respiração
em laboratório, entrando em metabolismo de rotina.
INTRODUCTION
There are two points to consider in studies on the physiological rates of mussels, whether these are related to the understanding of their production, or to the analysis of environmental impacts. The first point relates to the influence of the size (weight) of the organisms on the variability of their physiological responses. The second relates to the minimum conditions necessary to maintain these organisms in a laboratory, where the intention is to determine the different environmental variables.
Studies on the variability of physiological rates of mussels due to size have already been
carried out, mainly on Mytilus edulis and have been
presented in various reviews on the subject (Bayne & Newell, 1983; Griffiths & Griffiths, 1987). This endogenous variability is considered a basic feature in metabolic studies, since it presents an allometric relation with the physiological parameters, and its factor of variance is used to assess the rates when the purpose is to compare organisms of similar
size, but which have different weights (Bayne et al.,
1985).
On the other hand, the maintenance of mussels in a laboratory is carried out as a process of acclimation the organisms under certain experimental conditions
(e.g. temperature, salinity and food). However, these
laboratory conditions, under constant temperature and low food availability, can alter the physiology of these organisms (Bayne & Thompson, 1970). But even under these constant conditions, it is possible
to study the type of metabolism (e.g. standard
metabolism, routine metabolism and metabolism of activity) and based on this, to interpret the metabolic behavior under different conditions of interest. In these studies, the rates of oxygen consumption (respiration rate) are normally used as a parameter which is directly related to the metabolic state of the animal (Bayne, 1973a).
This work investigated the variations in physiological rates of different sizes of the mussel
Perna perna, acclimated in a laboratory, and also the minimum conditions for its acclimation under controlled conditions, as well as the type of metabolism achieved.
MATERIAL AND METHODS
Samples of the mussel Perna perna were
obtained from the mariculture experimental center
of CTTMar, in the Armação do Itapocoroi Bay (town of Penha, Santa Catarina, Brazil), where they were cleaned and selected according to size (from 3.0 to 6.0 cm) and number for each mantenance. Groups
denominated T0 with an average size of 44 mm,
were frozen for subsequent determination of the initial data relating to total length and average dry weight. These values were used to estimate growth during the acclimatization experiment.
The standard maintenance of the mussels consisted of acclimatizing the organisms at 30‰ salinity and a laboratory temperature of
20 ± 2 °C. Groups of 20 organisms were kept
in four-liter flasks, with aeration and constant photoperiod (12 hour light and 12 hour dark). Mussels larger than 5 cm were maintained at a density of 10 organisms per flask. Two liters of the maintenance water were renewed daily, and the food inoculated (monospecific non-axenic
phytoplankton culture Chaetocerus gracilis), at a
concentration of 500 cells/µL-1.
The phytoplankton species used for the maintenance of the mussels and the tests for clearance and absorption efficiency rates was selected due to:
• its ease of maintenance and the fact that it can be obtained in high densities in laboratory cultures, using the Conway culture media; • its high percentage of organic matter, varying
from 65% to 72% depending on the phase of growth of the culture;
• the fact that its size is compatible with the retention capacity of the gills of the mussels.
Chaetocerus gracilis varies in size from 5
to 6.5 µm (central body) with setae of up to
17.5 µm. This size enables 100% retention
capacity by the gills of Perna perna, which
present a space between the cilia of 2.5 to 3 µm in the gill filaments; and
• the ratio between its density and absorbance in spectrophotometer with a 10-cm light path cuvette, according to the following equations: For 750 nm (turbidity – high concen-trations):
Y = 6 x 10⁻⁷ X
For 230 nm (peak of absorbance – low concentrations):
where: Y = Absorbance; X = Cells per liter
(N.Cells/L-1).
The density of phytoplankton offered as food represented a quantity of 2.1 mg of organic matter.
animal-1.day-1 for organisms smaller than 5 cm, and
4.2 mg of organic matter. animal-1.day-1 for mussels
larger than 5 cm. These values are the result of the ratio between the number of cells and its weight, which is:
Y = 3 x 10⁻⁸ X
where: Y = Dry weight (mg.L-1); X = Cells per liter
(N.Cells/L-1)
In the estimates, an average organic content
of 70% of the dry weight for C. gracilis was used.
All the groups of mussels were maintained
in filtered seawater (0.5 µm) for 24 h prior to the
physiological tests, in order to clean the digestive tract and simulate the metabolic rate.
To calculate the rates of respiration (RR), clearance (CR), excretion (ER), absorption
efficiency (AE) and increase in size (mm.day-1) the
animals were separated into four size classes (35, 40, 50 and 55 mm) and acclimated for a period of 15 to 20 days in a laboratory. A minimum acclimation time of 15 days was initially established based on the work of Bayne (1973b).
The respiration rates and increase in size were determined every 5 days in 8 groups of mussels, with an initial average size of 44 mm after 30 days in the laboratory, to determine the time of acclimation.
Clearance Rate (CR) = pumping rate
The method consisted of estimating the
removal rate of phytoplankton cells (Chaetocerus
gracilis) by the mussels in 1000 mL test flasks, with 10 identical flasks cointaining one mussel each, and two control flasks without mussels under static conditions (Smaal & Widdows, 1994). For
each flask, concentrations of 140 Cells/µL-1 of
phytoplankton and filtered seawater were inoculated. This concentration was initially established as
lower than 5 mg.L-1, the incipient concentration
for the rejection or formation of pseudo-feces
(Widdows et al., 1979). The test was run for 1 h,
and at its start and end 50 mL of seawater with phytoplankton were removed from each flask to determine its turbidity by absorbance in 750 and 230 nm through the spectrophotometer reading
using a 10-cm light path cuvette (Greenberg et al.,
1992). The clearance rate was estimated using the equation:
where: CR = Clearance Rate (L.h-1); C
t0 = Initial
concentration of phytoplankton (in absorbance at
750 nm and/or 230 nm); Ct1 = Final concentration
of phytoplankton (in absorbance at 750 nm and/or 230 nm); V = Volume of test flask (L); N = Number of organisms per test flask; T = Time interval of
test (h); f = correction factor of the phytoplankton
(decantation rate) calculated using the same formula for the control flasks.
The estimate for quantifying the density of phytoplanktonic cells by absorption spectropho-tometry was used due to its ease and speed of analysis compared with traditional counting by the utermohl method (1958), and the method of
TABLE 1
Values for clearance rate (L.h-1) for the mussel Perna perna using different methods of estimating the density of
phytoplanktonic cells in static experiments. Couting = estimate of density in sedimentation chambers according to the Uthermohl (1958) method; ABS = absorbance reading in spectrophotometry at 750 nm and Cla-a = clorofila-a for the
spectrophotometric method (Parsons et al., 1984).
Replica Count ABS Cla-a
1 1.117 1.466 1.624
2 1.276 1.214 1.079
3 1.217 1.137 1.667
4 1.296 1.526 1.244
5 1.375 1.458 1.451
Average 1.256 1.360 1.413
quantifying biomass in chlorophyll-a (Parsons
et al., 1984). The results given in Table 1 show that there are no significant differences (ANOVA, F = 0.938) between the clearance rates obtained using these three techniques.
Respiration Rate (RR)
The tests were conducted under the same conditions as the previous experiments, with two control flasks and ten test flasks containing one mussel each, both incubated in filtered seawater without phytoplankton. The decrease in values of dissolved oxygen in the flasks was dosed using a digital oximeter (YSI model 58) at the start and end of the test, which was run for 3 h. The respiration rate was estimated using the equation proposed by Widdows & Johnson (1988):
where: RR = Respiration Rate (mL O2.h-1);
Ct0 = Concentration of oxygen at time zero
(mL O2.L-1); C
t1 = Concentration of oxygen at the
end of the test (mL O2.L-1); V = Volume of test flask
(L); ∆T = Interval of incubation time (h); f = Factor
of correction in the control flasks obtained using the same equation.
Absorption Efficiency (AE)
These tests were carried out under the same conditions as the clearance tests, but with a duration of 24 h. The estimate proposed by Conover (1966) consisted of comparing the content of the organic matter present in the phytoplankton offered, with the organic matter eliminated in the feces collected at the bottom of the test flask, and considers that there are no alterations in the inorganic content. The estimates were carried out using the equation:
where: AE = Absorption Efficiency (%); I = Percentage of organic matter in the food offered (phytoplankton); F = Percentage of organic matter in the feces.
The phytoplankton and feces produced were filtered in calcined and weighed fiberglass filters (GF/F Whatman – 25 mm). After washing with distilled water to remove the salts, the dry weight was determined by drying in an oven at 60 °C
for 24 h. The contents of the organic matter were obtained by combustion of the filters, in a muffle oven at 450 °C for two hours (Strickland & Parsons, 1972). To estimate the percentage of organic matter of the feces produced by the mussels, each GF/F filter concentrated feces collected from two organisms submitted to the same treatment, to ensure precision in the weighing.
Excretion Rate (ER)
The tests were carried out under the same conditions as the experiments to determine the respiration rate. At time zero and 3 h later, at the end of the experiment, 15 mL samples of incubation water were collected in the test flasks to determine the total of ammonium nitrogen, according to the colorimetric method described by Strickland
& Parsons (1972) and modified by Baptista et al
(1987). The excretion rate was estimated using the equation:
where: ER = Excretion Rate (µg N–NH4+.h-1); C
t0 =
Concentration of ammonium nitrogen at time zero;
Ct1 = Concentration of ammonium nitrogen at the
end of the experiment; V = Volume of test flask (L);
T = Interval of incubation time (h); f = Factor of
correction in the control flasks obtained using the same equation.
After the tests, the biomass data was obtained by dissecting the organisms and their shells and drying the tissue in an oven at 60 °C for a period of 48 h. Data on the total length were also obtained in order to estimate the increase in size and weight during the acclimation period.
The results of the tests on physiological rates according to size, and acclimation, were compared using variance analysis (ANOVA) and the Tukey
a posteriori test, after normalization in Log10
(Zar, 1996).
RESULTS
Variation of physiological rates due to the size of the organism
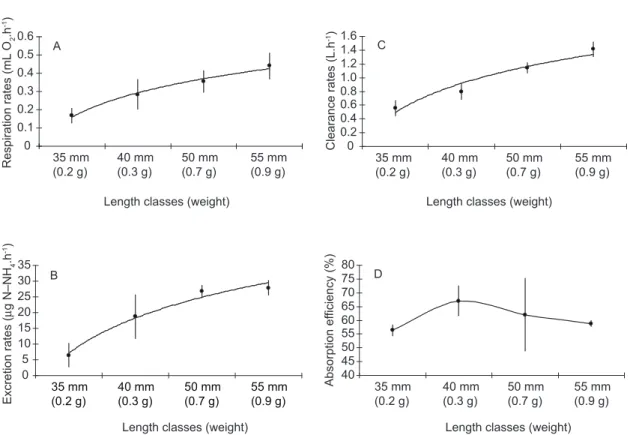
an allometric relation between these variables,
which may be explained by the relation Y = aXb
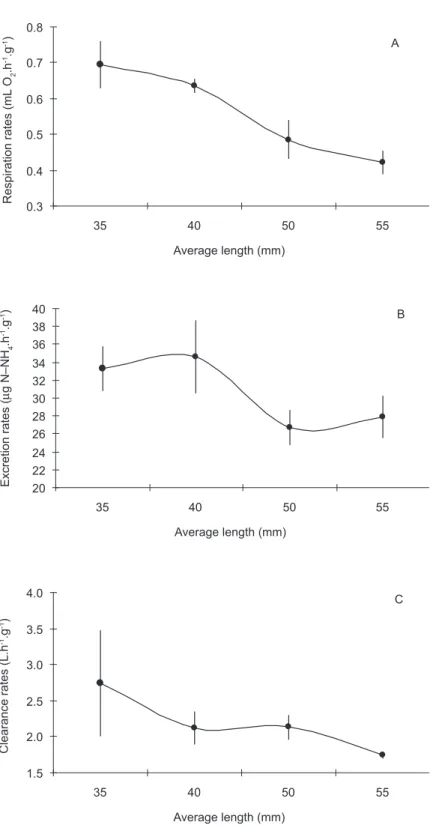
(Bayne et al., 1985). An inverse behavior was
observed when the rates were adjusted for the dry weight of the organisms (known as the specific dry weight or simply the specific rate), with smaller organisms presenting higher physiological rates than larger ones (Fig. 2). However, this relation was not observed for the absorption efficiency, which shows that this parameter is independent of the size of the organism.
Acclimation
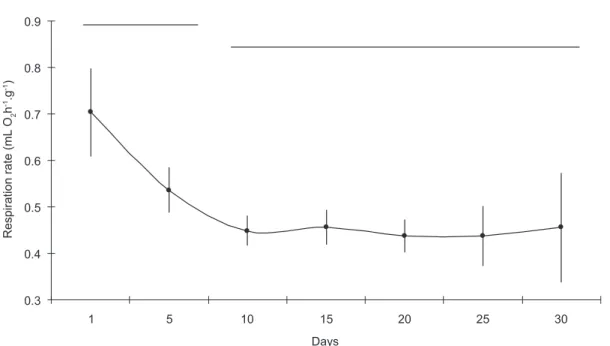
The specific respiration rates for the mussel
Perna perna were measured for a period of 30 days counting from their arrival in the laboratory. A gradual decrease in rates was observed over the first 10 days of maintenance, after which the mussels then stabilized, up until the end of the experiment
(Fig. 3). The rates for the 1st and 5th days were
significantly different from those for the other days of maintenance in the laboratory (ANOVA, F = 14.168).
TABLE 2
Constants for allometric regression (Y = aXb) between the dry weight in grams (Log
10 X) of the mussel Perna perna and its
physiological rates.
Parameter (Log10 Y) a b r
2 N Level of Sig.
Clearance Rate (L.h-1) 1.43 0.48 0.73 27 p < 0.01
Respiration Rate (mL O2.h-1). 0.44 0.66 0.88 39 p < 0.01
Excretion Rate (µg N–NH4.h-1) 27.86 0.91 0.84 29 p < 0.01
0 0.1 0.2 0.3 0.4 0.5 0.6 35 mm (0.2 g) 40 mm (0.3 g) 50 mm (0.7 g) 55 mm (0.9 g)
Length classes (weight)
Respiration rates (mL
O 2 .h -1) A 0 5 10 15 20 25 30 35 35 mm (0.2 g) 40 mm (0.3 g) 50 mm (0.7 g) 55 mm (0.9 g)
Length classes (weight)
Excretion rates (
M g N–NH 4 .h -1) B 0 0.2 0.4 0.6 0.8 1.0 1.2 1.4 1.6 35 mm (0.2 g) 40 mm (0.3 g) 50 mm (0.7 g) 55 mm (0.9 g)
Length classes (weight)
Clearance rates (L.h
-1) C 40 45 50 55 60 65 70 75 80 35 mm (0.2 g) 40 mm (0.3 g) 50 mm (0.7 g) 55 mm (0.9 g)
Length classes (weight)
Absorption ef
ficiency (%)
D
Fig. 1 — a) Respiration rates (mL O2.h-1); b) excretion rates (µg N–NH 4.h
-1); c) clearance rates (L.h-1); and d) absorption ef-ficiency (%) in relation to the length and average weight of the mussels Perna perna. Average values and confidence interval
0.3 0.4 0.5 0.6 0.7 0.8
35 40 50 55
Average length (mm)
Respiration rates (mL
O
2
.h
-1.g
-1) A
20 22 24 26 28 30 32 34 36 38 40
35 40 50 55
Average length (mm)
Excretion rates (
M
g N–NH
4
.h
-1.g
-1) B
1.5 2.0 2.5 3.0 3.5 4.0
35 40 50 55
Average length (mm)
Clearance rates
(L
.h
-1.g -1)
C
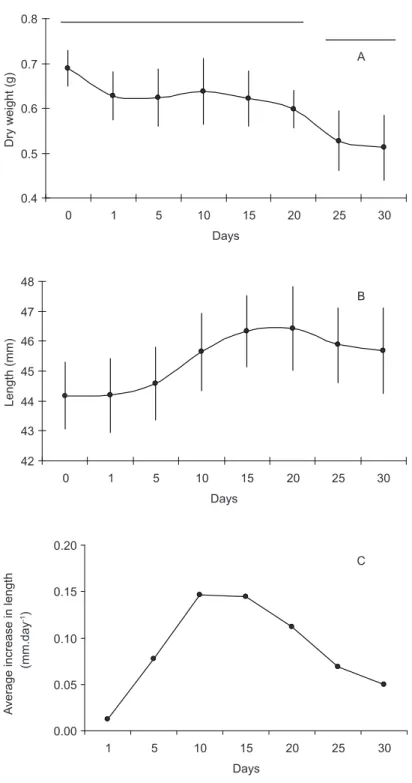
The variations in dry weight obtained during the experiment show that the values did not
alter until the 20th day (Fig. 4), after which they
showed a significant loss of biomass (ANOVA, F = 6.606). Despite the apparent growth in size of
the organisms up to the 5th day in the laboratory,
the values for length did not show any significant differences for all the data analyzed, showing that there was no growth in the organisms, but with a
maximum growth of 0.15 mm.day-1 being observed
on the 10th day (Fig. 4).
DISCUSSION
Due to the fact that these metabolic rates are strongly dependant on the size of the body, it is necessary to introduce a weight adjustment when making comparisons between organisms of different sizes (Bayne & Newell, 1983). Thus, the value b was used (an exponent which indicates how much the rate varies due to size) in the following relation:
where: SR = Specific weight rate; SW = Standard weight of the organism (generally 1 g); OW = Organ-ism weight; RM = Rate measured
According to Thompson & Bayne (1977) the constant a of the allometric equation defines the metabolic expenditure per unit of time and presents a high variability with temperature and food, among other factors. Constant b is the exponent which defines the variation of metabolism with weight, and is less variable than the previous constant
(Bayne et al., 1973). These authors also observe
that metabolic rates are influenced more by weight in mussels under 1 g. There is a wide variation among authors in relation to the b values for different suspension-feeding bivalves, in terms of their different physiological rates. This variation is caused, in theory, by the estimates carried out under different test conditions. The intervals normally observed for b values, according to reviews by Bayne & Newell (1983) and Griffiths & Griffiths (1987), are 0.4-0.8 for clearance; 0.44-1.09 for respiration and 0.48-1.48 excretion rates.
Studies in Brazil on variation in metabolic
rates of Perna perna due to size are restricted
to respiration rates. Bayne (1967) presented an allometric relation between the size of the organism and the respiration rate, with a b value of 0.625, which is close to that obtained in this work. Similar results were obtained by Zuim (1973), who
0.3 0.4 0.5 0.6 0.7 0.8 0.9
1 5 10 15 20 25 30
Days
Respiration rate
(m
L
O
2
h
-1.g -1)
Fig. 3 — Specific respiration rate (mL O2.h-1.g-1) estimated every 5 days, during a period of 30 days acclimation in a labora
0.4 0.5 0.6 0.7 0.8
0 1 5 10 15 20 25 30
Days
Dry weight (g)
A
42 43 44 45 46 47 48
0 1 5 10 15 20 25 30
Days
Length (mm)
B
0.00 0.05 0.10 0.15 0.20
1 5 10 15 20 25 30
Days
A
verage increase in length
(mm.day
-1)
C
obtained b values of 0.54 for P. perna in phase III
A2 (total repletion of the reproductive follicles) and
0.67 for phase III B (partial or total emptying of the follicles, which determines a lesser thickness of the mantle). For the relation between clearance rate and weight, Berry & Schleyer (1983) present a b value
of 0.66 for P. perna off the coast of South Africa.
Also for the same country and species, van Erkom Schurink & Griffiths (1992) present b values of 0.88 for the clearance rate, 1.19 for the respiration rate and 0.73 for the excretion rate. These results are quite different from those obtained in this study.
For other species of the Perna genus, such as P.
canaliculus (Gardner, 2002; Hawkins et al., 1999), the b value adopted of 0.62 for the clearance rate is the general average obtained for bivalves according to Bayne & Newell (1983).
The fact that the size of the organisms has little influence on the absorption efficiency has already been observed by various authors (Bayne & Newell, 1983; Griffiths & Griffiths, 1987). This may be related to a high variability in the estimates for this rate, and also to the difficulties inherent to obtaining individual weights for feces in laboratory experiments. The higher variability in efficiency is related to the type of diet fed to the mussels, and may be as high as 80% when they are fed with monospecific algae cultures, and from 30% to 60% when fed with natural seston (Bayne & Newell, 1983). However, smaller organisms would be expected to present lower absorption efficiencies for two reasons: Firstly, due to the fact that smaller organisms have a higher specific clearance rate, which means food is retained in the digestive tract for a shorter period of time (Widdows, 1978). Secondly, there is a higher digestive capacity in adults due to the direct relation between body mass and the digestive glandular capacity (Griffiths & Griffiths, 1987).
The inverse behavior between the specific physiological rates and size (weight) of the organisms is also a well-known fact in suspension-feeding bivalves (Bayne & Newell, 1983), with higher specific weight rate in smaller the organism. The most probably explanation for this “size rule” is that during growth, the physiological rates increase less than body mass, since there is a disproportionate increase in tissue with the low metabolism tissues such as the supporting and fatty tissues (Zuim, 1973). This behavior between respiration rate and
weight for P. perna has also been highlighted by
Dioni (1963).
The acclimation process results in alterations in the rate of ventilation and a concomitant reduction (or increase) in the metabolic cost of pumping water through the gills (Widdows, 1973). Thus, this process is reflected in the respiration, and is also a result of alterations in metabolism of the tissues (Gabbott, 1976). Bayne & Thompson (1970) also observe a decrease in specific respiration rates and
weight in the mussel Mytilus edulis maintained in
a laboratory, even under conditions of high food availability and an organism/volume ratio much higher than that used in this work. These authors concluded that the food offered was insufficient for their maintenance.
To understand the behavior of the specific
respiration rates of the mussel Perna perna
maintained for 30 days in a laboratory, it is necessary to know the types of metabolism that can be observed in the organism. The standard metabolism is defined as the minimum amount of energy required to maintain the vital functions of the inactive organism. The routine metabolism corresponds to the energy required for a spontaneous activity, and the active metabolism relates to
the consumption of energy or O2 in maximum
activity (Widdows, 1973). Bayne (1973b) also describe these metabolisms related to the type
of maintenance of the mussel Mytilus edulis and
conclude that the standard metabolism is obtained after 30 days in a laboratory when the food offered is less than the needs of the organism. The routine metabolism occurs when the organisms are fed above their requirements and their weight is stable or increases. The activity metabolism occurs when the mussels are fed after a long period of starvation. The routine metabolism (the metabolism between activity and standard) is reached after 14 days under constant laboratory conditions, after the respiration rate has decreased. However, the mussel maintains this rate above the standard metabolism to meet the energy demand for gametogenic activity, and once this is completed, it lowers once again to the
standard level (Bayne et al., 1973).
According to Bayne (1973a) the time
necessary for the mussel M. edulis to enter a state
substance, leading to a high demand for oxygen and consequently, more time to enter the state of inanition (25 to 30 days). Once vitellogenesis is complete, the glycogen is used up and the demand for oxygen is low, therefore the inanition time is
shorter (≈ 10 days).
In this work, it was observed that the oxygen
consumption in P. perna was initially high and
decreased up to the 10th day. During this period,
the organisms probably used their reserves and
maintained their weight until the 20th day, then lost
weight and demonstrated a greater variability in
respiration rates (from the 25th day on). It would
appear that the stabilization of their metabolic functions under laboratory conditions occurred
after the 10th day, when the respiration rates became
constant, the weight stabilized and there was a small increase in size.
Lunetta (1969) observes that the reserve
substance of P. perna is also glycogen and that
its use is related to the reproductive cycle of these mussels, particularly following vitellogenesis. This author also observes that the mussel spawns throughout the year with peaks during the spring. On the North coast of Santa Catarina, high body condition index of mussels also occurs throughout the year with peaks during spring and summer (Marenzi, 1992). Due to this reproductive cycle, with a high frequency of peaks of maturity throughout the year, it is believed that the influence of reserve substances on the time of acclimation
as observed by Bayne (1973a) for Mytius edulis
does not apply to suspended culture Perna perna.
However, even in these conditions, it was evident that the food offered during the maintenance period was insufficient for the basic needs of the organism,
as was shown by the weight loss after the 25th day.
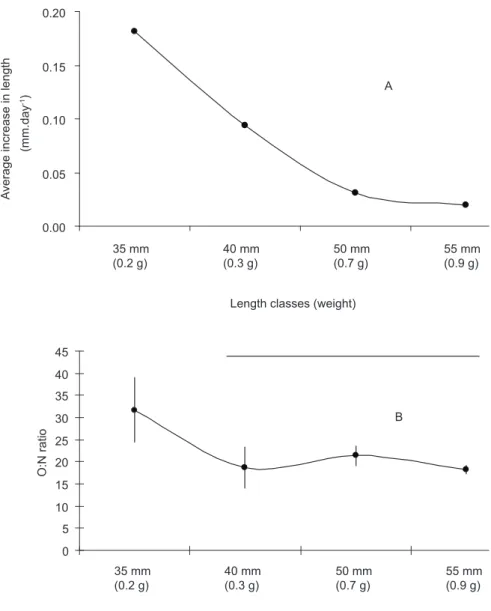
Another way of confirming this physiological state would be to determine the ratio between respiration rate and excretion rate. Ammonium is related to the catabolism of proteins which varies with the nutritional status and reproductive situation of the organism. In the latter case, the use of proteins in the metabolism depends on the glycogen reserves, which are used first in the gametogenesis (Griffiths & Griffiths, 1987). The O:N ratio is a good indicator of the nutritional
status of the organism (Bayne et al., 1985).
Therefore, values above 30 indicate sufficient food since the catabolism of carbohydrates and lipids is
predominant. Lower values indicate a catabolism of proteins, and consequently, a nutritional deficit (Bayne & Thompson, 1970). Fig. 5 shows the results of growth in size and O:N ratio for the different size classes maintained in a laboratory for between 15 and 20 days. A O:N ratio of higher than 30 was observed for the 35 mm class alone, this class being significantly different from the other size classes (ANOVA, F = 8.899). Also for this class, there was a high increase in size.
These results suggest that the quantity of food offered, limited by the availability of monospecific phytoplankton cultures in the laboratory, enables mussels of 40-45 mm in size to be maintained
in routine metabolism from the 10th day in the
laboratory, eliminating seasonal variations in
the metabolic rates. From the 20th day on, with a
significant reduction in weight of the organisms, the entry to standard metabolism was not so evident due to the non-alteration of the respiration rate. The 35 mm size group is the one that would be most efficiently maintained in concentrations of food presented in this work, but the lack of availability of these organisms in the environment is a limiting factor for physiological studies. It is interesting to
note that for the 35 mm group of the mussel Perna
perna, the food offered is equivalent to 1.5% of its weight, the minimum value necessary for the energy balance of the metabolism, as presented by
Thompson & Bayne (1972) for Mytilus edulis.
Acknowledgments — The authors are thankful to Adriano Marenzi and Gilberto Manzoni for help with the mussel support, CAPES – Natiownal Council for Science and Technological Development for the Ph.D fellowship and uNIVALI – Itajaí Valley university for funding provision.
REFERENCES
BAPTISTA, J. M. R., BAuMGARTEN, M. G. Z. & NIENCHESKI, L. F. H., 1987, Caderno de análises em oceanografia química. Documento N. 8. Editora da FuRG. 64p.
BAYNE, B. L., 1967, The respiratory response of Mytilus perna
L. (Mollusca: Lamellibranchia) to reduced environmental oxygen. Physiological Zoology, 40: 307-313.
BAYNE, B. L., 1973a, Aspects of the metabolism of Mytilus edulis during starvation. Netherlands J. Sea Res.,
7: 399-410.
BAYNE, B. L., 1973b, Physiological changes in Mytilus edulis
L. induced by temperature and nutritive stress. J. Mar. Biol. Ass. U. K., 53: 39-58.
MOORE, M. N., STEBBING, A. R. D. & WIDDOWS, J., 1985, The effects of stress and pollution on marine animals. Praegez Publshers, New York, 384p.
BAYNE, B. L. & NEWELL, R. C., 1983, Physiological energetics of marine molluscs, pp. 407-515. In: Salevddin, A. S. M. & K. M. Wilbur (eds.) The mollusca. Physiology Parte 1. 4º vol, Academic Press. New York.
BAYNE, B. L. & THOMPSON, R. J., 1970, Some physiological consequences of keeping Mytilus edulis in the laboratory.
Helgoländer wiss. Meeressunters, 20: 526-552.
BAYNE, B. L., THOMPSON, R. J. & WIDDOWS, J., 1973, Some effects of temperature and food on the rate of
oxygen consumption by Mytilus edulis L, pp. 181-193.
In: W. Wieser (ed.) Effects of temperature on ectothermic organisms. Springer-Verlag, Berlim.
BERRY, P. F. & SCHLEYER, M. H., 1983. The brown mussel
Perna perna on the Natal coast, South Africa: utilization of available food and energy budget. Mar. Ecol. Prog. Ser., 13: 201-210.
CONOVER, R. J., 1966, Assimilation of organic matter by zooplankton. Limnol. Oceanogr., 11: 338-345.
DIONI, W., 1963, Consumo de oxigênio pelo mexilhão (Mytilus perna) do canal de São Sebastião. Ciência e Cultura 15(4): 265-266.
0 5 10 15 20 25 30 35 40 45
35 mm (0.2 g)
40 mm (0.3 g)
50 mm (0.7 g)
55 mm (0.9 g)
Length classes (weight)
O:N ratio
0.00 0.05 0.10 0.15 0.20
35 mm (0.2 g)
40 mm (0.3 g)
50 mm (0.7 g)
55 mm (0.9 g)
Length classes (weight)
A
verage increase in length
(mm.day
-1)
A
B
GABBOTT, P. A., 1976, Energy metabolism, pp. 293-355.
In: B. L. Bayne (ed.) Marine mussels: their ecology and physiology. Cambridge univ. Press. Cambridge.
GARDNER, J. P. A., 2002, Effects of seston variability on the clearance rate and absorption efficiency of the mussel
Aulacomya madriana, Mytilus galloprovincialis and Perna canaliculus from New Zealand. J. Exp. Mar. Biol. Ecol., 268: 83-101.
GREENBERG, A. E., CLESCERI, L. S. & EATON, A. D., 1992, Standard methods for the examination of water and wastewater. 18th edition, APHA, Washington.
GRIFFITHS, C. L. & GRIFFITHS, R. J., 1987, Bivalvia, pp. 1-88. In: T. J. Pandian & F. J. Vernberg (eds.) Animal energetics. Bivalvia through Reptilia. 2º vol., Academic Press. New York.
HAWKINS, A. J. S., JANES, M. R., HICKMAN, R. W., HATTON, S. & WEATHERHEAD, M., 1999, Modelling of suspension-feeding and growth in the green-lipped mussel
Perna canaliculus exposed to natural and experimental variations of seston availability in the Marlborough Sounds, New Zealand. Mar. Ecol. Prog. Ser., 191: 217-232. LuNETTA, J. E., 1969, Fisiologia da reprodução dos mexilhões
(Mytius perna – Molusca Lamellibranchia). Bol. Zool. Biol. Mar., 26: 33-111.
MARENZI, A. W. C., 1992, Aspectos biológicos e econômicos do cultivo de mexilhões Perna perna (Linné, 1758) (Mollusca Bivalvia), no litoral centro-norte catarinense. Tese de Mestrado, uFPr. 135p.
PARSONS, T. R., MAITA, Y. & LALLI, C. M., 1984, A manual of chemical and biological methods for seawater analysis. Pergamon Press, Oxford. 173p.
SMAAL, A. C. & WIDDOWS, J., 1994, The scope for growth of bivalves as an integrated response parameter in biological monitoring, pp. 247-267. In: K. J. M. Kramer (ed.) Biomonitoring of coastal waters and estuaries. CRC Boca Raton.
STRICKLAND, J. D. H. & PARSONS, T. R., 1972, A practical handbook of seawater analysis, Bull. Fish. Res. Bd. Canada., 167p.
THOMPSON, R. J. & BAYNE, B. L., 1972, Active metabolism associated with feeding in the mussel Mytilus edulis.L. J. Exp. Mar. Biol. Ecol., 9: 111-124.
THOMPSON, R. J. & BAYNE, B. L., 1977, Some relationships between growth, metabolism and food in mussel Mytilus edulis. Mar. Biol., 27: 317-326.
uTHERMOHL, H., 1958, Zur vervollkommnung der quantitativen phytoplankton methodic. Mitt. Int. Verein. Theor. Andew. Limnolgie., 9: 1-38.
VAN ERKOM SCHuRINK, C. & GRIFFITHS, C. L., 1992, Physiological energetics of four South African mussel species in relation to body size, ration and temperature.
Comp. Biochem. Physiol. 101A(4): 779-789.
WIDDOWS, J., 1973, The effects of temperature on the metabolism and activity of Mytilus edulis. Netherlands J. Sea Res., 7: 387-398.
WIDDOWS, J., 1978, Combined effects of body size, food concentration and season on the physiology of Mytilus edulis. J. Mar. Ass. U.K., 58: 109-124.
WIDDOWS, J., FIETH, P. & WORRALL, C. M., 1979, Relationships between seston, available food and feeding activity in the common mussel Mytilus edulis. Mar. Biol., 50: 195-207.
WIDDOWS, J. & JOHNSON, D., 1988, Physiological energetics of Mutilus edulis: Scope for growth. Mar. Ecol. Progr. Series., 46: 113-121.
ZAR, J. H., 1996, Biostatistical analysis. Prentice Hall, New Jersey. 662p.