Dalila do Rosário Encarnação Serpa
Licenciada em Biologia Aplicada aos Recursos Animais – Variante Recursos Marinhos
Macroalgal (Enteromorpha spp. and Ulva spp.)
Primary Productivity in the Ria Formosa Lagoon
Dissertação para obtenção do grau de Mestre em Ecologia, Gestão e Modelação dos Recursos Marinhos
Orientador:
Professor Doutor João Pedro Salgueiro Gomes Ferreira,
Faculdade de Ciências e Tecnologia da Universidade Nova de Lisboa
Júri:
Presidente: Professor Doutor João Gomes Ferreira Vogais: Professora Doutora Alice Newton
Professora Doutora Maria Helena Ferrão Ribeiro da Costa
i
Macroalgal (
Enteromorpha
spp. and
Ulva
spp.) Primary Productivity in the
Ria Formosa Lagoon
Copyright Dalila do Rosário Encarnação Serpa, FCT/UNL, UNL
iii
Agradecimentos
Ao Professor Doutor João Gomes Ferreira, orientador deste trabalho, pela disponibilidade que demonstrou em esclarecer as minhas dúvidas, pelos comentários e pela oportunidade de participar no Projecto OARRE.
À Doutora Manuela Falcão, pela disponibilização dos meios necessários à realização deste trabalho, e pelas sugestões que me deu no decorrer do mesmo.
Ao Engenheiro Carlos Vale, pelo apoio quando foi solicitado a utilização das instalações do IPIMAR para a realização deste trabalho.
À Milu e à Cristina, pelo apoio que me deram no trabalho de campo e no trabalho laboratorial, e ainda pelo bom ambiente de trabalho que me proporcionaram.
Aos meus pais, por sempre me apoiarem e respeitarem a minhas decisões, e ainda por me “aturarem” todos estes anos.
Às minhas irmãs, Catarina e Carmo, pela amizade e pela força que sempre me deram.
v
Resumo
Em áreas sujeitas a eutrofização, as macroalgas oportunistas de crescimento rápido e elevadas taxas de consumo de nutrientes, podem tornar-se os principais produtores primários do ecossistema, pelo que se torna de grande importância a avaliação correcta da produtividade anual destas algas. Experiências de incubação in situ foram realizadas de modo a determinar quais os factores
ambientais que controlam a produtividade das espécies de Enteromorpha e Ulva na laguna da Ria
Formosa. A análise de regressão revelou que o padrão de variação sazonal da produtividade das algas está significativamente (p < 0.05) relacionado com a intensidade luminosa, sendo que as taxas
fotossintéticas mais elevadas são observadas durante o período de outono/principio de Inverno. Em laboratório, foram também realizadas experiências de incubação de modo a determinar os parâmetros das curvas P-I para estas algas. Em ambas as experiências, in situ e em laboratório,
observou-se fotoinibição a intensidades luminosas mais elevadas. A taxa máxima de produção para a Ulva foi de 3.66 mg C g-1 dw h-1, enquanto que para a Enteromorpha o valor deste parâmetro foi
de 3.55 mg C g-1 dw h-1. Os valores da intensidade luminosa óptima para a fotossíntese eram
semelhantes para a Enteromorpha (47 µE m-2 s-1) e para a Ulva (35 µE m-2 s-1). A relação entre a
luz e as taxas de consumo de nutrientes das macroalgas foi também estudada em laboratório, contudo esta relação não foi significativa (p > 0.05), provavelmente devido ao facto destas algas
oportunistas apresentarem “consumo de luxo”. As taxas respiratórias da Enteromorpha variaram
entre 0.04 e 0.25 mg C g-1 dw h-1, enquanto que para a Ulva os valores foram ligeiramente
superiores, variando entre 0.08 e 0.35 mg C g-1 dw h-1. Para simular a produtividade anual das
macroalgas dominantes na laguna, desenvolveu-se um modelo ecológico. O modelo incluiu a inibição pela luz e a limitação de nutrientes tendo em conta as concentrações internas de azoto e fósforo. Para ambas as algas observou-se que o azoto não era um nutriente limitativo para a fotossíntese, pois ao longo do ano as concentrações internas deste nutriente foram sempre superiores à quota interna mínima. Contudo, observou-se que as concentrações internas de fósforo diminuíam durante o período de Inverno provavelmente devido à baixa disponibilidade de fósforo dissolvido na água. Os valores de produção primária bruta anual estimados pelo modelo são de 190 g C m-2 ano-1 para a
Enteromorpha e de 132 g C m-2 ano-1 para a Ulva. Anualmente estas algas
contribuem com cerca de 446 ton de carbono para o ecossistema, dos quais 85% provêem das espécies de Enteromorpha. As macroalgas bentónicas são também importantes na remoção de
vi
Palavras-Chave:
Macroalgas; Curvas P-I; Produtividade primária; Consumo de nutrientes;vii
Abstract
In areas undergoing eutrophication, opportunistic macroalgae with high nutrient uptake rates and rapid growth may become the dominant primary producers of the ecosystem, revealing the importance of an accurate evaluation for the annual algal production. In order to determine the environmental factors controlling Enteromorpha and Ulva species productivity in the Ria Formosa
lagoon, in situ short-term incubation experiments were performed. Regression analysis revealed
that light seems to accurately (p<0.05) explain the pattern of seasonal variation of algae
productivity, with highest photosynthetic rates during the autumn/early winter period. Laboratory incubation experiments were performed to determine P-I curves parameters for both species. In
both in situ and laboratory experiments, seaweed exhibited photoinhibition at high light intensities.
Maximum production rate for Ulva was 3.66 mg C g-1 dw h-1, while for Enteromorpha it was 3.55
mg C g-1 dw h-1. Similar values of optimal light intensity were estimated for Enteromorpha (47 µE
m-2 s-1) and
Ulva (35 µE m-2 s-1) species. The relationship between macroalgalnutrient uptake rates
and light irradiances were also evaluated in the laboratory experiments, but the results of regression analysis showed that it was not significant (p > 0.05), probably due to “luxury consumption” by
these opportunistic macroalgae. Enteromorpha respiratory rates ranged from 0.04 to 0.25 mg C g-1
dw h-1, while for
Ulva respiration values were slightly higher varying between 0.08 and 0.35 mg C
g-1 dw h-1. An ecological model was developed in order to simulate the annual productivity of the dominant macroalgae species in the lagoon. The model included photoinhibition and nutrient limitation based on the internal concentration of nitrogen and phosphorus. For both seaweeds there was no nitrogen limitation for seaweed productivity. Over the year, internal nitrogen concentrations were always higher than the minimum internal quota. However, internal phosphorus concentrations were depleted during the winter period probably due to the low availability of dissolved phosphorus. Values of annual gross primary production estimated by the model are higher for
Enteromorpha spp. (190 g C m-2 y-1) than for Ulva spp. (132 g C m-2 y-1). The seaweeds
contribution to the lagoon carbon budget is of 446 ton C y-1,from which 85 % correspond to Enteromorpha species. Benthic macroalgae also play an important role in nutrient removal.
Annually, these algae remove about 69 tons of nitrogen and 10 tons of phosphorus. These quantities correspond in terms of population equivalents to 15700 inhabitants for nitrogen and 10000 inhabitants for phosphorus.
ix
Table of Contents
Agradecimentos
iii
Resumo
v
Palavras-Chave
vi
Abstract
vii
Keywords
vii
Table of Contents
ix
List of Figures
xiii
List of Tables
xv
List of Symbols
xvii
Chapter I – General Introduction
1
1.
General Introduction
3
2. Objectives
5
Chapter II – Site Description
7
Site description
9
1. Climate
10
1.1 Temperature
10
1.2 Rainfall
11
1.3 Solar radiation and insolation
11
1.4 Wind
12
2. Hydrodynamics
12
2.1 Currents
12
2.2 Tides
12
3. Sediment characteristics
13
4. Physico-chemical parameters
13
4.1 Temperature, dissolved oxygen, pH, salinity, Secchi disk and suspended
particulate matter
13
4.2 Nutrients
14
5. Vegetation cover
15
5.1 Macroalgae
16
x
5.1.2 Seasonal distribution
17
Chapter III - Macroalgal Primary Productivity
19
1. Introduction
21
2. State of the art
21
3. Methodology
23
3.1
In situ
incubation experiments
23
3.2 Laboratory incubation experiments
24
3.3 Sampling analysis
25
3.3.1 Dissolved oxygen determination
25
3.3.2 Nutrient determination
25
3.4 Primary productivity calculations
25
3.5
P-I
curves
27
4. Results and Discussion
28
4.1
In situ
incubation experiments
28
4.1.1 Environmental parameters
28
4.1.2 Primary Productivity
28
4.1.3 Respiratory rates
31
4.2 Laboratory incubation experiments
32
4.2.1 Primary Productivity
32
4.2.2 Respiratory rates
33
4.2.3
P-I
curves
34
4.2.4 Nutrient uptake rates
36
4.3. Comparison with other studies
38
Chapter IV – Macroalgal model
41
1. Introduction
43
2. Description of the model
43
2.1 Background
43
2.2 Choice of forcing functions
44
2.3 Model development
44
2.3.1 Gross primary productivity
45
2.3.1.1 Forcing functions and limitations
45
2.3.1.1.1 Light
45
xi
2.3.1.1.1.2 Light at the bottom
47
2.3.1.1.1.3 Tide simulation
47
2.3.1.1.1.4 Light limitation
48
2.3.1.1.2 Nutrients
49
2.3.1.1.2.1 Nutrient uptake
50
2.3.1.1.2.2 Nutrient feedback control
51
2.3.1.1.2.3 Nutrient limitation
51
2.3.2. Respiration
52
2.3.3. Mortality
52
2.4. Simulations
52
2.5. Model implementation
52
2.6. Macroalgal productivity in the Ria Formosa
52
3. Results and Discussion
52
3.1. Internal nutrient concentrations
53
3.2. Primary productivity
58
3.3. Carbon and nutrient budgets
59
Chapter V – General Conclusions
61
General Conclusions
63
xiii
List of Figures
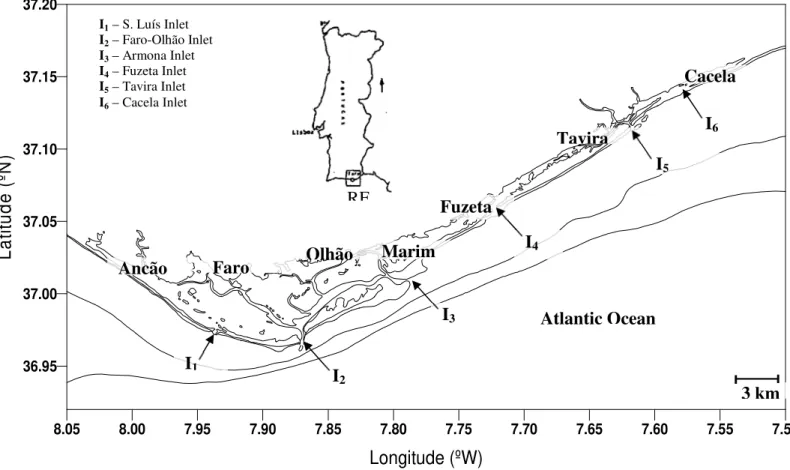
Figure 2.1 - Geographic location of the Ria Formosa lagoon. 9
Figure 2.2 - Mean annual temperature (ºC) in the Ria Formosa lagoon [2]. 11
Figure 2.3 - Mean annual values of rainfall (mm y-1) in the Ria Formosa lagoon [2]. 11
Figure 2.4 - Mean annual values of solar radiation (kcal cm-2) in the Ria Formosa lagoon [2]. 12
Figure 2.5 – GIS maps of the DAIN:Phosphate ratio in the Ria Formosa lagoon. (A) Summer conditions: (I) low, (II) high water; (b) winter conditions: (I) low, (II) high water (Newton et
al., 2003). 15
Figure 2.6 – Macroalgae species in the Ria Formosa lagoon: a) Ulva lactuca, b) Enteromorpha
compressa. 16
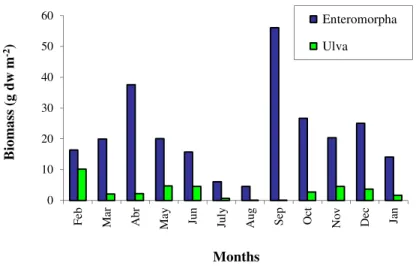
Figure 2.7 - Average monthly biomasses (g dw m-2) of
Enteromorpha and Ulva species in the Ria
Formosa lagoon (Adapted from Aníbal, 1998). 17
Figure 3.1 - General scheme of a P-I curve (Parsons et al., 1984). 22
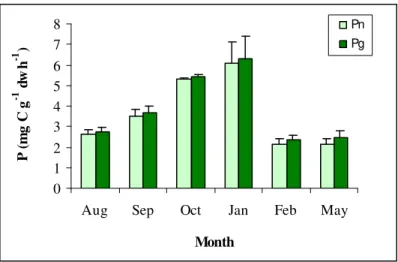
Figure 3.2 - Mean values (± standard deviation) of net (Pn) and gross primary productivity (Pg) for
Enteromorpha over the experimental period. 29
Figure 3.3 – Mean values (± standard deviation) of net (Pn) and gross primary productivity (Pg) for
Ulva over the experimental period. 29
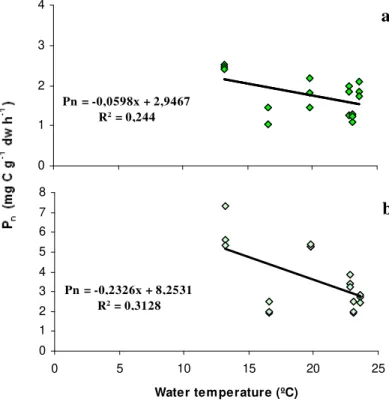
Figure 3.4 - Relationship between water temperature and net primary productivity (Pn) for
Enteromorpha (a) and Ulva (b), with the regression lines and equations. 30
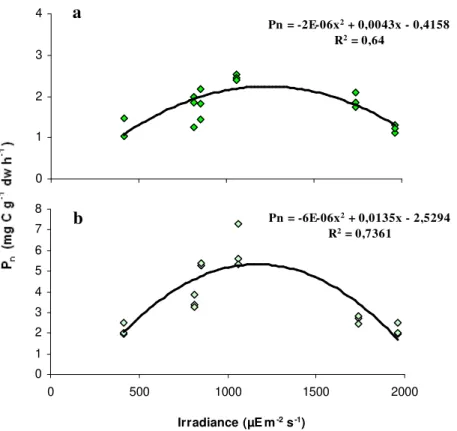
Figure 3.5 - Relationship between light irradiances and net primary productivity (Pn) for
Enteromorpha (a) and Ulva (b), with the regression lines and equations. 31
Figure 3.6 – Enteromorpha spp. P-I curve. Filled circles represent the results obtained in the
laboratory incubation experiments. 35
Figure 3.7 – Ulva spp. P-I curve. Filled circles represent the results obtained in the laboratory
incubation experiments. 35
Figure 4.1 – Annual variation of light intensity (I, µE m-2 s-1). 46
Figure 4.2 – Annual variation of photoperiod. 46
Figure 4.3 – Tidal height over a spring/neap tidal cycle. 48
Figure 4.4 – Annual variation of total inorganic nitrogen (TIN) concentrations in Ria Formosa. 50
Figure 4.5 – Annual variation of phosphate concentrations in Ria Formosa. 50
Figure 4.6 – Annual variation of internal phosphorus (N) concentrations for Enteromorpha spp. 56
Figure 4.7 – Annual variation of internal phosphorus (P) concentrations for Enteromorpha spp. 56
Figure 4.8 – Annual variation of internal nitrogen (N) concentrations for Ulva spp. 57
Figure 4.9– Annual variation of internal phosphorus (P) concentrations for Ulva spp. 57
xv
List of Tables
Table 2.1 – Mean annual values of grain size and calcimetric analysis of superficial sediments in stations located near the inlets/main channels and inner parts of lagoon/intertidal areas
(adapted from Monteiro, 1989). 13
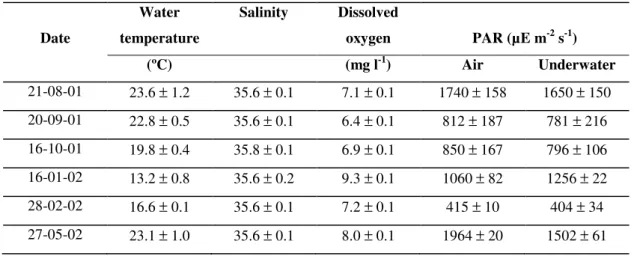
Table 3.1 - Mean values (± standard deviation) of environmental parameters measured during the
in situ productivity experiments. 28
Table 3.2 - Mean (± standard deviation) respiratory rates of Enteromorpha and Ulva measured in
the in situ incubation experiments. 31
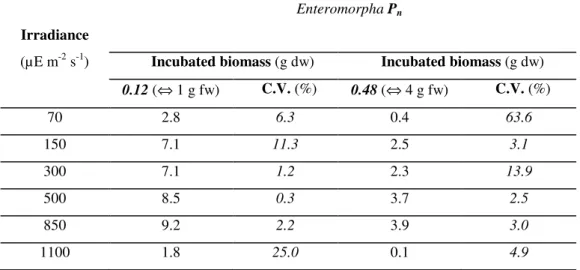
Table 3.3 – Average net primary productivity (Pn) of Enteromorpha spp. for each light incubation
experiment. C.V. – variation coefficient. 32
Table 3.4 – Average net primary productivity (Pn) of Ulva spp. for each light incubation
experiment. C.V. – variation coefficient. 33
Table 3.5 – Mean respiratory rates of Enteromorpha and Ulva with different incubated biomasses.
C.V. – variation coefficient. 34
Table 3.6 – Enteromorpha spp. and Ulva spp. P-I curves parameters. 36
Table 3.7 – Ammonium (NH4+), nitrate (NO3-), nitrite (NO2-) and phosphate (HPO42-) uptake rates
for Enteromorpha and Ulva, at different irradiances. 37
Table 3.8 – Relationship between Enteromorpha nutrient uptake rates and light. In the linear
regressions, the nutrient uptake rate (µM g-1 fw h-1) is the dependent variable (y) and
irradiance is the independent variable (x). 38
Table 3.9 – Relationship between Ulva nutrient uptake rates and light. In the linear regressions,
nutrient uptake rate (µM g-1 fw h-1) is the dependent variable (y) and irradiance is the
independent variable (x). 38
Table 4.1 – Model parameters for Enteromorpha spp. 54
Table 4.2 – Model parameters for Ulva spp. 55
Table 4.3 – Annual gross primary production (Pg), net primary production (Pn), and turnover rates for each seaweed species. Data on biomass was obtained from Aníbal (1998) based on
monthly measurements over a year. 58
Table 4.4 – Annual gross primary production (Pg) and net primary production (Pn) calculated by the model, when a Michaelis-Menten type equation is used for light limitation. 59 Table 4.5 – Total yearly nitrogen and phosphorus removal by Enteromorpha and Ulva species in
xvii
List of Symbols
RF – Ria Formosa
k – light extinction coefficient
SPM – suspended particulate matter
DAIN – dissolved available inorganic nitrogen P – photosynthesis
I – light intensity
Pn – net primary productivity
Pg – gross primary productivity
R – respiration
Pmax – maximum production rate α - initial slope
Iopt – optimal light intensity
Ik – saturating irradiance
Ic – compensation light intensity
PAR – Photosynthetically Active Radiation NH4+ – ammonium
NO3-2 – nitrate
NO2- – nitrite
HPO4-2 – phosphate
dw – dry weight
C.V. – variation coefficient fw – fresh weight
B – biomass
M – mortality
I0– light energy available at water surface
Iz – light available for photosynthesis at depth z
z – depth
h – height of the macroalgae stand above datum
HT – high tide LT – low tide t – time
xviii
N – internal nitrogen concentration P – internal phosphorus concentration
Nup – nitrogen uptake
Nfb – nitrogen feedback control
Pup – phosphorus uptake
Pfb – phosphorus feedback control
VNmax – maximum uptake rate for nitrogen
TIN – total inorganic nitrogen
KN – half saturation constant for nitrogen
VPmax – maximum uptake rate for phosphorus
KP – half saturation constant for phosphorus
QNmax – maximum internal quota for nitrogen
QNmin – minimum internal quota for nitrogen
QPmax – maximum internal quota for phosphorus
QPmin – minimum internal quota for phosphorus
Maxmort – maximum mortality rate
Chapter I
Chapter I
3
1.
General Introduction
In recent years, the quality of coastal waters worldwide has deteriorated as a result of an increase of human population and activities along coastal regions (Newton et al., 2003). Anthropogenic
activities, such as deforestation, agriculture, animal rearing and wastewater treatment, increase the nutrient supply to coastal ecosystems leading to eutrophication (Fong et al., 1994).
Under eutrophic conditions, an excessive growth of seaweeds is observed (Morand and Briand, 1996) and these algae may become the dominant primary producers of the ecosystem (Peckol and Rivers, 1996; Kinney and Roman, 1998; Martins et al., 2001), outcompeting other species, such as
seagrasses and phytoplankton. The competition for nutrients can also control the algal community structure by favouring opportunistic macroalgae species, such as Enteromorpha and Ulva, with
high nutrient uptake rates and rapid growth (Fong et al., 1994; Pedersen and Borum, 1996;
Bachelet et al., 2000) due to a simple thallus morphology (high surface to weight ratios) which
makes them more suited to obtain light energy and nutrients (Littler, 1979) than other benthic macroalgae.
At first, the development of opportunistic macroalgae acts as a bioremediation mechanism (Morand and Briand, 1996) because a large part of the nutrients excess is removed. Then, when the environmental conditions become unfavourable, the plants die and decompose, leading to an increase in the amounts of organic detritus and a decrease in dissolved oxygen concentrations. This degradation of water quality affects the living resources, tourism, recreation, and human and environmental health.
Besides nutrient availability, the macroalgal primary productivity is also determined by other
environmental factors such as light intensity and temperature (Parsons et al., 1984; J∅rgensen,
1994).
In shallow coastal ecosystems such as the Ria Formosa lagoon, where light may reach the bottom, benthic primary producers play an important role in carbon fixation and nutrient removal (NICE, 1999). Thus, the study of macroalgal primary productivity is of special interest once it can be used as a potential indicator of eutrophication (Fong et al., 1994).
Recently, studies carried out in the Ria Formosa lagoon (Newton et al., 2003) demonstrated the
Chapter I
4
(Padinha et al., 2000) there are already signs of eutrophication, as it was documented a decrease in
seagrasses and a large increase in algal mats in the lagoon. The macroalgal community of the Ria Formosa is also dominated by green opportunistic macroalgae, such as the Ulvales, Enteromorpha
spp. and Ulva spp. (Cunha, 1990; Aníbal, 1998), species often found in areas undergoing
eutrophication (Lavery and McComb, 1991; Sfriso and Marcomini, 1997; Martins et al., 2001).
The benthic macroalgae community of the Ria Formosa lagoon is not well studied. Although there are some species inventories (Ardré, 1970; Cunha, 1990; Duarte et al., 1988), studies on seaweeds
taxonomy (Mata, 1997), and on the spatial and seasonal variability of algae biomass over the year (Reis, 1994; Aníbal, 1998), there is a lack of information about macroalgal productivity and their contribution to the overall ecosystem productivity.
Chapter I
5
2.
Objectives
The main objective of the present work was to the estimate the annual productivity of the dominant macroalgae species (Enteromorpha spp. and Ulva spp.) in the Ria Formosa lagoon. This was
approached by:
1) Determining the relative importance of environmental factors (water temperature, light intensity and salinity) controlling macroalgal productivity in the Ria Formosa;
2) Determining the P-I curve parameters for each macroalgae;
3) Developing an ecological model in order to simulate the annual macroalgal productivity at
Chapter II
Chapter II
9
Site description
The Ria Formosa is a shallow mesotidal lagoon located along the eastern part of the south coast of Portugal (Fig. 1.1), with an extension of 55 km (from Ancão to Cacela), a maximum width of 6 km (from Faro to Cape Santa Maria) and a wet area of 105 km2. The lagoon is protected from the
ocean by a sandy barrier island interrupted by six inlets (S.Luís, Faro-Olhão, Armona, Fuzeta, Tavira e Cacela) (Fig. 1.1). It has several channels and an extensive intertidal area, around 50 % of the total wet area (53 km2), mostly constituted by sand, muddy-sand flats and salt marshes
(Bettencourt, 1994).
Figure 2.1 - Geographic location of the Ria Formosa lagoon.
The morphological diversity of this ecosystem determines different environmental units defined according to morphological and phytomorphological criteria (Andrade, 1990). These environmental units are classified as:
Tidal flats establish the connection between salt marshes and tidal channels. Their lower limit is the mean level of the low tides of spring tides. These areas are characterized by silt-clay or muddy-sand bottoms without halophyte vegetation but abundantly covered by the seagrass,
8.05 8.00 7.95 7.90 7.85 7.80 7.75 7.70 7.65 7.60 7.55 7.50
Longitude (ºW)
36.95 37.00 37.05 37.10 37.15 37.20L
a
ti
tu
d
e
(
ºN
)
I
1I
2Atlantic Ocean
I
3I
4I
5I
6I1 – S. Luís Inlet
I2 – Faro-Olhão Inlet
I3 – Armona Inlet
I4 – Fuzeta Inlet
I5 – Tavira Inlet
I6– Cacela Inlet
Faro
Olhão
Tavira
Marim
Cacela
Ancão
RF
Fuzeta
Chapter II
10
Zostera noltii. Almost 5 km2 of the tidal flats are used for clam farming, which means removal
of vegetation and a periodical addition of sand.
Salt marshes located above tidal flats cover an area of 34 km2. Silt-clay sediments colonised by halophyte species characterize these areas. The vegetation is dominated by Spartina
maritima, Salicornia nitens, Arthrocnemum perenne, Suaeda maritima and Atriplex portucaloides [1]. The low salt marsh is almost exclusively colonized by Spartina maritima
and the bigger plants colonize the high salt marsh with a shorter immersion period.
Tidal channels allow an easy water circulation. The bottom grain size varies from coarse sand to silt. Large areas of the bottom are covered by Zostera marina, which contributes to
sedimentation of suspended particulate matter.
Lagoon beaches with sand and muddy-sand sediments appear especially within tidal flats and salt marshes.
The Ria Formosa lagoon and some of its hinterland has been included in a National Park (184 km2)
and accepted as a Natura 2000 network and a Ramsar site, as a recognition of its environmental value. The park includes a great diversity of habitats, including salt marshes (35 km2), dunes (19 km2), saltpans (10 km2), fish farms (2.8 km2) and, muddy-sand flats (24 km2) [1]. The lagoon is
also a valuable resource to the Algarve region for tourism, fisheries, aquaculture and salt extraction.
1. Climate
The climate in the Algarve region is typically Mediterranean, with warm dry summers and mild winters.
1.1 Temperature
Chapter II
11
Figure 2.2 - Mean annual temperature (ºC) in the Ria Formosa lagoon [2].
1.2 Rainfall
In the Ria Formosa, the mean annual values of rainfall vary between 400 and 600 mm y-1 (Fig. 1.3).
Generally, the wettest month is December with about 17% of the total annual rainfall, and the driest months are July and August with less than 1% of the annual rainfall (Falcão, 1997).
Figure 2.3 - Mean annual values of rainfall (mm y-1) in the Ria Formosa lagoon [2].
1.3 Solar radiation and insolation
In the Ria Formosa, solar radiation is high with mean annual values ranging between 161 and 165 kcal cm-2, except in the extreme west of the lagoon where values above 165 kcal cm-2 are reached
(Fig. 1.4). Insolation is also high varying between 3000 and 3200 hours in a year [2].
RF
Chapter II
12
Figure 2.4 - Mean annual values of solar radiation (kcal cm-2) in the Ria Formosa lagoon [2].
1.4 Wind
In the eastern part of the Algarve region where Ria Formosa is located, the wind blows predominantly from west and southwest, however during spring and autumn there is a high incidence of winds blowing from east (Granja, 1984).
2.
Hydrodynamics
As the volume of water exchanged between the lagoon and the sea varies from 30 × 106 to 100 ×
106 m3, according to the tidal amplitude (CEPASA, 1980), and the subtidal water volume is about 50 × 106 m3, it is assumed that at neap and spring tides, 40% to 70% of the water volume is
respectively exchanged with the sea (Sprung, 1994).
2.1 Currents
In the main channels the current speed is less than 1 m s-1, while in the inlets it exceeds 2 m s-1 (IH,
2002).
2.2 Tides
In the Ria Formosa, tides exhibit a semi-diurnal regime and a fortnightly cycle of spring and neap tides. The mean tidal range is 2.0 m, ranging from 0.5 m in neap tides to 3.5 m in spring tides (Melo, 1989), thus a rather intense exchange of water mass occurs during each tide (Sprung, 1994)
Chapter II
13
and large intertidal areas are exposed to the atmosphere for several hours over each semi-tidal period.
3. Sediment characteristics
The results of grain size analysis of sub-tidal and intertidal superficial sediments are presented in Table 1.1. Near the inlets and in the main channels of the lagoon submitted to strong currents, sandy sediment prevails, while in the inner parts of lagoon and in the intertidal areas predominates mud or muddy-sand sediments (Granja, 1984; Monteiro, 1989).
Table 2.1 – Mean annual values of grain size and calcimetric analysis of superficial sediments in stations located near the inlets/main channels and inner parts of lagoon/intertidal areas (adapted from Monteiro, 1989).
Stations
Clay (%) Silt (%) Sand (%) CaCO3(%)
Mean s.d. Mean s.d. Mean s.d. Mean s.d.
Inlets / Main channels 0.55 0.39 0.78 0.42 95.58 7.45 5.02 2.34 Inner parts of lagoon / Intertidal
areas 6.18 3.70 32.63 16.21 62.10 15.58 7.00 3.26
4 Physico-chemical parameters
4.1 Temperature, dissolved oxygen, pH, salinity, Secchi disk and suspended
particulate matter
Water temperature exhibits a seasonal fluctuation with a minimum in winter (13 ºC) and a maximum of 26 ºC in summer (Falcão, 1997; Falcão and Vale, 2003).Concentrations of dissolved oxygen are close to saturation values all over the year (Falcão and Vale, 2003; Newton et al.,
2003), probably due to an intense exchange of water between the lagoon and the sea, and to a high primary productivity within the lagoon (Falcão and Vale, 2003). Values of pH vary from 8.0 to 8.6
at neap tides and are slightly lower (≈ 8.2) in spring tides due to mixing with incoming seawater (Falcão and Vale, 2003). Because freshwater inputs to the lagoon are negligible, salinity remains close to 36 (Falcão, 1997), except during sporadic and short periods of winter runoff when it may reach 30 (Falcão et al., 1992). The Secchi disk depth ranges annually from 1.5 m to 3.2 m [3],
which corresponds to an annual range of light extinction coefficient (k), between 0.5 and 1.1 m-1
Chapter II
14
- 45 g m-3) of suspended particulate matter (SPM) observed over the year. SPM regulates the underwater light climate, and therefore determines the benthic primary productivity in shallow coastal systems (Lorenz et al., 1999).
4.2 Nutrients
In the Ria Formosa lagoon, nutrient concentrations exhibit seasonal, spatial and tidal variability (Newton, 1995; Falcão, 1997; Newton et al., 2003).
The average concentrations of dissolved available inorganic nitrogen (DAIN) fluctuate around 20 µM with greater concentrations in the eastern lagoon (10 – 150 µM) compared to the western lagoon (1-35 µM) (Newton et al., 2003). These differences are greater in winter months, with
concentrations in the eastern lagoon increasing up to 150 µM, while in the western lagoon DAIN concentrations are around 35 µM. The high levels of DAIN observed in the eastern lagoon during the rainfall period are probably related to the fact that this area is under the impact of rivers (e.g. Gilão), streams (e.g. Almargem) and agricultural runoff.
Phosphate is generally greater than 0.6 µM and always higher in the eastern lagoon (0.75 – 1.4 µM) compared to the western lagoon (0.35 – 1.3 µM). The highest phosphate concentrations are observed during late spring and early summer, decreasing to below 0.8 µM during late summer and early autumn. Phosphate increases during late autumn and early winter, reaching values of 1.2 µM in the eastern lagoon (Newton et al., 2003).
Nitrate and phosphate concentrations also vary with the tide level (Falcão and Vale, 2003). At high tide the concentrations of these nutrients are higher than at low tide, suggesting that they are imported from the sea, mainly during the period of lower water temperatures (Falcão, 1997).
Based on the distribution of DAIN and phosphate concentrations in the lagoon, Newton et al.
Chapter II
15
Figure 2.5 – GIS maps of the DAIN:Phosphate ratio in the Ria Formosa lagoon. (A) Summer conditions: (I) low, (II) high water; (b) winter conditions: (I) low, (II) high water (Newton et al., 2003).
5. Vegetation cover
Subtidal and intertidal areas of the lagoon are extensively covered by benthic macrophytes, such as macroalgae (Enteromorpha spp. and Ulva spp.), seagrasses (Zostera sp., Cymodocea nodosa and
Ruppia cirrhosa) and Spartina maritima that dominate the low salt marshes (Falcão, 1997).
The intertidal areas are mainly covered by Spartina maritima (8 km2), seagrasses (8.2 km2) and
Chapter II
16
5.1 Macroalgae
In the Ria Formosa lagoon, macroalgae occur mainly in the tidal flats. In these areas, 16 species of Phaeophyta (brown algae), 22 species of Chlorophyta (green algae), and 39 species of Rhodophyta (red algae) were identified (Ardré, 1970; Cunha, 1990; Duarte et al., 1988; Reis, 1994; Mata,
1997). Of these algae, the most representative are the Ulvales, Enteromorpha spp. and Ulva spp.
(Fig. 1.6), contributing to more than 70 % of the seaweed biomass in the lagoon (Reis, 1994).
Figure 2.6 – Macroalgae species in the Ria Formosa lagoon: a) Ulva lactuca, b) Enteromorpha compressa.
Macroalgae are distributed along a horizontal axis. Substrate, temperature, light intensity, nutrient availability and hydrodynamics (tidal range and currents) are the major factors concerning the algae distribution in this lagoon (Cunha, 1990; Duarte et al., 1988).
5.1.1 Spatial distribution
Reis (1994) observed a strong correlation between the Ulvales biomass and substrate, in the eastern part of the lagoon. Intertidal areas of sandy sediments and coarse materials seem to be the more suitable to the establishment of Enteromorpha and Ulva species. In fact, these algae are a major
problem in the growth banks of clams where they have to be constantly removed (Cunha, 1990). However, Enteromorpha species are also common in muddy areas (Reis, 1994).
Although Enteromorpha and Ulva species are frequently observed together (Cunha, 1990; Reis,
1994), it seems that Enteromorpha species are dominant in the upper intertidal areas (Cunha,
1990), at a mean depth of 1.2 m (positive above tidal datum). This is probably due to a higher capacity of resistance to extreme environmental conditions (high temperatures, high light
Chapter II
17
intensities and desiccation) (Pregnall and Rudy, 1985). On the other hand, Ulva species colonize
mainly subtidal and lower intertidal areas (Cunha, 1990), about 0.8 m above tidal datum.
5.1.2 Seasonal distribution
In the Ria Formosa, macroalgae blooms appeared in September, by the time of the first autumn rainfalls and disappeared gradually during the following spring (Fig. 1.7). Minimum values of seaweed biomass were observed in summer (July-August). This pattern of seasonal variation is typical from transitional areas, between temperate and tropical zones (Morand and Briand, 1996).
Over the year, the mean values of Enteromorpha biomasses are higher than for Ulva (Aníbal,
1998). This author has documented a minimum Enteromorpha biomass in August (4.5 g dw m-2)
and a maximum in September (56.1 g dw m-2), while for Ulva, biomasses ranged from 1.1 g dw m-2
in July-August to 10.2 g dw m-2 in February (Fig. 1.7).
Figure 2.7 - Average monthly biomasses (g dw m-2) of Enteromorpha and Ulva species in the Ria Formosa
lagoon (Adapted from Aníbal, 1998). 0 10 20 30 40 50 60 Fe b M ar A br M
ay Jun
Ju
ly
A
ug Sep Oct
N
ov Dec Jan
Chapter III
CHAPTER III.
Chapter III
21
1. Introduction
Benthic macroalgae are major contributors to the primary productivity of coastal ecosystems (Mann, 1973; Pregnall and Rudy, 1985; D'Avanzo et al., 1996; Peckol and Rivers, 1996; Kinney
and Roman, 1998; Alvera-Azcárate et al., 2003).
Seaweeds productivity is determined by physical (hydrodynamics, light irradiances, temperature), chemical (nutrient availability, salinity, pH) and biological factors, e.g. grazing (Steffensen, 1976; Lapointe and Tenore, 1981; Parsons et al., 1984; Thom and Albright, 1990; Henley et al., 1991;
Fong et al., 1994; Lobban and Harrison, 1994; Duarte and Ferreira, 1995; Valiela, 1995; Van Den
Hoek et al., 1995) that may act synergistically or not.
The aim of this chapter was to study the primary productivity of the most representative species of macroalgae (Enteromorpha spp. and Ulva spp.) in the Ria Formosa lagoon and to evaluate the
influence of environmental factors (temperature and light) on the photosynthetic rates of these seaweeds. Enteromorpha and Ulva photosynthetic rates were studied by generating P-I curves for
each macroalgae genera.
2. State of the art
In situ (Pregnall and Rudy, 1985; Ferreira and Ramos, 1989; Kinney and Roman, 1998) and
laboratory (Arnold and Murray, 1980; Nelson and Siegriest, 1987; Duarte and Ferreira, 1995; Peckol and Rivers, 1996; Hanelt et al., 1997) short-term incubation experiments have been used to
determine macroalgal primary productivity.
Methods for the determination of seaweed photosynthetic rates are usually based onmeasurements of either carbon dioxide consumption or oxygen production per unit time (Lobban and Harrison, 1994; Van Den Hoek et al., 1995).
CO2 is usually measured by the infra-red analysis method or the radiocarbon (14C) method (Van
Den Hoek et al., 1995). The infra-red analysis method consists in measuring the difference in CO2
concentration before and after its introduction in the photosynthesis chamber (Van Den Hoek et al.,
1995). In the radiocarbon method, a high specific-radioactivity isotope (H14CO
3) is added to the
incubation vessels and the proportion of total radioisotope incorporated into the seaweed is measured (Lobban and Harrison, 1994; Van Den Hoek et al., 1995). This method is usually used in
Chapter III
22
should be taken in interpreting the results obtained by the radiocarbon method because: 1) there is an apparent discrimination in the assimilation rates of the two carbon isotopes (14CO
2 and 12CO2),
2) the 14C-organic carbon may be lost by exudation during the experiment, 3) some 14CO 2 fixed
may be lost due to dark respiration or photorespiration, which take place simultaneously with photosynthesis (Parsons et al., 1984).
Productivity estimates based on oxygen evolution can be made using an oxygen electrode or the Winkler method (Lobban and Harrison, 1994; Van Den Hoek et al., 1995). The advantages of the
oxygen methods are that net primary productivity (Pn), gross primary productivity (Pg) and respiration (R) can be directly estimated. However there may be an overestimation of respiration in
the light due to photorespiration. Another disadvantage is that heterotrophic respiration is also included in the measurement. Although one order of magnitude less sensitive than the 14C-method, the oxygen methods are suitable for use in coastal waters (Parsons et al., 1984).
The relationship between photosynthesis (P) and light intensity (I) is fundamental to study
macroalgal productivity. A general scheme of a P-I curve is presented in Fig. 2.1.
Figure 3.1 - General scheme of a P-I curve (Parsons et al., 1984).
Chapter III
23
The initial slope, α, has been defined as the "quantum yield", i.e., the number of moles of oxygen produced (or of carbon incorporated) per unity light intensity. The initial slope is a function of the light reactions and is not usually affected by other environmental factors (Parsons et al., 1984).
Iopt is the optimum light intensity for photosynthesis, while, Ik, the saturating irradiance, is defined as the point at which the extrapolated initial slope intercepts Pmax (Fig. 8). Ik gives a measure of the radiant energy or illumination at light saturation but it does not express photosynthetic efficiency (Parsons et al., 1984; Lobban and Harrison, 1994; Van Den Hoek et al., 1995).
When gross photosynthesis (Pg) equals respiration (R), the net photosynthesis (Pn) is zero and the photosynthetic system is at the compensation point (Van Den Hoek et al., 1995). The light intensity
at the compensation point is called the compensation light intensity, Ic (Parsons et al., 1984).
If organisms are exposed to a strong light above the point at which they are light saturated, the P-I
curve may show a decrease in the photosynthetic rates. This phenomenon is termed photoinhibition (Parsons et al., 1984; Valiela, 1995) and it involves damage to some photosystems components
(especially PS-II), such as membranes or electron-transport proteins, and changes in the enzymatic activity (Neale and Marra, 1985).
Several mathematical models have been proposed for describing the primary productivity of phytoplankton (Steele, 1962; Jassby and Platt, 1976; Platt et al., 1980; Neale and Marra, 1985;
Eilers and Peters, 1988; McBride, 1992;Macedo et al., 1998) and macroalgae (Nelson and Siegrist,
1987; McBride, 1992; Duarte and Ferreira, 1995) as a function of light intensity. The choice of a particular mathematical formulation may lead to different estimates of the P-I curve parameters
therefore it is important for these formulations to accurately describe experimental data in order to obtain reliable primary productivity estimates.
3. Methodology
3.1 In situ incubation experiments
In order to study the seasonal variation of macroalgal primary productivity, in situ short-term
incubation experiments were carried out during Summer, Autumn, Winter and Spring 2001/2002.
Chapter III
24
Water temperature, salinity and dissolved oxygen concentrations were measured using a multiparameter probe (YSI 55). Measurements of photosynthetically active radiation (PAR) were made underwater and in air, using a LICOR LI-250 light meter.
Macroalgal photosynthetic and respiratory rates were determined by the oxygen method (Thomas, 1988). Three incubation bottles were filled with lagoon water; two (light and dark) were incubated containing macroalgae, and a third without algae (control) was used to assess the effect of planktonic primary production on the experimental results. All experiments were made in triplicate.
Before the experiments, lagoon water samples were collected in order to determine the initial oxygen concentration. These samples were immediately fixed according to the Winkler method (Grasshoff, 1983).
Macroalgal samples were washed to remove sediment deposits, epifauna and attachment materials and immediately incubated, in situ, within Winkler bottles of 300 ml.
Incubation times (1 hour) and biomasses (4 to 7 g of fresh weight) were chosen so as to prevent inhibition of photosynthesis by an excess of dissolved oxygen, pH changes or nutrient depletion, and to simultaneously assure that any oxygen changes were detectable (Dromgoole, 1978; Littler, 1979). During incubation, the bottles were rotated at regular intervals to ensure an even exposure to the light. Following the incubation period, water samples for dissolved oxygen determination were immediately fixed and the incubated algae removed from the bottles. Afterwards, algal samples were taken to the laboratory and dried at 80 ºC to determine dry weight (dw).
3.2 Laboratory incubation experiments
Laboratory incubation experiments were performed in order to generate P-I curves for both
macroalgae genera. As for the in situ incubation experiments, photosynthetic and respiratory rates
of seaweeds were determined by the oxygen method.
Before the experiments, water samples were collected and filtered in order to determine the initial oxygen and nutrient (ammonium, nitrate, nitrite and phosphate) concentrations.
Macroalgal samples were incubated in the laboratory using light provided by 1500 W tungsten halogen lamps (Drew, 1983), placed 1 m above the samples. Heat produced by the lamps was dissipated using a cold water flow system (Macedo et al., 1998). Light intensity (0 to 1100 µE m-2
Chapter III
25
PVC nets. In order to determine the effect of incubated algal biomass on photosynthetic rates, two Winkler bottles (300 ml) containing 1 g and 4 g fw of algae, respectively, were incubated for each light intensity. The experiments were carried out in triplicate.
Simultaneously with productivity determinations, the effect of light on macroalgal nutrient uptake rates was also studied. After the incubation period (30 minutes), water samples were collected from the incubation bottles in order to determine macroalgal nutrient consumption.
Macroalgal samples were also incubated in the dark in order to determine respiratory rates.
3.3 Sampling analysis
3.3.1 Dissolved oxygen determination
In both in situ and laboratory experiments, dissolved oxygen concentrations were determined by
the Winkler method (Grasshoff, 1983). All water samples for oxygen determination were analysed in the same day of collection.
3.3.2 Nutrient determination
The ammonium (NH4+), nitrate (NO3-), nitrite (NO2-) and phosphate (HPO42-) concentrations were
determined using a “SKALAR” autoanalyser according to the methods of Technicon Industrial Systems (Grasshoff, 1983).
3.4 Primary productivity calculations
In the in situ incubation experiments, the oxygen variation in the light bottles is a measure of
macroalgal and phytoplankton photosynthetic activity (Pm + Pp). It is also a function of algae
respiration (Rm + Rp), bacterial respiration (Rb) and zooplankton respiration (Rz).
Light bottle (∆ O2) = Pm + Pp – (Rm +Rp + Rb + Rz)
In the dark bottles, the oxygen variation represents the respiration of all the aerobic organisms present.
Chapter III
26
Thus, the results will be representative of a community however, for macroalgae, which represent the bulk of the response, the results will reflect the species chosen (Thomas, 1988). In the present study the values concerning plankton productivity and respiration were very similar to initial oxygen values, and were not used in calculations.
In the laboratory experiments, macroalgae are the only organisms contributing to the oxygen variation in either light or dark bottles, because lagoon water was filtered.
The oxygen variation in light bottles is a measure of macroalgal net primary productivity (Pn). Gross primary productivity (Pg) is the sum between Pn and macroalgal respiration (R).
Pn and R were calculated by the following equation:
Pn (R) = ([O2]final – [O2]initial) × V × F × Q (1)
W × t
Pn – net primary productivity (mg C g-1 dw h-1)
R – respiration (mg C g-1 dw h-1)
[O2] final – dissolved oxygen concentration at the end of the incubation experiment (mg l-1).
[O2] initial - dissolved oxygen concentration before the incubation experiment (mg l-1).
V – volume of the incubation bottle (l).
F – conversion factor of oxygen mass to carbon mass (0.29). Q – photosynthetic/respiratory quotient.
W – macroalgae weight (g dw). t – incubation time (h).
According to the conventionally accepted stoichiometric equation for photosynthesis (Tian et al.,
1993):
106 CO2 + 16 NO3- + HPO42- + 122 H2O + 18 H+→ C106H263O110N16P + 138 O2
the oxygen production can be converted to carbon production by a reduction factor of 0.29.
Values of primary productivity expressed as mg O2 g-1 dw h-1 were converted to mg C, assuming a
Chapter III
27
3.5 P-I curves
In order to generate P-I curves, productivity data obtained in the laboratory incubation experiments
was fitted to the Steele (1962) and Eilers and Peters (1988) mathematical models because these two mathematical formulations account for photoinhibition.
Author Model
Steele (1962) −
=
IoptI opt
e
I
I
P
P
1 maxEilers and Peeters
(1988)
aI
bI
c
I
P
+
+
=
2In Steele’s model, the parameters, I opt and Pmax are directly estimated, while α and Ik were calculated according to the following equations:
α = Pmax
Iopt
e
(2)Ik =
S
P
max
(3)
By differentiating the Eilers and Peters (1988) model, the parameters α, I opt, Pmax and Ik can be expressed as a function of the a, b and c parameters:
α
c
1
=
(4)I opt
a c
= (5)
Pmax =
ac
b 2
1
+ (6)
Ik =
ac b
c
2
Chapter III
28
Macroalgal productivity data were fitted to the mathematical models using non-linear estimation (Statistica software version 5.0).
4. Results and Discussion
4.1 In situ incubation experiments
4.1.1 Environmental parameters
During the in situ productivity incubations, water temperature followed a clear pattern of seasonal
variation (Table 2.1), with lower values during the winter period (January-February) and maximum values during spring/summer. Salinity remained close to 36, as expected because the freshwater supply to the lagoon is irrelevant (Falcão, 1997), except during sporadic periods of intense runoff (Falcão et al, 1992). Dissolved oxygen concentrations were always close to saturation values,
ranging from 6.4 to 9.3 mg l-1. Underwater light irradiances ranged from 404 (February) to 1650
µE m-2 s-1 (August), and were generally lower than air irradiances due to light attenuation in the
water column (Parsons et al., 1984).
Table 3.1 - Mean values (± standard deviation) of environmental parameters measured during the in situ
productivity experiments.
Date
Water
temperature
Salinity Dissolved
oxygen PAR (µE m-2 s-1)
(ºC) (mg l-1) Air Underwater
21-08-01 23.6 ± 1.2 35.6 ± 0.1 7.1 ± 0.1 1740 ± 158 1650 ± 150 20-09-01 22.8 ± 0.5 35.6 ± 0.1 6.4 ± 0.1 812 ± 187 781 ± 216 16-10-01 19.8 ± 0.4 35.8 ± 0.1 6.9 ± 0.1 850 ± 167 796 ± 106 16-01-02 13.2 ± 0.8 35.6 ± 0.2 9.3 ± 0.1 1060 ± 82 1256 ± 22 28-02-02 16.6 ± 0.1 35.6 ± 0.1 7.2 ± 0.1 415 ± 10 404 ± 34 27-05-02 23.1 ± 1.0 35.6 ± 0.1 8.0 ± 0.1 1964 ± 20 1502 ± 61
4.1.2 Primary productivity
Chapter III
29
0 1 2 3 4 5 6 7 8Aug Sep Oct Jan Feb May
Month P ( m g C g
-1 d
w h -1 ) Pn Pg 0 1 2 3 4 5 6 7 8
Aug Sep Oct Jan Feb May
Month P ( m g C g
-1 d
w
h
-1 )
Pn Pg
spring-summer (Pregnall and Rudy, 1985; D'Avanzo et al., 1996; Kinney and Roman, 1998), the highest productivity values in the lagoon were observed during autumn and early winter (Fig. 2.2 and 2.3). The maximum net production rates of Enteromorpha (2.5 mg C g-1 dw h-1) and Ulva (6.1
mg C g-1 dw h-1) were measured in January, at an ambient water temperature of 13.2 ºC and an
irradiance of 1256 µE m-2 s-1. The lowest productivity values of
Enteromorpha (Fig. 2.2) and Ulva
(Fig. 2.3) were measured in February (16.6 ºC; 415 µE m-2 s-1) and May (23.1 ºC; 1964 µE m-2 s-1).
Although the photosynthetic rates of both macroalgae genera presented the same pattern of variation, the results show that, for this range of temperatures and light irradiances, Ulva (2.1 – 6.1
mg C g-1 dw h-1) has consistently higher production rates than Enteromorpha (1.2 – 2.5 mg C g-1
dw h-1).
Figure 3.2 - Mean values (± standard deviation) of net (Pn) and gross primary productivity (Pg) for Enteromorpha over the experimental period.
Figure 3.3 – Mean values (± standard deviation) of net (Pn) and gross primary productivity (Pg) for Ulva
Chapter III
30
In order to understand the variation of Enteromorpha and Ulva primary productivity, over the
experimental period, a regression analysis was performed to evaluate the relationship between environmental factors and photosynthetic rates. This analysis was only performed for the parameters, water temperature and light irradiances because salinity remained relatively constant over the experimental period (Table 2.1) and dissolved oxygen does not determine photosynthesis. Macroalgal productivity was not significantly (p>0.05) related to water temperature (Fig. 2.4)
possibly because other environmental factors, such as light or nutrient availability, do not allow the expression of temperature limitation (Rivers and Peckol, 1995).
Figure 3.4 - Relationship between water temperature and net primary productivity (Pn) for Enteromorpha (a)
and Ulva (b), with the regression lines and equations.
As shown in Fig. 2.5, light seems to accurately (p<0.05) explain the pattern of variation of seaweed
productivity in the Ria Formosa lagoon. Macroalgal productivity increased with light up to a certain irradiance value. At high light irradiances (1740 - 1964 µE m-2 s-1), the production rates of both Ulvales were inversely proportional to light, suggesting that the algae were photoinhibited (Parsons et al., 1984; Lobban and Harrison, 1994; Van Den Hoek et al., 1995).
Pn = -0,0598x + 2,9467
R2 = 0,244
0 1 2 3 4
0 5 10 15 20 25
Water tem perature (ºC)
Pn = -0,2326x + 8,2531
R2 = 0,3128
0 1 2 3 4 5 6 7 8
0 5 10 15 20 25
Water tem perature (ºC)
a
Chapter III
31
Figure 3.5 - Relationship between light irradiance and net primary productivity (Pn) for Enteromorpha (a)
and Ulva (b), with the regression lines and equations.
4.1.3 Respiratory rates
Macroalgal respiratory rates measured in the in situ incubation experiments are presented in Table
2.2. Enteromorpha and Ulva presented similar respiratory rates, however Ulva respiration values
(0.08 to 0.35 mg C g-1 dw h-1) varied within a broader range than for Enteromorpha (0.04 to 0.25
mg C g-1 dw h-1).
Table 3.2 - Mean (± standard deviation) respiratory rates of Enteromorpha and Ulva measured in the in situ
incubation experiments.
Date Respiratory rates (mg Cg-1 dw h-1)
Enteromorpha spp. Ulva spp.
21-08-01 0.04 ± 0.01 0.08 ± 0.06 20-09-01 0.21 ± 0.02 0.18 ± 0.02 16-10-01 0.13 ± 0.02 0.10 ± 0.09 16-01-02 0.23 ± 0.05 0.21 ± 0.01 28-02-02 0.25 ± 0.06 0.22 ± 0.17 27-05-02 0.20 ± 0.04 0.35 ± 0.04
Pn = -2E-06x2 + 0,0043x - 0,4158
R2 = 0,64
0 1 2 3 4
0 500 1000 1500 2000
Irradiance (µE mPn = -6E-06x-2 s-1)
2 + 0,0135x - 2,5294
R2 = 0,7361
0 1 2 3 4 5 6 7 8
0 500 1000 1500 2000
Irradiance (µE m-2 s-1)
a
Chapter III
32
4.2 Laboratory incubations experiments
In the laboratory, incubation experiments were performed for different light irradiances in order to generate P-I curves for each macroalgae genera.
4.2.1 Primary productivity
Net productivity values of Enteromorpha (Table 2.3) and Ulva (Table 2.4) varied with the
incubated biomass. Correlation analysis revealed that, for both genera, production rates were significantly lower (p< 0.01) in the incubation bottles containing higher alga biomasses (4g fw).
This may have happened because the use of freshly cut pieces of alga thallus normally generates an increase in thallus respiration due to tissue damage (Drew, 1983; Lobban and Harrison, 1994), and consequently photorespiration is overestimated and net photosynthesis underestimated (Parsons et
al., 1984). The productivity results used to generate P-I curves were the ones concerning to the
experiments in which 1g fw of algal biomass was incubated.
Independently from the incubated biomass, the photosynthetic rates of both macroalgae species exhibited a similar pattern of variation with light. Seaweed productivity values increased with increasing irradiances, but at high light levels (1100 µE m-2 s-1), production rates were reduced
probably due to photoinhibition (Parsons et al., 1984; Lobban and Harrison, 1994; Van Den Hoek
et al., 1995), as observed in the in situ incubation experiments. In the laboratory, Enteromorpha
photosynthetic rates (Table 4) were higher than the Ulva photosynthetic rates (Table 5), unlike
what was observed in the in situ experiments in which Ulva presented the highest productivity
values.
Table 3.3 – Average net primary productivity (Pn) of Enteromorpha spp. for each light incubation
experiment. C.V. – variation coefficient.
Irradiance
Enteromorpha Pn
(µE m-2 s-1) Incubated biomass (g dw) Incubated biomass (g dw)
0.12(⇔ 1 g fw) C.V. (%) 0.48 (⇔ 4 g fw) C.V. (%)
70 2.8 6.3 0.4 63.6
150 7.1 11.3 2.5 3.1
300 7.1 1.2 2.3 13.9
500 8.5 0.3 3.7 2.5
850 9.2 2.2 3.9 3.0
Chapter III
33
Table 3.4 – Average net primary productivity (Pn) of Ulva spp. for each light incubation experiment. C.V. –
variation coefficient.
Irradiance
Ulva Pn
(µE m-2 s-1) Incubated biomass (g dw) Incubated biomass (g dw)
0.18(⇔ 1 g fw) C.V. (%) 0.67 (⇔ 4 g fw) C.V. (%)
70 0.5 30.4 0.3 23.5
150 5.1 37.2 1.4 4.3
300 3.8 3.2 1.5 7.7
500 4.9 2.5 1.7 5.8
850 7.0 4.1 2.9 1.4
1100 1.0 42.0 0.2 55.3
Comparing both incubation experiments one can notice that, for a similar value of incubated biomass (4 g fw) and at the same range of light irradiances (415 – 850 µE m-2 s-1) the Enteromorpha productivity values measured in the laboratory (2.3 – 3.9 mg C g-1 dw h-1) were
higher than those measured insitu (0.76 – 1.67 mg C g-1 dw h-1). Conversely, Ulva production rates
were higher in the in situ incubation experiments (3.42 – 4.64 mg C g-1 dw h-1) than in the
laboratory (1.7 - 2.9 mg C g-1 dw h-1). These results may be explained by differences in the
experimental conditions (water temperature and nutrient concentrations) or in the algae physiological state at the time of the experiments (Fong et al., 1994).
4.2.2 Respiratory rates
The seaweed respiratory rates measured in the laboratory are presented in Table 2.5. Correlation analysis revealed that algae respiration was significantly (p<0.01) influenced by the incubated
biomass.
Despite the incubated biomass, Enteromorpha (1.2 mg C g-1 dw h-1) and Ulva (1.4 mg C g-1 dw h-1)
showed similar respiratory rates.
Once again, laboratory and field experiments yielded different results, probably due to different experimental conditions.
Chapter III
34
Table 3.5 – Mean respiratory rates of Enteromorpha and Ulva with different incubated biomasses. C.V. – variation coefficient.
Respiratory rates (mg Cg-1 dw h-1)
Enteromorpha spp. Ulva spp.
Incubated biomass (g dw) Incubated biomass (g dw)
0.12 0.48 0.18 0.67
Average 1.2 0.8 1.4 0.8
C.V. (%) 12.9 10.0 0.7 1.2