HYDROLOGICAL MODELLING OF MARANHÃO
AND PRACANA BASINS, A FIRST APPROACH
A. Venâncio
1, F. Martins
1, R. Neves
21
University of Algarve, Portugal.
2
Instituto Superior Técnico, Portugal.
Abstract
Modelling the hydrology of hydrographic basins has shown itself as a useful tool in environment management. The hydrological models can be used for multiple purposes: estimate runoff from sequences of rainfall, access stream water quality, quantify the diffuse pollution that reaches water masses such as estuaries, rivers and lakes, etc. This study has as final objective to simulate and analyse the flow, sediment transport and water quality as a function of landuse and soil type in the basins of Maranhão and Pracana. The modelling system used is SWAT, Soil Water Assessment Tool. In this first phase of the study the hydrodynamic calibration of the model was performed using measurements of average daily flows in five stations. The model compares well with the measurements; the annual average flows are similar and the majority of the measured flow peaks coincide with the model peaks.
Keywords: hydrological models, swat, environment management, runoff, diffuse pollution.
1 Introduction
The applicability of hydrological models for environmental issues is gaining wide support. The spatial information of processes needed for evaluate alternative watershed managements with adoption of geographic information system (GIS) technology is now becoming a usual and efficient tool, Heidenreich et al [1]. In SWAT, this approach is used: the menu interface provides a tool to identify the relative contribution of sub-watershed areas to nonpoint source pollution and to evaluate the effects of alternative land use management practices on surface and ground water quality at the watershed scale, knox et al [2]. They can be also used to estimate river flows at ungauged sites, fill gaps in broken records or extend flow records with respect to longer records of rainfall.
The final objective of this study is to simulate and analyse the flow, sediment transport and water quality as a function of landuse and soil type.
The research area is the watersheds of Maranhão and Pracana, located in Tagus basin. In this phase of the study only hydrodynamic results are shown.
2 Modelling Method
The model used is SWAT, Soil Water Assessment Tool, a watershed scale model developed by Agricultural Research Service and Texas A&M University. The model was developed to predict the impact of land management practices, such as vegetative changes, reservoir management, groundwater withdrawals, and water transfer, sediment and agricultural chemical yields in large complex watersheds with varying soils, land use, and management conditions over long periods of time, User´s Manual SWAT [3]. SWAT can analyze large watersheds and river basins by subdividing the area into homogenous sub-watersheds. It can use a daily time step and perform continuous simulation for a 1 to 100 year period, Srinivasan et al [4]. SWAT simulates hydrology, and nutrient cycling, erosion, and sediment transport.
The hydrology component of SWAT is based on the water balance equation. A distributed Soil Conservation Services (SCS; now Natural Resources Conservation Service) curve number is generated for the computation of overland flow runoff volume, given by the standard SCS runoff equation. The curve number method is empirically based and relates runoff potential to land use and soil characteristics. The curve number method combines infiltration losses, depression storage, and interception into a potential maximum storage parameter.
Water is routed through the channel network using either the variable storage routing method or the Muskingum river routing method. Both the variable storage and Muskingum routing methods are variations of the kinematic wave model.
3 Model Application
In this study the model was applied in Maranhão and Pracana watersheds, tributaries of Tagus river, figure 1.
The basic inputs for the model are: digital elevation model, soil classification, landuse, and meteorological data.
Digital elevation models (DEM) are essential to watershed delineation and modelling because it influences the flow direction and all others hydrologic processes. The DEM was obtained from SRTM (Shuttle Radar Topography Mission). The combination of the soil and land use with meteorology data are fundamental to determine the amount of precipitation converted into effective runoff. The meteorological data needed was available from INAG (Portuguese National Water Authority) and soil and land use charts are from FAO.
Tributary of Tagus River Pracana Basin
Tributary of Tagus River Maranhão Basin
Albuf eir a Cast elo de Bode Albuf eir a Cabr il
Albuf eir a Sant a Cl ara
Albuf eir a Cai a Albuf eir a Regua Albuf eir a Al to Rabagao
Albuf eir a Val eir a
Albuf eir a Al vito Albuf eira Mont ar gil
Albuf eir a Car rapat elo Albuf eira Cr estum a-Lever
Albuf eir a Pocinho
Albuf eir a Mont e da Rocha Albuf eira Bouca Albuf eir a Agui eir a
Albuf eir a Roxo Albuf eir a Vi lar Albuf eir a Cani cada
Albuf eir a Povoa
Albuf eir a Bravura Albuf eira Pego do Al tar
Albuf eir a Par adela
Albuf eir a Odi velas Albuf eir a Vi gia
Albuf eir a Azibo
Albuf eir a Val e do Gaio
Albuf eir a I danha
Albuf eir a Bel iche Albuf eir a Mont e N ovo Albuf eir a Di vor Albuf eir a Venda Nova
Albuf eir a Cam pil has Albuf eir a Er mal Albuf eir a Sal amonde
Albuf eir a Sant a Luzia Albuf eir a Vi lar inho das Furnas
Albuf eir a Ar ade Albuf eir a Mor gavelAlbuf eir a Font e Ser ne
Albuf eir a Tor res Albuf eir a Lucefece Albuf eir a Al to Cavado
Albuf eir a Mei moa
Albuf eir a Tapada Grande Acude Val e dos P ocos
Albuf eir a Magos
Albuf eir a Venda Velha
Albuf eira Dar oeir a
Albuf eir a Sant a M ari a de Aguiar
Albuf eir a Tour ega Lagoa Com pri da ( Alb. )
Acude Val e das B icas
Po rtim a o
Ribei ra de Al mar gem Albuf eir a Bel ver
Figure 1: Localization of Maranhão and Pracana Basins
To calibrate the model there are several parameters needed to be adjusted because they influence the flow produced for each sub-watershed.
The parameter curve number distributes the amount of water entering the sub-watershed into runoff and groundwater as a function of soil type and use. The type of the soil depends generally of the fractions of clay and sand. The others soil characteristics can be obtained from using a pedologic function, K.E. Saxton et al [5]. In SWAT the soil type is used, among other things, to determine the SCS curve number. In the watersheds of Maranhão and Pracana only one type and use of soil was used. Table 1 contains the simulation conditions more appropriate for each sub-basin.
Table 1: Conditions of simulation
Sub-basin (*) Curve Number
(CN2) Soil hydrologic group Use of soil (**) 7 (Couto Andreios) 96 C FRST 39 (Ponte Formosa) 96 C FRST 88 (Figueira e Barros) 36 C FRST 87 (Monforte) 95 C FRST 78 (Pracana) 97 B FRST
(*) Sub-basin associated to the station of measured flow (**) FRST - Forest-mixed
The model was first used to obtain a calibrated set of parameters in each domain. With this information the model was explored to identify the main characteristics of Maranhão and Pracana hydrology.
At Maranhão watershed four flow measuring stations are available, while at Pracana only one station can be used, from INAG. These stations are chosen because they have measured flows and precipitation for the same dates.
Figures 2 to 5, show the annual measured flows and the model results for the five stations, in the same figures the values of 1/4 of the average precipitation in the upstream sub-basins are also shown. The 1/4 fraction is used since it is usually a good approximation of the flow for this systems.
0 0.5 1 1.5 2 2.5 3 1981 1982 1983 1984 1985 1986 1987 1988 1989 1990 year a v e ra g e a n n u a l fl o w ( m 3 /s )
measured flow 1/4 precipitation swat flow
0 1 2 3 4 5 6 7 8 1981 1982 1983 1984 1985 1986 1987 1988 1989 1990 year a v e ra g e a n n u a l fl o w ( m 3 /s )
measured flow 1/4 precipitation swat flow
Figure 3: Ponte Formosa Station - Maranhão Basin
0 0.2 0.4 0.6 0.8 1 1.2 1.4 1.6 1981 1982 1983 1984 1985 1986 1987 1988 1989 1990 year a v e ra g e a n n u a l fl o w ( m 3 /s )
measured flow 1/4 precipitation swat flow
0 0.5 1 1.5 2 2.5 3 3.5 4 4.5 5 1985 1986 1987 1988 1989 1990 year a v e ra g e a n n u a l fl o w ( m 3 /s )
measured flow 1/4 precipitation swat flow
Figure 5: Figueira e Barros Station - Maranhão Basin
0 3 6 9 12 15 18 21 24 27 30 33 1952 1953 1954 1955 1956 1957 1958 1959 1960 1961 1962 1963 1964 1965 1966 year a v e ra g e a n n u a l fl o w ( m 3 /s )
measured flow 1/3 precipitation swat flow
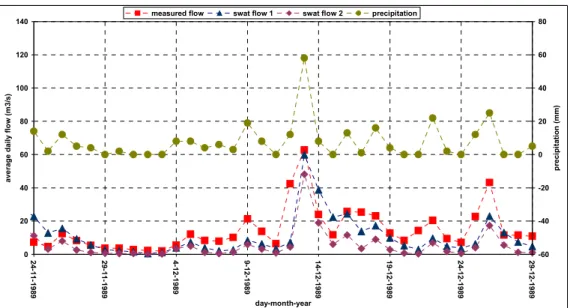
0 20 40 60 80 100 120 140 2 4 -1 1 -1 9 8 9 2 9 -1 1 -1 9 8 9 4 -1 2 -1 9 8 9 9 -1 2 -1 9 8 9 1 4 -1 2 -1 9 8 9 1 9 -1 2 -1 9 8 9 2 4 -1 2 -1 9 8 9 2 9 -1 2 -1 9 8 9 day-month-year a v e ra g e d a il y f lo w ( m 3 /s ) -60 -40 -20 0 20 40 60 80 p re c ip it a ti o n ( m m )
measured flow swat flow 1 swat flow 2 precipitation
t
Figure 7: Couto Andreios Station - Maranhão Basin
0 20 40 60 80 100 120 140 160 180 200 220 240 260 1 0 -1 1 -1 9 8 9 1 5 -1 1 -1 9 8 9 2 0 -1 1 -1 9 8 9 2 5 -1 1 -1 9 8 9 3 0 -1 1 -1 9 8 9 5 -1 2 -1 9 8 9 1 0 -1 2 -1 9 8 9 1 5 -1 2 -1 9 8 9 2 0 -1 2 -1 9 8 9 2 5 -1 2 -1 9 8 9 3 0 -1 2 -1 9 8 9 day-month-year a v e ra g e d a il y f lo w ( m 3 /s ) -200 -180 -160 -140 -120 -100 -80 -60 -40 -20 0 20 40 60 p re c ip it a ti o n ( m m )
measured flow swat flow 1 swat flow 2 precipitation
0 50 100 150 200 250 300 350 400 450 500 550 600 650 700 750 800 850 900 2 6 -1 2 -1 9 6 2 2 -1 -1 9 6 3 9 -1 -1 9 6 3 1 6 -1 -1 9 6 3 2 3 -1 -1 9 6 3 3 0 -1 -1 9 6 3 6 -2 -1 9 6 3 1 3 -2 -1 9 6 3 2 0 -2 -1 9 6 3 2 7 -2 -1 9 6 3 6 -3 -1 9 6 3 1 3 -3 -1 9 6 3 2 0 -3 -1 9 6 3 2 7 -3 -1 9 6 3 3 -4 -1 9 6 3 1 0 -4 -1 9 6 3 day-month-year a v e ra g e d a il y f lo w ( m 3 /s ) -150 -135 -120 -105 -90 -75 -60 -45 -30 -15 0 15 30 45 60 75 p re c ip it a ti o n ( m m )
measured flow swat flow precipitation
Figure 9: Almourão Station - Pracana Basin
4 Discussions of Results and Conclusions
From figures 2 to 6 it can be seen that the annual average of the measured flows approache the annual average of the model results. In 1985 (and also in 1986 for “Couto Andreios“ station), an important difference between the model and measured values can be seen. On the other hand, 1/4 precipitation results agree quite well with the model results. Several explanations to this behaviour can be advanced: the model does not consider small ponds and reservoirs that can have discharged large amounts of water in that year due to short but intense episodes of precipitation. Other explanation possible is some problem with measurements has occurred in that year.
In figures 7 to 9 it can be seen that the majority of the measured flow peaks coincide with the model peaks, showing a correct delay precipitation of about 1 day. Other aspect is that the model slightly underestimates the flow values in some cases. It can be seen that in general the modelled values compares well with the measurements.
There are several factors that contribute to these differences: only one soil type and use was considered; the water used for irrigation was also not included. This was adopted because the available data was not enough to included further refinements.
In the future the data bases for these systems will be enlarged to enable further simulations refinements.
5 Acknowledgments
INAG (Portuguese National Water Authority), for permitted the consult and use of data bases, IMAR (Institute Marine Research) and CIMA (Environmental and Marine Research Center).
References
[1] Heidenreich, Lynn K., Yan Zhou, and Tony Prato, Economic and Environmental Assessment of Alternative Farming Systems at the Watershed Scale, CARES Research ReporNo.19, 1995.
[2] Knox, J.W., Weatherhead, E.K. and Hess, T.M, Integrating spatial data, GIS and a computer model to improve the management and planning of water resources for irrigated agriculture in England and Wales, 2001. In, Belward, A., Binaghi, E., Brivo, A., Lanzarone, G.A. and Tosi, G. (Eds), International workshop on geo-spatial knowledge processing for natural resources management, June 28 - 29, 2001. Varese, Italy. EU Joint Research Centre, Ispra, Italy. pp29-34.
[3] S.L. Neitsch, J.G. Arnold, J.R. Kiniry, J.R. Williams, Soil and Water Assessement Tool, User’s Manual, 2000.
[4] Srinivasan, R. and J.G. Arnold, Integration of a basin-scale water quality model with GIS, Water Resources Bulletin, 30(3): 453-462, 1995.
[5] K.E. Saxton et al., Estimating generalized soil-water characteristics from texture. Soil Sci. Soc. Amer. J. 50(4):1031-1036, 1986.
[6] The Commission of the European Communities, Directorate General for Agriculture, Coordination of Agricultural Research, "Soil Map of the European Communities at 1:1 000 000. The Office for Official Publications of the European Communities, ISBN 92-825-5427-9, L-2985 Luxembourg, 124 pages, 1985.
[7] Portuguese National Water Authority (INAG),
www.inag.pt
[8] Shuttle Radar Topography Mission (SRTM),