M
ASTER
E
CONOMICS
M
ASTER
´
S
F
INAL
W
ORK
D
ISSERTATION
C
ONTINGENT VALUATION OF LANDSCAPE BEAUTY
:
A
CASE STUDY OF LAGOA DE ÓBIDOS
D
IOGO
F
RANCISCO
D
O
N
ASCIMENTO E
C
ARVALHO
M
ASTER
E
CONOMICS
M
ASTER
´
S
F
INAL
W
ORK
D
ISSERTATION
C
ONTINGENT VALUATION OF LANDSCAPE BEAUTY
:
A
CASE STUDY OF LAGOA DE ÓBIDOS
D
IOGO
F
RANCISCO
D
O
N
ASCIMENTO E
C
ARVALHO
S
UPERVISION:
P
ROFESSORM
ANUELF
RANCISCOP
ACHECOC
OELHO“Imagens que passais pela retina Dos meus olhos, porque não vos fixais? Que passais como a água cristalina Por uma fonte para nunca mais!...
Ou para o lago escuro onde termina Vosso curso, silente de juncais, E o vago medo angustioso domina, -Porque ides sem mim, não me levais?
Sem vós o que são os meus olhos abertos? -O espelho inútil, meus olhos pagãos! Aridez de sucessivos desertos...
Fica sequer, sombra das minhas mãos, Flexão casual de meus dedos incertos, -Estranha sombra em movimentos vãos.”
Camilo Pessanha In “Clepsidra”
Abstract, Keywords and JEL Codes Abstract:
Landscape beauty should no longer be subjected to a subjective valuation. An objective approach of the landscape beauty, for measuring its economic benefits in human well-being should be adopted in public policies and decision-making processes. In the Economic field, landscape beauty is an undeveloped concept, left for further elaboration in every discussion. The chosen valuation framework goes further in the analysis and starts by framing the economic field regarding the landscape beauty and the definition of landscape in order to better understand and evaluate the beauty of a landscape. This study analyses the economic valuation of the beauty of Lagoa de Óbidos’ landscape through the application of the direct approach of Contingent Valuation Method (CVM). To support the CVM, we have designed a questionnaire that made it possible not only to find the consumers’ willingness to pay, but also to achieve the Total Economic Value of landscape beauty.
Keywords: Ecosystem Services; Landscape beauty; Landscape view; Total Economic
Value; Willingness to pay; Contingent Valuation Method; Non-market service;
TABLE OF CONTENTS
Abstract, Keywords and JEL Codes I
Table of Figures III
Acknowledgments IV
1. Introduction 1
2. Theoretical framework 2
2.1. Ecosystem Service 2
2.2. Landscape categorization 4
2.3. Landscape view definition 5
2.4. Market problem 6
2.5. Measuring the economic value 8
2.6. Valuation Method 10
3. Contingent Valuation Method Methodology 12
4. Case study – Lagoa de Óbidos 14
4.1. Questionnaire 15
4.2. Global results 21
4.3. Analysis of the results 27
4.4. Total Economic Value of the beauty of Lagoa de Óbidos 31
5. Conclusion 32
Bibliography 34
Table of Figures
Fig 1 - Relationship between ecosystems and the human system. An adaptation from (Brown, Bergstrom, and Loomis 2007) ... 10 Figure 2 - Lagoa de Óbidos location ... 15
Acknowledgments
To Professor Manuel Francisco Pacheco Coelho for the guidance, support and encouragement during the dissertation process. Thank you for the enthusiasm which you placed in the dissertation and for trusting me.
To my family. Thank you for the encouragement and the strength you have given me to achieve my goals and overcome every obstacle.
To Rita, for being so loving and helpful during my life and especially during this process.
To my work colleagues, for supporting me during this stressful period.
To all respondents for the collaboration, time and patience.
To my professors, colleague and friends which contributed during my academic life for my personal and professional growth.
1. Introduction
Every day the beauty of different landscapes is sought and consumed by several individuals who, from this consumption, extract different sensations such as inspiration, nostalgia, memories, comfort and others. However, most individuals do not have the perception of consuming something like the beauty of a landscape.
The beauty of a landscape constitutes a social welfare that is usually measured as qualitative rather than quantitative. The lack of an objective measure for the beauty of a landscape leads to an undervaluation and, ultimately, can cause the deterioration of environmental goods and services. As a result, the policies affecting the beauty of a landscape could benefit greatly from the use of a more objective measure. In this framework, we will analyse a landscape’s beauty from the economic perspective and their benefits to human well-being.
I was born in Foz do Arelho and have been living there ever since. Therefore, Lagoa de Óbidos ecosystem and its stories are part of my life. This lagoon, which I’m so familiar with is, from my perspective, a great example of the effect that public policies have on the social welfare produced by the beauty of a landscape. Thus, I thought it would be great to use Lagos de Óbidos’ landscape a case study in order measure the impact of its beauty on the human well-being.
The present investigation proceeds as follows. In section 2, we describe the theoretical framework adopted. This section starts by framing the concept of landscape beauty as well as those of ecosystem service, landscape categorization and landscape definition. It then explains the market problem and the economic measure of these environmental services. In section 3, the valuation method applied to measuring the beauty of Lagoa de Óbidos is described and its applicability is discussed. In section 4, we introduce our case study, the questionnaire to obtain the willingness to pay is presented and the global results of the survey are shown. Then, comes the analysis of the results and the presentation of Total Economic Value of the beauty of Lagoa de Óbidos that we have found. In section 5, we present the conclusions of this study and present some suggestions for future research regarding the matter.
2. Theoretical framework 2.1. Ecosystem Service
Ecosystem Service is strongly linked to Ecology. Indeed, Ecological Economics is a school of thought oriented to the relationships between ecosystem and economic analysis. Those relationships were not well covered by other fields of thinking and Ecological Economics appears to answers the overlaps (Robert Costanza 1989).
Ecosystem service research gained importance in the past two decades and the number of papers related to the topic had an exponentially increase ever since (Fisher, Turner, and Morling 2009; de Groot et al. 2010; Turner et al. 2003). The motivation and importance of the increasing number of studies is supporting policy and decision-making with a better and comprehensive information base (Turner et al. 2003).
Initially, the term “ecosystem service” was brought by Ehrlich, P.R. and Ehrlich, A.H. (1981). Later, Daily (1997) defined the ecosystem service as “(…) the conditions and processes through which natural ecosystems, and the species that make them up, sustain and fulfil human life”1. The author starts to distinguish between ecosystem services and ecosystem goods, an idea later supported by Brown, Bergstrom, and Loomis (2007). In the same year, Robert Costanza et al. (1997) defined the ecosystem service as “the benefits human populations derive, directly or indirectly, from ecosystem functions”2. The authors refer both to ecosystem services and goods as “ecosystem services” to simplify.
The term “ecosystem services” gained notability after the release of Millennium Ecosystem Assessment (2005). This work contributed to the understanding and use of the concept of ecosystem service and its classification system, which resulted in an increased interest for the field (Fisher, Turner, and Morling 2009; de Groot et al. 2010). Indeed, the ecosystem service is a field that embraces several sciences, including Ecology, Economy and Biology (Boyd 2007; Boyd and Banzhaf 2007; Braat and de Groot 2012; Fisher et al. 2008; Fisher, Turner, and Morling 2009).
1 See Nature's Services: Societal Dependence on Natural Ecosystems from Island Press, Washington DC, page 3 line
5.
The contribution of the ecosystem to improve human well-being is an anthropocentric concept (Boyd and Banzhaf 2007; R. Costanza et al. 1998; Fisher et al. 2008; Fisher, Turner, and Morling 2009; Mendes 2004; Wallace 2007). So, Millennium Ecosystem Assessment (2005) developed a definition of ecosystem service as “the benefits people obtained from ecosystem”3. Alternatively, Boyd and Banzhaf (2007) provided a definition of final ecosystem services: “Final ecosystem services are components of nature, directly enjoyed, consumed, or used to yield human well-being4”.
Brown, Bergstrom, and Loomis (2007), supporting the idea of distinguishing between ecosystem service and ecosystem goods, defined the first as “the specific results of those processes that either directly sustain or enhance human life (…) or maintain the quality of ecosystem goods5”.
Fisher et al. (2008) related Ecology and Economy using the economic model developed by Pearce (2007) to connect ecosystem services with the human well-being and with its respective demand and supply curve of the ecosystem. After, Fisher, Turner, and Morling (2009) reached to a definition of ecosystem service as “the aspects of ecosystems utilized (actively or passively) to produce human well-being6.”
Following the Millennium Ecosystem Assessment (2005) definition, in 2010 the Economics of Ecosystems and Biodiversity (TEEB) of the United Nations Environment Programme defined the ecosystem service as “the direct and indirect contributions of ecosystem to human well-being7” (TEEB Foundations 2010).
It is widely accepted in the research community that if one wants to classify an environmental amenity, then there are certain necessary elements, namely a clear consumer’s perception of the resource, aligned with the natural assets of the ecosystem service and answers to implement the valuation information. The definition of ecosystem
3 See Ecosystems and Human Well-being - Biodiversity Synthesis, page 1.
4 See What are ecosystem services? The need for standardized environmental accounting units, page 619. 5 See Defining, Valuing, and Providing Ecosystem Goods and Services page 332 line 11.
6 See Defining and classifying ecosystem services for decision making. Ecological Economics page 645. 7 See The Economics of Ecosystems and Biodiversity (TEEB) 2010, page 33.
service is still open and requires contributions from the several fields involved (Braat and de Groot 2012; Smith 1993).
This framework will not cover the differences between ecosystem service and ecosystem goods, instead we will use Robert Costanza et al. (1997) approach, later supported by Millennium Ecosystem Assessment (2005) and TEEB (2010) not distinguishing between ecosystem services and ecosystem goods8.
2.2. Landscape categorization
Brown, Bergstrom, and Loomis (2007), established that ecosystem services are specific processes and gave us the example of “Pollination of crops and natural vegetation” or “Partial stabilization of climate”. They argue that ecosystem goods or services are two different categories and distinguish the ecosystem goods in two groups: renewable and non-renewable. According to the author’s perspective, the renewable ecosystem goods are able to be permanently consumed if the stock is managed in a sustainable way. As for the non-renewable ecosystem goods, in other hand, the authors argue that they can only be used one time. They defined the landscape view as ecosystem goods and, categorized the aesthetic9 as a renewable good.
Alternatively, Millennium Ecosystem Assessment (2005) developed a categorization of ecosystem service as “provisioning services (…); regulating services (…); cultural services such as recreation, aesthetic enjoyment, and spiritual fulfilment; and supporting services (…)”10. According to the categories of ecosystem service, the cultural service contains the landscape view as one can relate with spiritual values, ecotourism or aesthetic values. In the same way, Wallace (2007) proposes a classification of ecosystem service using the approach of Millennium Ecosystem Assessment (2005) yet, instead of focusing in categorizing the type of service, his main focus was in the specific human values that
8 Brown, Bergstrom, and Loomis (2007), strongly disagree to not distinguish both, services and goods. They argue that
using the ecosystem as a whole will help in the moment but “tend to blur the distinguish between the functional nature of ecosystem services and the concrete nature of ecosystem
goods.” See Defining, Valuing, and Providing Ecosystem Goods and Services page 331 line 21. This framework will not focus in distinguishing between services and goods because the landscape view is, in our understanding, an ecosystem service.
9 The authors give the landscape beauty as an example of aesthetic renewable ecosystem good. 10 See Ecosystems and Human Well-being - Biodiversity Synthesis, page 1
they support11. de Groot et al. (2010) uses Millennium Ecosystem Assessment (2005) to support another classification of ecosystem service. In fact, they proposed the following ecosystem services: Provisioning, Regulating, Habitat or supporting and Cultural and amenity (i.e.Aesthetic, recreational, spiritual and religious inspiration). Among all the classifications of ecosystem service, the socio-cultural fulfilment or cultural service is an ambiguous classification that requires considerable further development12.
Through Wallace's (2007) categorization, we easily associate the landscape view, taken as a human well-being value, with socio-cultural fulfilment - the ecosystem service is the spiritual/philosophical contentment and aesthetic. In other hand, the ecosystem process is the management of “beauty” at a landscape.
2.3. Landscape view definition
The landscape view or aesthetic (beauty) is a visual asset of the environment (Prieur 2006) and we will treat it as an ecosystem service (de Groot et al. 2010; Millennium Ecosystem Assessment 2005; Wallace 2007). We will use and adapt the definition brought by Millennium Ecosystem Assessment (2005) and developed by Wallace (2007) and de Groot et al. (2010) in our study of the economic value of a landscape view. We believe that the landscape view, as we want to study it, taken as an aesthetic and socio-cultural form of fulfilment suites perfectly as an ecosystem service and supports Boyd and Banzhaf (2007) definition of final ecosystem service. Upon this analysis we cannot accept Brown, Bergstrom, and Loomis (2007) classification of landscape beauty, namely as a renewable ecosystem good, because we believe the beauty of a landscape is neither stocked, nor managed in a sustainable way.
The landscape view or beauty is a concept that has been subject to a wide debate over time, from ancient times to modern-day for philosophers, artists, architects and policymakers. The definition and concept of landscape were not consensual, and several meanings have been suggested with variations according to the field and analysis in which
11 The classification proposed by Wallace 2007, is more accurate in the point of view of this framework to treat the
landscape view as an ecosystem service. Boyd and Banzhaf 2007, bring the ideia of end-product, the “ecological components directly consumed or enjoyed to produce human well-being” and this presume a change in the final stage of consumption.
they were studied. Andrew Lothian, in 1999, brought the following question “Is landscape quality inherit in the landscape or in the eye of the beholder?”. From this question, Lothian presents two contrasting paradigms of landscape perception: one was an objectivist and the other, subjectivist. These paradigms diverged on how they see the landscape beauty; in the objectivist, the beauty arises from an attribute of the physical characteristics and in the subjectivist, the beauty arises from the perception by the human brain of the physical landscape (Lothian 1999; Loures et al. 2015).
In 2000, the Council of Europe, in order to have wider consensus on the definition of the landscape, defined the landscape as “an area, as perceived by people, whose character is the result of the action and interaction of natural and/or human factors13” (Council of Europe 2000). Later, Daniel (2001), states the beauty14 of the landscape “arises from the relationship between properties of the landscape and the effect of those properties on human views15”. From the Economics perspective, the beauty of the landscape is valued for its aesthetic characteristics and their effect on human well-being. (Daniel 2001; Hanley et al. 2009)
2.4. Market problem
Ecological Economics’ school of thought is oriented to economic efficiency and sustainability and considers the effects in the non-market goods through the consumption of the market goods (Robert Costanza 1989; Drupp et al. 2018; Ebert 2003). The consumption of these types of goods is given by a fixed quantity in which they are not influenced by consumers. The analysis of these non-market goods is comparable to public goods. The ecosystem services are far away from having an accurate value and most of them are considered as public goods (David 2017; Drupp et al. 2018; Ebert 2003; Fisher et al. 2008; Hanley et al. 2009; Verbič, Slabe-Erker, and Klun 2016).
The landscape view value is analysed as a public good. Once the consumption of the landscape service assumes the same characteristics, the consumption is indivisible, non-excluded and non-rival. (Hanley et al. 2009; Verbič, Slabe-Erker, and Klun 2016). There
13 See European Landscape Convention, Florence 2000, European Treaty Series - No. 176, page 2. 14 In the original study, the author uses the word “landscape quality” instead of the beauty of the landscape. 15 See Whither scenic beauty? Visual landscape quality assessment in the 21st century, page 268.
is no modification. Once a landscape view is consumed, it does not diminish the amount available for others and it is open access. So, there is no exclusion from enjoying the benefits from the landscape (Tom Tietenberg; Lynne Lewis 2012).
The landscape view is a non-market amenity of the ecosystem, and in it we must consider all tangible assets i.e. trees, lakes, hills, buildings as part of the landscape view service. The economic benefit of a non-market service is greater than that of a tradable service. The benefits of non-market services involve market services benefits, and they arise from the benefits of landscape, biodiversity, water purification to the benefits of planting trees to produce timber (David 2017; Fisher et al. 2008; Pearce 2007). Non-market services have no boundaries and normally are public goods, so the market will not provide the optimal level of ecosystem services provision. Therefore, if we only consider the ecosystem’s market services benefits, we are under evaluating the ecosystem services benefits. Once the non-market services do not know the boundaries, they include the benefits of the market services and are difficult to measure. The economic cost of the tradable services is lower than the economic cost of non-market services. Therefore, if we only consider the economic cost of the market services, we are jeopardising the non-market services. And lower than the economics cost of the non-market services, the ecosystem service goes near the safe minimum standard16 which is close to an uncertain path that can lead to a collapse of the ecosystem (Fisher et al. 2008).
Once the landscape view is considered a public good and, therefore, is not traded in the market, it does not have a market price to signal their value. So, a virtual price must be in place to deduce the missing market price. The public policy should meet the effect of policies on an ecosystem service and be used to enable prediction of the policies most likely to have a positive impact on social benefits and sustainable development (Boyd 2007; Drupp et al. 2018). How will the management of a forest or a construction of a Hydro-Electric Dam affect a landscape? Economists must work together with other fields like Biology, Hydrology or/and Ecology to provide such sort of answers. Several times, we noticed that landscapes have vanished due to the increase of profitable activities, for
16 Safe Minimum Standard (SMS) is a term introduced by Fisher et. al (2008) to refers the minimum required to
example oil drilling, mining activities or dam construction17 or the simple fact that the preservation was unworthy.
2.5. Measuring the economic value
Market economy is able to count units in order to find the value or to measure worth i.e. cars, houses, transportation services, software services etc. In a non-market economy as the landscape, nature cannot be packaged or counted in the same way. So, in order to count, we need to measure the benefits that arise from the ecosystem service. Effectively, the ecosystem service is countable if the welfare is to be comprehensively measured (Boyd 2007). Therefore, ecosystem value becomes impossible to achieve when human benefits are impossible to measure.
From an economist’s point of view, the economic value of the landscape beauty is related to its contribution to human well-being, regarding benefits of choice of preservation or destruction of a landscape. To satisfy and understand the preservation of an ecosystem service, an economist must ask how does an ecosystem service benefits society. And to know how it does so, one needs to clearly define the ecosystem service and how market consumption affects the consumption of ecosystem services like landscapes. Indeed, economists require society to articulate and understand trade-off, measure performance and maximize social benefits of environmental assets. Environmental assets must be taken in consideration in economic and monetary discussions in order to track the provision of nature’s benefits over time (Boyd 2007).
Evaluating environmental amenities such as the landscape beauty is a difficult assignment, once the service tradable do not have market making it impossible to observe any price. So, even if the consumers pay a price it will not reflect their preferences and willingness to pay (Ebert 2003). Consequently, to estimate the value of non-market goods
17 “Alto Douro Wine Region” was considered by the World Heritage Committee (WHC) of UNESCO, in 2001, as a
Cultural Landscape therefore being one of the three landscapes in Portugal considered like that. The NGOs “Platform Save the Tua” was opposed to the construction of the Foz Tua Hydro-Electric Dam project, arguing the imminent destruction of Tua valley and its historic railway line, due to the construction of the Foz Tua dam (Platform Save the Tua 2012). The WHC in 37th analysed the NGOs concern and concluded that the “that the Outstanding Universal Value
of the property has not been irreversibly affected by the Foz Tua Hydro-Electric Dam project as amended following the recommendations of the mission, and that the overall state of conservation of the property is satisfactory but vulnerable to incremental change and to infrastructural projects.” (UNESCO 2013 )
or service like these ones we must rely on the Total Economic Value (TEV) of the goods or services. Then, we are able to estimate the value of ecosystem services.
The TEV is constituted by use value, option value and non-use value. The use18 value includes the direct use value, and the indirect use value. Direct use value refers to the benefits that arise from the elements in the ecosystem services directly consumed, traded or incorporated in the production. Normally they are in the market economy; indirect use value refers to all the ecosystem services that provide a direct value to the human well-being.
Option value can be distinguished between option value and quasi-option value, and reflects the value an individual places on the uncertainty of an ecosystem’s future conditions, so option value is the individual’s willingness to pay to be certain about the availability of future ecosystem’s services; and quasi-option value is the individual’s willingness to pay for accurate information about the ecosystem services, currently non-existing.
Non-use value can be distinguished from existence value and bequest value. So, existence value is the moral or satisfaction that derives from the individual’s knowledge of an ecosystem’s persistence in the future, in the absence of any use; Bequest value is the willingness to pay to ensure that the ecosystem service is available for future generations (de Groot et al. 2010; Mendes 2004; OECD 1999; Tom Tietenberg; Lynne Lewis 2012). Landscape view does not have a direct cost of production or a fee of utilization associated. However, if there’s any price attached to the landscape view, it is regarding the preservation of the assets in the area or of economic activities. Therefore, market fails to place a proper value in the landscape view, and so non-market techniques such as contingent valuation are used to estimate that value (David 2017; Mendes 2004; Mendes, Sardinha, and Milheiras 2013; Smith 1993; Verbič, Slabe-Erker, and Klun 2016).
18 If an individual uses one of our 5 senses – sight, sound, touch, taste or smell – then they have used environmental
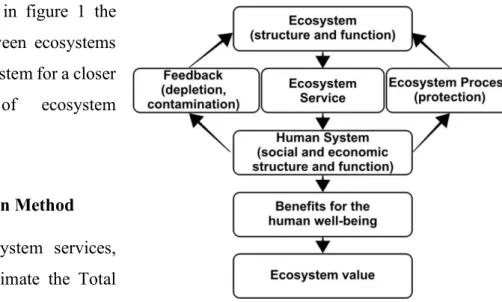
As can be seen in figure 1 the relationship between ecosystems and the human system for a closer understanding of ecosystem valuation:
2.6. Valuation Method
To valuate ecosystem services, one needs to estimate the Total Economic Value. If the ecosystem service is from a
market economy, the valuation is relatively straightforward. If the ecosystem service is from a non-market economy, it then requires the estimation, either direct or indirect, of the willingness to pay. The valuation of ecosystem services is distinguished from two valuation techniques: 1) when people perceive the value of ecosystem services and 2) when people do not perceive the benefits of ecosystem services.
When people perceive the value of ecosystem services, to measure the value of preference of consumption or preservation of an ecosystem service – or an environmental resource –, we have two categories of valuation methods, which are stated preference and revealed preference methods. Each of these categories include two types of techniques: direct or indirect.
Revealed preference methods are those that consider “observable” choices from a
real/traditional market and do not estimate a value. Instead, the method infers a value. This method measures the resources directly through market price or simulated market and uses travel cost, hedonic property values, hedonic wage and avoidance expenditures to measure indirectly. Market price allows us to measure environmental resources through observation and to infer value from the price. Simulated market uses the same observation from a market, however in a virtual market. Travel cost is used to infer the value of the resource through a demand curve obtained from information on how much the consumer spends to reach the place. Hedonic property method uses market prices of Fig 1 –Relationship between ecosystems and the human system. An adaptation from (Brown, Bergstrom, and Loomis 2007)
the good and then distinguishes the information to similar categories and allows the observation of the marginal willingness to pay for discrete levels in a good or service. This method reveals a value based on the quality of the good. Hedonic wage methods aim to isolate the environmental good or service from the levels of wage and infer the amount of compensation employees require to perform a labour undertaking risk. The averting expenditures are the action performed to prevent or reduce damage from pollution. The stated preference methods derive to find the marginal improvement or the marginal loss from the willingness to pay, or the willingness to accept, using experiences or surveys. The direct approach is the contingent valuation method that simulates a virtual market for the environmental resource or ecosystem with similar characteristics of the real/traditional market. The indirect approaches are the attribute-based method, conjoint analysis, choice experiments and contingent ranking. The attribute-based method is similar to conjoint analysis or choice experiments and they use a bundle of different levels of characteristics. The survey uses the alternatively bundle with similar characteristics. Once the price of the similar bundle is settled, one can arrive to an identical willingness to pay. The contingent ranking also uses the survey to estimate value but this method uses a rank-order of the environmental resources and compares the implicit trade-off of them (Van den Belt, Forgie, and Farley 2011; Christie et al. 2008; Tom Tietenberg; Lynne Lewis 2012).
To evaluate environmental services or goods, there are a few studies such as Davis R (1963)19 with the value of the big game hunting in Maine; our alumni Figueira (1994), with water quality public management of Sardoal village; Birol, Karousakis, and Koundouri (2006) with water resources management; Hanley et al. (2009) with the investigation of the “knowledge of the past” influences the preferences and values about future landscape; Mendes, Sardinha, and Milheiras (2013) with the value of the rehabilitation of the mining fields of São Domingo’s mine and, lastly, Loures et al. (2015) with the analysis of aesthetic quality and economic valuation of the Lower Guadiana river landscape, through a qualitative valuation. David (1963) was the first to conduct a Contingent Valuation Method in an environmental amenity.
3. Contingent Valuation Method Methodology
In this framework, we will be using the Contingent Valuation Method (CVM). This technique is normally applied to estimate the value of non-market goods and services, based on each individual’s willingness to pay. Since we are studying an ecosystem service, namely the landscape view or beauty, we believe that this method is the most adequate. CVM consists of obtaining the preferences of the individuals, in monetary terms, in modifications in quality or quantity of a hypothetical landscape view market demonstrated by their response of a questionnaire. The hypothetical landscape view market aims to analyse changes in human well-fare by uncovering the maximum willingness to pay or minimum willingness to accept of each inquired, for an increase or decrease level of landscape view quality. The Total Economic Value of the landscape view is given by WTP and WTA. For the WTP and WTA in order to have the necessary information to measure the economic value of landscape view, the questionnaires must contain information of the use, non-use or option use of the landscape view, otherwise the results will be biased (Birol, Karousakis, and Koundouri 2006; Brown, Bergstrom, and Loomis 2007; Champ, Boyle, and Brown 2003; Daniel et al. 1989; Hanley et al. 2009; Mendes, Sardinha, and Milheiras 2013; Tom Tietenberg; Lynne Lewis 2012; Verbič, Slabe-Erker, and Klun 2016).
The main virtues of the CVM are its capability of estimating the Total Economic Value – use value, non-use value and option value - of an environmental resource and of estimating the economic value when other approaches aren’t practicable – inexistent substitute markets and distorted real markets. Once we are studying a non-market service, the distinction between the type of value is difficult, especially between option value and existence value.
The limitations of the CVM are: 1) having a hypothetical market, 2) the quality of the information, 3) high cost of research and 4) bias. Indeed, the hypothetical market must have a well-defined conception, because if the idea of it isn’t flawless, the information will be compromised. During the collection of data, the surveyed will provide different answers based on his/her own idea of the market, therefore answers will vary according
to the market conception. The quality of the information must be clear and pleasant to avoid having no answers or “yeah-saying” responses. The query must appeal to the respondents, because if the query is too long or confuse, the respondent will be discouraged. During the construction of the query, the researcher must keep in mind that the respondent is not used to evaluate non-market goods or services, so the questions must be precise and resumed to the essential so that the inquired is not demotivated by too much information. The high cost of research is due to the test phase, the development of a distinct questionnaire and testing several questionnaires to obtain a considerable amount of answers. The bias can exist due to the idea of the good or service; lack of comprehension of the hypothetical market; or even the stage of life or well-being of the inquired at the moment they are surveyed.
In the CVM, there is a concern with potential biased responses of the surveyed and the type of bias can be: (1) strategic – which translates in the feeling of having an obligation to pay for the good; (2) information – for the quality of the hypothetical scenario can mislead the respondent’s answers; (3) starting-point – related to the impact of the bidding game in the surveyed; (4) hypothetical – which results from the hypothetical nature of the scenarios and can lead to inaccurate values of preference; (5) discrepancy of WTP and WTA – since normally the WTP is smaller to the WTA, when the inquired face the WTP question, they are taking in consideration their budget constraints and state the value near his/her own intensity of desire for the good or service in the analysis; when the respondents face the WTA question, they normally declare a value less precise or less considerable. Economic studies suggest they should be the same (Tom Tietenberg; Lynne Lewis 2012); (6) payment vehicle bias – is the respondent’s prejudice of the payment vehicle; (7) interviewer bias – is the interference of the interviewer’s behaviour in the survey answer; (8) context bias – can lead to more services or goods than ones that are being taken into consideration; (9) aggregation bias – is the problem of extrapolating the respondents’ answers.
To conduct the CVM properly, one needs to identify accurately the change in the quality of the landscape and the values to be estimated, as well as to select the data collection
mode and establish the sample size20. This information must be contained in the survey (Champ, Boyle, and Brown 2003). Moreover, the limitation and the biases must be taken into consideration when designing the questionnaire and during the interviews.
After identifying the change in quality to estimate, the values to be estimated, the data collection mode and sample size, the design of the survey must contain a clear description of the scenarios, the payment vehicle and the time frame of payment. The answers of the survey must allow us to reach the welfare of each individual of the sample at the moment the survey is displayed, and we should be able to estimate the TEV of the environmental amenity.
So as to estimate the TEV for the applicable population at the moment the survey is displayed, t, the sum of the average willingness to pay in each scenario, WTP, times the applicable population, N.
(1) TEVt= ∑ 𝑊𝑇𝑃𝑡× N
4. Case study – Lagoa de Óbidos
In our framework, we have applied the CVM for measuring the beauty of Lagoa de Óbidos’ landscape. Lagoa de Óbidos is the largest lagoon in the Portuguese shore with a surface area of approximately of 6,9 km2 and a perimeter of 17 km. It is connected with the sea through a movable canal that occasionally closes, which requires human intervention. This lagoon has a massive ecological impact, is home to more than 40 bird species and approximately 20 species of fish and shellfish. Furthermore, it has a significant socio-economic impact since hundreds of individuals work in fields of activity directly or indirectly related to the lagoon or its surroundings. Its paramount importance for the locals is well described by the popular saying “the lagoon provides meat, bread and wine21”.
20 The sample size of a landscape view is difficult to establish once the landscape view has no borders and no sensorial
limitation
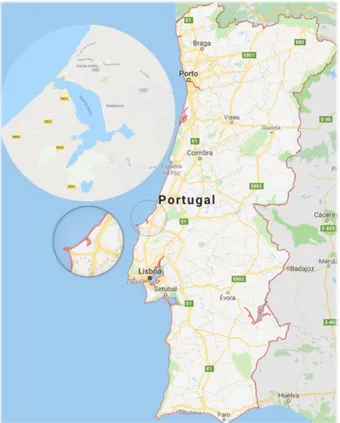
Lagoa de Óbidos is approximately 50 km far from Leiria, capital of district, and approximately 90 km far from Lisbon, capital of Portugal. This natural lagoon system is located in Centro Region of Portugal, between two councils and acting as a frontier for four parishes. In the north side is the council of Caldas da Rainha, the parish of Foz do Arelho and Nadadouro and in the south side is the council of Óbidos and the parish of Santa Maria, São Pedro e Sobral da Lagoa and Vau. The north parish has a population of 3.243 citizens while the south parish
has a population of 4.731 individuals. Both councils have an aggregated population of 63.501 individuals. Still, in populational terms, the district of Leiria has a total of 470.995 individuals and the entire Centro Region has 2.327.755 individuals, which represents 22% of the total population of Portugal, according to Instituto Nacional de Estatística 2012.
Every day Lagoa de Óbidos is visited by individuals for the sole purposes of “consuming” and enjoying the beauty of its landscape, from which they benefit and derive utility. In this framework, we consider, within the landscape beauty scale, all visible components of the lagoon, namely the lagoon itself, its coast, the wildlife and vegetation and its surrounding properties regardless of their ownership (public or private) and other visible aspects.
4.1. Questionnaire
The questionnaire22 was designed to collect information about the beauty of Lagoa de Óbidos’ landscape and helps in assessing its economic value. The questionnaire aims to
22 Appendix 1
Fig 2 - Lagoa de Óbidos location
measure the well-being deriving from the beauty of the landscape and the impact of the changes in the landscape quality. In order to obtain a questionnaire sufficiently suitable and accurate to answer the research question, the form was tested, in an early stage, by five individuals. That allowed us to identify improvement opportunities by either eliminating or reformulating the questions, making it easier to make respondents understand and motivating them to answer all the questions.
Given that the beauty of a landscape is a rare concept and that normally individuals do not think about it in economic terms, the questionnaires were completed through individual interviews. Although this method results in fewer replies than other types of query distribution, the answers were more accurate as the researcher was able to provide additional information to the respondent. This data helped supplement the questionnaire and refocus the attention of the respondent solely on the beauty of the landscape, according to the possibilities of the landscape use and avoiding them to deviate from the premises that were presented to them.
We started the questionnaire with two questions to categorize individuals by type. From the first question onwards, we were able to identify and enumerate their preferences regarding four types of landscape – 1) natural, 2) agricultural, 3) rural and 4) urban – and the variance between such preferences. The declaration of their preferences does not mean that they dislike one type of landscape, it allows us to analyse the variation between the different landscapes and to understand how it will affect the willingness to pay. The second question was if the respondent had environmental concerns. Upon these two questions, we presented both the framework and our main goal: to find the economic value of the beauty of Lagoa de Óbidos’ landscape. In the introduction, we explained the concept of landscape beauty and the idea of it being consumed as well as that, through that consumption, several sensations could be obtained.
Upon the introduction, we started a roll of questions to categorize the respondent with furthermore detail. We started by asking them if they were familiar with our case study, Lagoa de Óbidos, asking “Do you know Lagoa de Óbidos?”. From this question onwards, we were able to identify the level of knowledge of Lagoa de Óbidos among the respondents.
Following the question “Reasons why you are looking for Lagoa de Óbidos”, the possible answers contemplated in the survey were: 1) for recreational/leisure, 2) for professional matters, 2) for environmental matters; 3) to practice sports or 4) other reasons – and the inquired should mention the reasons to choose “other reasons”.
After being asked, “By which means of transport do you usually get to Lagoa de Óbidos?” the options available for the respondents in the survey were; 1) on foot, 2) by private transportation or 3) by public transportation. The answers to this question were relevant as they allowed us to assess if the travel cost was a barrier to the consume of the beauty of the lagoon’s landscape.
Then, we asked about the frequency of the respondent’s interaction with the lagoon, “How often do you visit Lagoa de Óbidos, during Summertime?” and “How often do you visit Lagoa de Óbidos, during Wintertime?”. Respondents were able to choose one of the following options: 1) daily, 2) weekly, 3) monthly, 4) annually or 5) not frequently. By asking this question, we were looking for analysing seasonality and frequency together, aiming to measure how it could influence the respondents’ answers.
The following question was, “Do you appreciate Lagoa de Óbidos’ beauty?” and “Do you consider Lagoa de Óbidos’ beauty unique?”. The possible answers were binary (yes or no), although we wanted to see if the sensibility to the beauty and the unicity of the landscape influenced and how they influenced the respondents.
Closing up the first part of the survey, we asked two other personal questions: “What do you value the most in Lagoa de Óbidos?” and the replies to this question were of a free answer. Finally, the last question of this section was, in the respondent’s perspective, “Which factor do you consider more damaging to the beauty of Lagoa de Óbidos?”. The options available to this last question were: 1) siltation, 2) pollution – e.g. dry reeds, plastics, tyres and other types of thrash, construction near the lagoon or 3) others and which. We chose to mention these factors in the survey due to the fact that, from our understanding, both visitors and policymakers are concerned with it, and its effects in the lagoon’s “quotidian”.
Upon this round of questions, we presented another scenario and asked a few questions related to it, and, at last, requested personal information, namely: 1) age, 2) gender, 3) literacy, 4) gross monthly income, 5) occupation, 6) marital status, 7) household, 8) residency and 9) if the respondent is interested in the preservation of Lagoa de Óbidos’ landscape beauty. The reason why these questions were asked in the end, instead of appearing in the beginning of the survey, was to prevent the respondents from giving up answering to the query. With all these questions we were able to categorize and stress the economic value of the landscape in different hypothetical situations.
In the query, we’ve shown the respondents five different hypothetical scenarios, all independent between them. The respondents were almost effortlessly capable of associating each scenario with similar everyday circumstances. Since all of them were used to expend money, they were intuitively capable of quantifying the intensity of their desire for the preservation of Lagoa de Óbidos’ landscape beauty. Whenever the respondents weren’t able to quantify the scenarios, we used an interactive bidding game to nudge them to assert their willingness to pay, according to the corresponding scenario. Thanks to these scenarios, we were able to find several types of value: the option-value, existing value, non-use value and use value. That allowed us to derive to the Total Economic Value.
The scenarios had to be clear and precise so that the respondents were able to distinguish the various types of values related to it. It was, however, not easy for the respondents to identify the differences between the presented scenarios.
In order to enhance comprehension of each scenario’s applicability, we disregarded institutions or organizations that could be suited for accomplishing the hypothesis completion. If we were to specify an institution or an organization in order to aid the respondents to determine their willingness to pay, in each given scenario, inconsistencies could occur in the value revealed by the respondents. We could have tried choosing an institution or an organization in a neutral way, however by doing that we might have been influencing the desired value for each situation as the individual’s perception of the institution or organization could result in a biased response.
The first scenario was regarding the menace of destruction of the environmental resources. The deterioration of environmental resources affects the value of the ecosystem. Besides, deterioration can be a result of over-exploitation of the resource, pollution of the water or of the coast, environmental changes, pressure for construction or other factors that change the ecosystem. In this scenario, we asked if the respondent believed that the municipalities of Caldas da Rainha and Óbidos were worried about Lagoa de Óbidos’ ecosystem deterioration. Thanks to the answers on this question, we were able to recognise if the results of the public policies implemented affected landscape consumers’ understanding of the issue. The second question within these scenarios allowed us to find the option value of the beauty of the lagoon. In this question we asked how much the respondents were willing to pay, in a monthly basis, in order for the landscape beauty to be maintained in its current state. The possible payment method was through debit, similar to a gym or streaming service subscription. Therefore, in this question we requested the value to maintain the landscape beauty as it is nowadays, not to improve it – in order to prevent reaching to a biased value – once the current state of the landscape is of all respondents’ knowledge and the ways in which to improve it might vary subjectively.
The second scenario contemplates a cause of the destruction of the landscape beauty, the siltation. The siltation is a constantly discussed issue and is responsible for affecting, from many individuals’ point of view, Lagoa de Óbidos’ landscape beauty. First, we asked if the respondents considered that the siltation was causing the destruction of the landscape beauty. Upon this question, we asked them how much they were willing to pay in a monthly basis in order to avoid siltation and for the beauty of the landscape not to be affected by it. The possible payment method was, once again, through debit. In this question, we were also able to find the option value. However, we undersized the factors of deterioration of the beauty. In this scenario, we asked about the willingness to accept and presented the case of massive siltation affecting the lagoon, causing the landscape beauty to be totally transfigured. The reason behind the massive siltation was ignored so that the respondents could focus in the devastation of the landscape beauty, not on the cause, namely, if it was a public or private responsibility or if it resulted from a natural cause.
The third scenario allowed us to study the permeability of the respondent to the introduction of a fee. Additionally, we were able to discover the use value of the environmental resource. The scenario contemplated the implementation of a fee by the two borderline councils, Caldas da Rainha and Óbidos, to face the deterioration of the landscape due to the increasing number of landscape beauty enthusiasts. This type of enthusiasts would only consume the landscape beauty and nothing else. There were two types of fees. In the first question, the fee was to be applied to all individuals regardless of them being locals or not and, in the second question, the fee would only be valid for visitors.
Forth scenario envisioned the respondent’s concern for the next generations and allowed us to analyse the value of existence. The scenario assumed the menace of the destruction of the environmental resources as factual – the deterioration of the environmental resources occurred regardless of human impact. The question as how much the respondent was willing to pay, in a monthly basis, to ensure the preservation of the landscape beauty as they know it in the not to near future - more than two or three generations after ours. The possible payment method through which the respondents could contribute to finance the landscape preservation was debit. Note that this scenario is different from the first one, because here we are exploring the value of existence instead of the option value, so the respondent does not experience the consequences of the payment. In this case, we consider that the respondent is satisfied with the persistence of Lagoa de Óbidos’ beauty through time.
The fifth and last scenario was more demanding for the respondents as they were invited to imagine a hypothesis in which the landscape of Lagoa de Óbidos was circumscribed in an enclosure and couldn’t be appreciated and experienced unless they were willing to buy a ticket to have access to that precinct. In this case, we were analysing the direct value of use.
In this last scenario, we asked the respondents about their willingness to accept a compensation for being deprived of the contemplation of the landscape beauty, since their freedom to appreciate it was now constrained. Kindly note that the willingness to accept, in the current scenario, is different from the willingness to accept in second scenario. In
this case, Lagoa de Óbidos’ landscape beauty could still be appreciated but only if the ticket was bought. In the previous situation, Lagoa de Óbidos’ landscape had been totally transformed due to the siltation.
With this questionnaire, we were able to estimate the willingness to pay from the following function:
(2) 𝑊𝑇𝑃𝑖 = 𝑓(𝐾𝑖, 𝐴𝑖, 𝐺𝑖, 𝑌𝑖, 𝐿𝑖, 𝑅𝑖, 𝑃𝐿𝑖, 𝐹𝑖, 𝑈𝑖)
i - Individual
Ki – Knowledge of the lagoon
Ai – Age Gi – Gender Yi – Income Li – Literacy Ri – Residency PLi – Landscape preferences Fi – Frequency of visiting
Ui – Uniqueness of Lagoa de Óbidos
4.2. Global results
The questionnaire was administered to 71 individuals, during August 2019, and had a 100% response23 rate. The interviews were collected from a public call for those who wanted to do the interview. Some local associations were also contacted, and the study became known through word of mouth.
Personal information of the respondents is distributed as follows:
• Regarding the age range: the oldest respondent is 74 years old and the youngest, is 20 years old. Respondents’ average age is 39. The median age is 31 years old, and the majority of the respondents is 26 years old – 10% of the replies. 35% of the respondents are between 20 and 29 years old and 21% are between 30 and 49yo. 21% of the respondents are between 50 and 59yo, and 13% are older than 61.
• Regarding gender: 52% are males and 48% are females.
• As for the marital status: 3% are widow, 14% are divorced, 24% are married and 59% are single.
• Concerning the household size: 1% of the respondents have 5 to 7 members in the household. 17% are in a two-person household, 30% are in a household with between 3 to 4 members and 52% are in a one-person household.
• As for the literacy level of the respondents: a large range of studies was observed, that went from until Portuguese ninth grade to Master qualifications. With that being said, 6% of the respondents have studied until ninth grade and 28% has a master’s degree. Additionally, the most common academic degree among the replies is bachelor’s (42%). 20% of the respondents have completed High School and only 4% have a Postgraduate degree. Note that we are well aware that this distribution of literacy levels can bias the final result. Indeed, such a complex survey demands great understanding from the respondents and not everyone is capable of answering this type of hypothetical questions.
• As for the occupation of the respondents, we had a vast number of students, but also entrepreneurs, fisherman, lawyers, sports instructors, engineers, economists, digital technologies workers, assistants, waiters and retired persons.
• The gross monthly income24 of the respondents is 7 scales equivalent to the Portuguese personal income tax converted to monthly – less than €506,5; between €506,5 and €764,3; €764,31 and €1.447,20; €1.447,21 and €1.785,71; €1.785,71 and €2.632,5; €2.632, 51 and €5.760; and more than €5.760. The answers were, respectively: 4%, 7%, 45%, 17%, 11%, 4% and 2%. The remaining 10% of the respondents did not want to mention their monthly income.
• To complete the personal information, we asked the respondents’ residency. 54% live in the frontier parish with Lagoa de Óbidos: 38% in Foz do Arelho, 10% in Nadadouro and 6% in Santa Maria, São Pedro e Sobral da Lagoa. The other 46% of the respondents do not inhabit nearby Lagoa de Óbidos: 17% are resident in Caldas da Rainha, 15% in Lisboa, and 14% in other cities like Leiria, Santarém or Setúbal and abroad. The further from Lagoa de Óbidos was Barreiro – which is located approximately 130 km from Lagoa de Óbidos – and Switzerland.
All respondents claimed to be interested in the preservation of Lagoa de Óbidos’ landscape beauty.
After showing the respondents’ profiles, it is time to move on to the results concerning the respondent’s landscape preferences. The type of landscape most preferable was the
natural landscape – the choice of 87% of the respondents. 7% of the respondents chose
the rural landscape as their preference; 3% chose agricultural landscape and only 3% chose urban landscape as their first preferred type of landscape. The second most preferable type of landscape was rural landscape – chosen by 49% of the respondents, followed by urban landscape (23%). Next was the agricultural landscape (18%) and at last, the natural landscape (10%).
The third most preferable landscape for the respondents was the agricultural landscape (38% of the answers). 34% of the surveyed chose rural landscape and 28% selected urban landscape. None of the respondents mentioned the natural landscape as their third preference. The fourth most stated landscape preference was urban landscape (46% of the answers), next was the agricultural landscape (41%), which was followed by the rural landscape (10%). Only 3% of the respondents stated that the natural landscape was their fourth preferable type of landscape.
Regarding the environmental concerns of the respondents, 97% stated they were concerned about environmental issues and only 3% stated that they were not concerned with it. In this question, some respondents who claimed to be concerned with the environment stated that their behaviour doesn’t necessarily matches their worry, and half of the respondents who claimed that the environment was not among their concerns stated that the reason why they defined themselves as not concerned with environmental matters was because they didn’t act in an eco-friendly way.
All the respondents knew Lagoa de Óbidos, however, their purposes to search for the lagoon were different. The majority of the respondents, precisely 73%, said that they visit the lagoon for recreational/leisure purposes; 8,5% said that they go there for professional purposes; 8,5% visit it with environmental purposes; 3% visit Lagoa de Óbidos to practice sports and 7% of the respondents go to the lagoon for other reasons, such as to enjoy the beauty of its landscape or with spiritual/inspirational purposes and also, for family related matters.
The main answer to the question, “By which means of transport do you usually get to Lagoa de Óbidos?” was private transportation – the answer of 72% of the respondents. On average, those who usually go by car spend €6,35 on travel expenses. The maximum amount spent was €30 and the minimum, €0,50. The median value is €3, and the most frequent value is €1. 20% of the respondents spend more than the average in travel expenses. 27% of the respondents go there on foot. The most frequent distance performed is 1 kilometre, the maximum distance performed is 4 kilometres and the minimum distance is 3.000 meters. Almost all the respondents who go to the lagoon on foot are from the northern frontier parish of Lagoa de Óbidos, except one that measured the distance from their local accommodation. 1% of the respondents use public transportation and said they usually spend €2,6 to go to the lagoon.
During Summertime, the respondents who go to Lagoa de Óbidos on a daily basis are 34%, as well as those who go there weekly; those who go there monthly are 17%; 8% go there once or twice a year and those who do not go there frequently are 7% of the total respondents. Residents in the northern frontier parish go to the lagoon every day or on a weekly basis; those residing in Santa Maria, São Pedro e Sobral da Lagoa visit the lagoon almost every month.
During Wintertime, 25% of the respondents visit the lagoon every day; 35% go there weekly; 20% visit Lagoa de Óbidos monthly; 7% go there annually and those who do not go there frequently during Winter are 13%.
All the inquired claimed to be appreciative of Lagoa de Óbidos’ landscape beauty, however only 89% consider that beauty as being unique, and the other 11% think that its beauty can, somehow, be replicated in other similar landscapes.
To the question regarding what do the respondents think is the most valuable asset of Lagoa de Óbidos, we registered several different answers. In order to better analyse those answers, we placed them in different types of categories.
When the respondents mentioned “mirror of water” or “sunset” as the assets they considered as the most valuable in Lagoa de Óbidos, those responses were placed in the category “Landscape beauty”. We had a few respondents who answered “tranquillity”,
so we created the homonymous category, “Tranquillity” and categorized those answers that way; answers like “the immensity of water” or “the grandiosity of the lagoon”, were categorized as “Grandiosity of the lagoon”; answers like “ its ecosystem”, “the beach”, or “the versatility of the lagoon” were categorized as “Ecosystem”; answers like “the fauna of the lagoon” or “the flora”, “birds” and “biodiversity”, were categorized as
“Biodiversity”; answers such as “the proximity to the sea” were categorized as, “Connection to the sea”; answers such as “its suitability for the practice of water sports”,
were categorized as “Sports” and answers like “the typical boats” or “its sailing school”, that were very specific and had nothing to do with other replies were categorized as
“Others”. In short, the answers categorized as “Landscape beauty” were 38%; as
“Tranquillity” were 18%; as “Grandiosity of the lagoon” were 16%; as “Ecosystem” were 10%; as “Biodiversity” were 7%; as “Connection to the sea” were 4%; as “Sports” were 3% and categorized as “Others” we registered a total of 4% of answers.
According to the majority of the respondents (a total of 48%) the main factor that is jeopardizing the beauty of Lagoa de Óbidos is pollution – dry reeds, plastics, tyres and other types of thrash. 25% consider that the main cause behind the degradation of the landscape beauty is the construction near the lagoon and some of the respondents have stated that despite they agree with the construction nearby the lagoon, its nature and the normal course of winds and waters should be taken into account. 23% of the respondents consider the siltation as the main factor that is jeopardizing the beauty of the lagoon and only 4% consider none of the three factors mentioned as the main cause of degradation of its beauty: 4% consider the population and its actions as the main reason, others pointed out the cloudy weather and the camper park near the lagoon.
Moving up for the analysis25 of the designed scenarios, it’s imperative to say that the first scenario, regarding the menace of destruction of the environmental resources, had a total of 45% of the respondents considering that the municipalities of Caldas da Rainha and Óbidos were concerned with the deterioration of Lagoa de Óbidos landscape. Subsequently, 55% of the respondents considered that both municipalities were not concerned with the issue. Furthermore, all respondents said that they thought that the
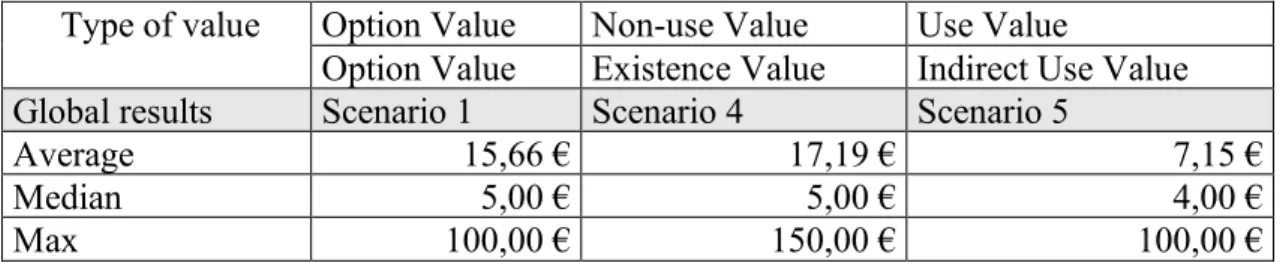
deterioration of the ecosystem was affecting the beauty of Lagoa de Óbidos’ landscape. On the question regarding how much the respondents were willing to pay, in a monthly basis, in order for the beauty of the landscape to be maintained in its current state, on average, the respondents said to be willing to pay a total of €15,66 to do so. In addition, the median value was €5, as well as the most frequent value referenced. The maximum value was €100, and the minimum value was € 026.
On the second scenario, we asked if the respondents thought that the siltation was a factor of beauty destruction, and how much they were willing to pay, monthly, in order to avoid it. 94% of the respondents answered that the siltation was, in fact, contributing to the destruction of the landscape beauty and among those who said so, the average willingness to pay was €15,46; the median value was €5; the maximum value was €100; and the minimum was €0. Also, the most frequent value declared was €5. For 94% of the respondents, in case of massive siltation affecting its beauty so much so that the landscape is totally transfigured, the average willingness to accept was €822,62; the median value was €50; the maximum value would be €10.000, and the minimum value was €0. Additionally, the value most frequently mentioned was €100. Nevertheless, 31% of the respondents stated that were reluctant to accept any value, and because they have considered that scenario so horrifying, they now want action to be made in order to prevent the destruction of the environmental resource that is the beauty of Lagoa de Óbidos.
In regards to the third scenario, where the creation of a fee was imagined in order to maintain the beauty of the lagoon and to face the massive increase of tourists in the area, 65% of the respondents did not agree with the fee being applied to all individuals regardless of their residency. The other 35%, agreed. Furthermore, the average willingness to pay was €1,44; the median value was €0; the maximum value was €50, and the minimum was €0. The value most often declared was €0.
26 Some of the inquired who were willing to pay € 0, they did not were reference a positive value because they consider
the maintenance of the landscape beauty is a Governmental issue and the inquired is already paying through taxes, and other inquired set a value lower to their willingness to pay, however, they do not believe that was reasonable considering others willingness to pay. Note that during the interview we refocus the inquired to reference their willingness to pay, regardless they concur to the scenario, however not all inquired were able to do so.
In terms of the charge of visitors, only 55% of the surveyed agreed and the other 45% did not. The average willingness to pay was €2,65; the median value was €1; the maximum value referenced was €50, and the minimum was €0. The most frequently reported value was €1. 13% of the respondents rejected the idea of creating a fee, regardless of who could be charged with it.
Taking the fourth scenario into account, for the question on how much the respondents were willing to pay, in a monthly basis, to ensure the preservation of the landscape beauty as they know it in a not too far away future, 93% of the respondents said to be ready to pay, giving that scenario, and the other 7% said they were unwilling to do so. So, the average willingness to pay was €17,19, the median value was €5, the maximum value was €150, and the minimum value was €0. The most frequently reported value was €5. With regards to the fifth scenario, in terms of the access to the landscape of Lagoa de Óbidos being restrained and the hypothesis of respondents having to pay for a ticket to admire its beauty, 97% of the respondents were willing to buy the ticket and the other 3% were unwilling to purchase it. In this scenario, the average willingness to pay was €7,15; the median value was €4; the highest value for the ticket was €100, and the lowest value was € 0. The most stated value was €5. Hence, in this scenario, a limitation or privation of the contemplation of the landscape beauty was presented and 44% of the respondents said to be ready to accept a compensation for that limitation. The average willingness to accept, in this scenario, was €578,34; the median value was €35; the highest value was €10.000, and the lowest value was €1. Most reported value was €10. The remaining 56% of the respondents were unwilling to accept monetary compensation, and 17,5% of them were incapable of conceiving this last part of the fifth scenario.
4.3. Analysis of the results
Based on the results obtained above, we must move to the analysis of the first scenario, regarding the beauty of the landscape, in general, and then, to the second one, focusing on a specific menace of beauty destruction. The average willingness to pay registered in the first and second scenarios is practically the same: €15,66 and €15,46, respectively. From there, we can assume that the respondents do not distinguish between the sources
of the landscape damage. They want its beauty to be preserved and, for that, are willing to pay almost the same price, indifferent of the causes of its destruction – that can be natural or others, such as the siltation. Comparing the first and fourth scenarios – where the difference is the period of time for those who will enjoy the beauty of the landscape –, the fourth scenario registers an increased average willingness to pay and a higher maximum value, when compared to the same parameters shown in the first scenario. Due to this difference, we are able to assume that the respondents are more concerned with the future generations enjoying the beauty of the landscape and that they take more benefit from the existence of the beauty of the landscape in the future than from the possibility of being able to enjoy it themselves. Analysing the third scenario, concerned with the application of a fee to both locals and visitors or just locals or just visitors, it seems fair to assume that the respondents prefer having the visitors paying a fee than having all the individuals who enjoy the beauty of the landscape being charged with it. Indeed, we can reach to this conclusion not only due to the acceptance discrepancy, where 65% of the respondents do not agree with the wide-ranging fee and 55% agree with the payment of a visitor’s fee, but also from the values stated by the respondents. The respondents, average willingness to pay a wide-ranging fee is €1,44. On the other hand, they aggravate the value to the visitor’s fee in €2,65. In the fifth and last scenario, respondents have an inferior willingness to pay than in the first, second and fourth scenarios, meaning that they benefit more from having the possibility to enjoy the landscape beauty when they want it and when they know it will endure in the future, than to change their habits of consumption.
The values stated can change thanks to each individual’s perception, due to the changeable nature of the individual’s spirit or state of mind or even because of the weather conditions. Despite that, analysing the WTP collected through a dynamic table in Microsoft Office Excel, we can study, ceteris paribus, the most explanatory variables27 of the questionnaire.