Airline Operations Control: a new concept for operations recovery
39
0
0
Texto
(2)
(3) In: Airline Industry: Strategies, Operations and Safety ISBN: 978-1-61122-079-7 Editor: Connor R. Walsh, pp. 61-97 © 2011 Nova Science Publishers, Inc.. Chapter 2. The exclusive license for this PDF is limited to personal website use only. No part of this digital document may be reproduced, stored in a retrieval system or transmitted commercially in any form or by any means. The publisher has taken reasonable care in the preparation of this digital document, but makes no expressed or implied warranty of any kind and assumes no responsibility for any errors or omissions. No liability is assumed for incidental or consequential damages in connection with or arising out of information contained herein. This digital document is sold with the clear understanding that the publisher is not engaged in rendering legal, medical or any other professional services.. AIRLINE OPERATIONS CONTROL: A NEW CONCEPT FOR OPERATIONS RECOVERY António J. M. Castro and Eugénio Oliveira LIACC-NIAD&R, FEUP, DEI, University of Porto, Portugal. ABSTRACT The Airline Operations Control Centre (AOCC) of an airline company is the organization responsible for monitoring and solving operational problems. It includes teams of human experts specialized in solving problems related with aircrafts, crewmembers and passengers, in a process called disruption management or operations recovery. In this chapter we propose a new concept for disruption management in this domain. The organization of the AOCC is represented by a multi-agent system (MAS), where the roles that correspond to the most repetitive tasks are performed by intelligent agents. The human experts, represented by agents that are able to interact with them, are part of this AOCC-MAS supervising the system and taking the final decision from the solutions proposed by the AOCC-MAS. We show the architecture of this AOCC-MAS, including the main costs involved and details about how the system takes decisions. We tested the concept, using several real airline crew related problems and using four methods: human experts (traditional way), the AOCC-MAS with and without using quality-costs and the integrated approach presented in this chapter. The results are presented and discussed.. 1. INTRODUCTION Control the operation is one of the most important tasks that an airline company has. It does not matter much to produce an optimal or near-optimal schedule of flights if, later, during the execution of the operational plan, the changes to that plan caused by disruptions Most of this chapter was written based on previous publications by the same authors, specially ―A New Concept for Disruption Management in Airline Operations Control‖, Proc. IMechE Part G: J. Aerospace Engineering. All papers are referenced..
(4) 62. António J.M. Castro and Eugénio Oliveira. are too far from the original schedule. Unfortunately, the majority of the disruptions are difficult to predict (for example, those caused by meteorological conditions or by aircraft malfunctions). Airline companies developed a set of operations control mechanisms to monitor the flights (and crewmembers) to check the execution of the schedule. During this monitoring phase, several problems may appear related with aircrafts, crewmembers and passengers [1]. According to Kohl et al. [2], disruption management is the process of solving these problems. To be able to manage disruptions, airline companies have an entity called Airline Operations Control Centre (AOCC). This entity is composed of specialized human teams that work under the control of an operations supervisor. Although each team has a specific goal (for example, the crew team is responsible for having the right crew in each flight), they all contribute to the more general objective of minimizing the effects of disruption in the airline operational plan. In this chapter we propose a new concept for disruption management in this domain. We see the AOCC as an organization with local goals (for example, minimizing the costs with aircraft, crew and/or passengers when solving a specific disruption) but also with global goals like minimizing delays and costs in a given period of time. The objective is to make the AOCC more efficient, quicker when solving disruptions and with better global decisions and performance. We believe that human experts should be managers and not controllers. In our opinion, repetitive tasks are performed better by software agents and tasks with a high degree of uncertainty are performed better by humans. For that we propose to represent the AOCC as an organization of agents, a multi-agent system (MAS), where the roles that correspond to the most repetitive tasks are performed by intelligent agents. The human experts, represented by agents that are able to interact with them, are part of this AOCC-MAS supervising the system and taking the final decision from the solutions proposed by the AOCC-MAS. This chapter is organized as follows: In Section 2 we present a comparative summary of related work regarding operations recovery and a brief summary of the current use of software agents‘ technology in other domains. Section 3 introduces the Airline Operations Control Centre (AOCC), including typical organizations and problems, the current disruption management (DM) process and a description of the main costs involved. A classification of current tools and systems is also included. Section 4 is the main section of this chapter and presents our new concept for disruption management in AOCC, including details about how we built the agent-based approach to this problem. This section presents: (i) the reasons that made us adopt the software agents and multi-agent system (MAS) paradigm; (ii) the MAS architecture including the specific agents, roles and protocols as well as some relevant agent characteristics like autonomy and social-awareness; (iii) decision mechanisms, including costs criteria and negotiation protocols and (iv) examples of the problem solving algorithms used. In Section 5 we present the experimental setup and, in Section 6, we evaluate our approach, presenting and discussing the results. Finally, in Section 7, we conclude and give some insights on the future work.. 2. SUMMARY OF RELATED WORK We have divided this section in two parts. In section 2.1 we summarize the existing work regarding operations recovery. Most of the work in this area has been done using operation.
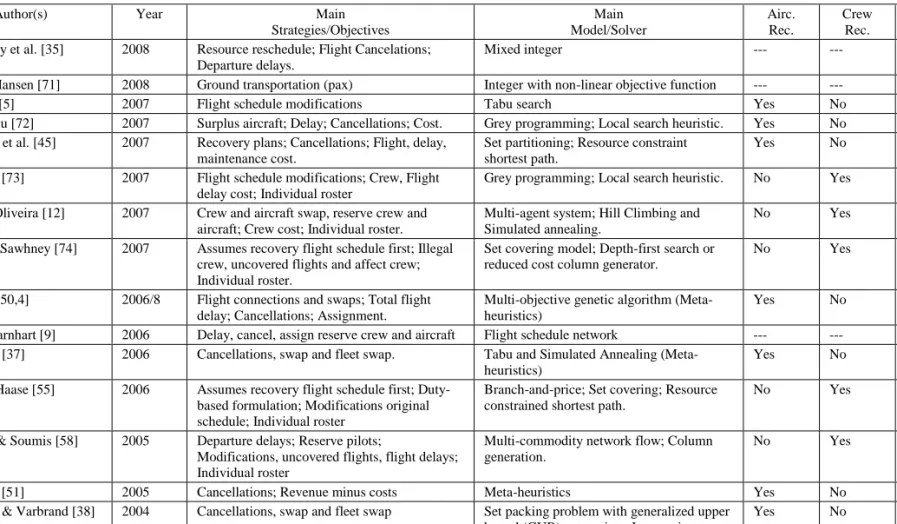
(5) Airline Operations Control: A New Concept for Operations Recovery. 63. research methods (OR). For the interested reader Barnhart et al., [3] gives an overview of OR air transport applications. In section 2.2 we give an incomplete and brief list of agents applied in other domains.. 2.1. Operations Recovery The goal of this section is to present a brief comparative summary of research regarding operations recovery. We also classify each work according to the dimensions they are able to deal with, that is, aircraft recovery, crew recovery or integrated recovery. We classify a work as integrated when it is able to deal with, at least, two of the dimensions (for example, aircraft and passenger or aircraft and crew). Table 1 presents a descendent chronological order of research regarding airline disruption management. Most of this information was collect from Clausen et al., [34] and from [32] and, for detailed information about each work, we recommend reading the above mentioned papers.. 2.2. Other Application Domains The agent and multi-agent paradigm has been used in several application domains, including in other air transportation problems. To the best of our knowledge and regarding the use of this paradigm to represent the AOCC as an organization of agents, we believe that we were the first to do it [12, 14]. Regarding the use of agents in other domains a very brief list follows: Jonker et al., [17] propose a multi-agent system for ATC Tower operations. In the aviation domain but in a different context, Tumer and Agogino [15] present a multi-agent system for traffic flow management. Another use of agents in the context of collaborative traffic flow management is reported by Wolfe et al., [16]. Here, agents are used to compare routing selection strategies. As a last example and in completely different domain, Quelhadj [18, 19] developed an integrated dynamic scheduling system of steel production based on the multi-agent paradigm. As we said in the beginning of this section, the examples above are an incomplete and very brief list of the use of the multi-agent system paradigm, just to give an idea that this technology is able to deal with very complex and critical problems.. 3. AIRLINE OPERATIONS CONTROL In this section we introduce the airline operations control problem – AOCP (also known as airline disruption management problem). To contextualize, we start by briefly introducing the AOCP preceding problem known as the Airline Scheduling Problem (ASP). Then we explain what an airline operational control centre (AOCC) is and we present some typical AOCC organizations. The typical problems, the current disruption management process as well as the main costs involved are also introduced. At the end of this section we present a classification of current tools and systems..
(6) Table 1. Comparative summary of research regarding operations recovery Author(s). Year. Abdelghany et al. [35]. 2008. Zhang & Hansen [71] Mei Yang [5] Zhao & Zhu [72] Eggenberg et al. [45]. 2008 2007 2007 2007. Zhao et al. [73]. 2007. Castro & Oliveira [12]. 2007. Medard & Sawhney [74]. 2007. Liu et al., [50,4]. 2006/8. Bratu & Barnhart [9] Andersson [37]. 2006 2006. Nissen & Haase [55]. 2006. Stojkovic & Soumis [58]. 2005. Love et al. [51] Andersson & Varbrand [38]. 2005 2004. Abdelgahny et al., [8]. 2004. Main Strategies/Objectives Resource reschedule; Flight Cancelations; Departure delays. Ground transportation (pax) Flight schedule modifications Surplus aircraft; Delay; Cancellations; Cost. Recovery plans; Cancellations; Flight, delay, maintenance cost. Flight schedule modifications; Crew, Flight delay cost; Individual roster Crew and aircraft swap, reserve crew and aircraft; Crew cost; Individual roster. Assumes recovery flight schedule first; Illegal crew, uncovered flights and affect crew; Individual roster. Flight connections and swaps; Total flight delay; Cancellations; Assignment. Delay, cancel, assign reserve crew and aircraft Cancellations, swap and fleet swap. Assumes recovery flight schedule first; Dutybased formulation; Modifications original schedule; Individual roster Departure delays; Reserve pilots; Modifications, uncovered flights, flight delays; Individual roster Cancellations; Revenue minus costs Cancellations, swap and fleet swap. Deadheading, stand-by, swap, flight delay costs; Individual roster. Main Model/Solver. Airc. Rec.. Mixed integer. ---. Crew Rec. ---. Integ. Rec. Yes. Integer with non-linear objective function Tabu search Grey programming; Local search heuristic. Set partitioning; Resource constraint shortest path. Grey programming; Local search heuristic.. --Yes Yes Yes. --No No No. Yes No No No. No. Yes. No. Multi-agent system; Hill Climbing and Simulated annealing. Set covering model; Depth-first search or reduced cost column generator.. No. Yes. No. No. Yes. No. Multi-objective genetic algorithm (Metaheuristics) Flight schedule network Tabu and Simulated Annealing (Metaheuristics) Branch-and-price; Set covering; Resource constrained shortest path.. Yes. No. No. --Yes. --No. Yes No. No. Yes. No. Multi-commodity network flow; Column generation.. No. Yes. No. Meta-heuristics Set packing problem with generalized upper bound (GUB) constraints; Lagrangian relaxation-based heuristic and DantzigWolfe decomposition. Mixed-integer program;. Yes Yes. No No. No No. No. Yes. No.
(7) Author(s). Year. Main Strategies/Objectives Assumes recovery flight schedule first; Standby, modifications, operating costs; Individual roster. Guo [46]. 2004. Kohl et al., [2]. 2004. Flight swaps, cancellations, crew swaps, standby, up/downgrading crew; Passenger delay costs at destination, value of passenger based on the booked fare class and frequent flyer information.. Yu et al. [70]. 2003. Rosenberger et al., [6]. 2003. Cancellations; Deadheading, modifications, uncovered flight costs Delay and cancellation. Andersson [36] Bard et al. [40]. 2001 2001. Delay, cancel, assign reserve crew and aircraft Delay and cancellation. Thengvall et al. [65,66] Stojkovic & Soumis [57]. 2001/3 2001. Lettovsky et al. [49]. 2000. Cancellations; Multi-fleet; Revenue minus cost Modifications, uncovered flights, flight departure delays; Individual roster Cancellation; Pairing, cancel flight costs.. Thengvall et al. [64]. 2000. Luo & Yu [53]. 1998. Stojkovic et al. [59]. 1998. Lettovsky [10]. 1997. Wei et al. [67]. 1997. Cancellations, swaps, delays; Revenue minus costs Delayed flights Assumes recovery flight schedule first; Pairing, Deadheading, undercovering costs; Individual roster Cancellation, delays, equipment assignment; Maximizes total profit. Assumes recovery flight schedule first; Pairing cost. Main Model/Solver Set partitioning problem; Column generation with LP relaxation or Hybrid heuristic based in a genetic algorithm with a local search. Dedicated aircraft solver (Extension Local Search Heuristic [51]); Dedicated crew solver (Differential columngeneration/constraint integer problem); Dedicated passenger solver (multicommodity flow problem); Integrated recovery layer (Intelligent messaging system). Depth-first search; CrewSolver optimization. Set partitioning model; Pre-processing heuristic; CPLEX 6.0. Flight schedule network Integer minimum cost flow model with additional constraints. Three mixed-integer program models. Multi-commodity network flow with additional constraints; Column generation. Set covering with decision variables; LP Relaxation and Branch-and-Bound Integer programming; LP relaxation with heuristic Assignment problem with side constraints; Heuristic Integer non-linear multi-commodity flow network problem; Columns generation, branch-and-bound. Linear mixed-integer mathematical problem; Benders decomposition. Integer multi-commodity network flow problem; Depth-first search. Airc. Rec. No. Crew Rec. Yes. Integ. Rec. No. ---. ---. Yes. No. Yes. No. Yes. No. No. --Yes. --No. Yes No. Yes No. No Yes. No No. No. Yes. No. Yes. No. No. Yes. No. No. No. Yes. No. ---. ---. Yes. No. Yes. No.
(8) Table 1. (Continued) Author(s). Year. Main Strategies/Objectives Cancellations; Multi-fleet; Flight route augmentation, partial route exchange; Route cost and cancellation cost Number delayed flights under GDP (Ground Delay Program) Cancellations; Revenue minus costs. Arguello et al. [39]. 1997. Luo & Yu [52]. 1997. Cao & Kanafani [41,42]. 1997. Yan & Tu [68]. 1997. Cancellations; Multi-fleet; Costs minus revenues. Clarke [43,44]. 1997. Cancellations; Multi-fleet; Costs minus revenues. Yan & Yang [69]. 1996. Cancellations; Costs minus revenues. Talluri [60]. 1996. Mathaisel [54]. 1996. Multi-fleet; Swaps when exchanging aircraft type. Cancellations; Revenue loss, operating cost. Teodorovic & Stojkovic [63]. 1995. Johnson et al. [48]. 1994. Jarrah et al. [47]. 1993/6. Cancellations; Delay, swap and ferrying.. Rakshit et al. [56]. 1993/6. Cancellations; Delay, swap and ferrying.. Teodorovic & Stojkovic [62] Teodorovic & Guberinic [61]. 1990 1984. Cancellation and delay minutes Delay minutes. Cancellation and delay minutes; Crew considerations; Minimize total passenger delays. Pairing, stand-by, deadheading costs; Cancellations.. Main Model/Solver Meta-heuristics (GRASP – Greedy Randomized Adaptative Search Procedure). Airc. Rec. Yes. Crew Rec. No. Integ. Rec. No. Assignment problem with side constraints; Heuristic Minimum cost network flow; Network flow algorithms. Network flow model with side constraints; Lagragian relaxation with subgradient method, Lagragian heuristic. Set partioning, Column generation, extra constraints; Tree-search heuristic and a set packing-based optimal solution. Minimum cost network flow; Network flow algorithms. Classifies swap opportunities; Polynomial time algorithm. Minimum cost network flow; Network flow algorithms. Heuristic.. Yes. No. No. Yes. No. No. Yes. No. No. Yes. No. No. Yes. No. No. Yes. No. No. Yes. No. No. Yes. No. No. Set covering problem with decision variables; MINTO [75] (mixed integer optimizer) Minimum cost network flow; Network flow algorithms. Minimum cost network flow; Network flow algorithms. Heuristic Heuristic. No. Yes. No. Yes. No. No. Yes. No. No. Yes Yes. No No. No No.
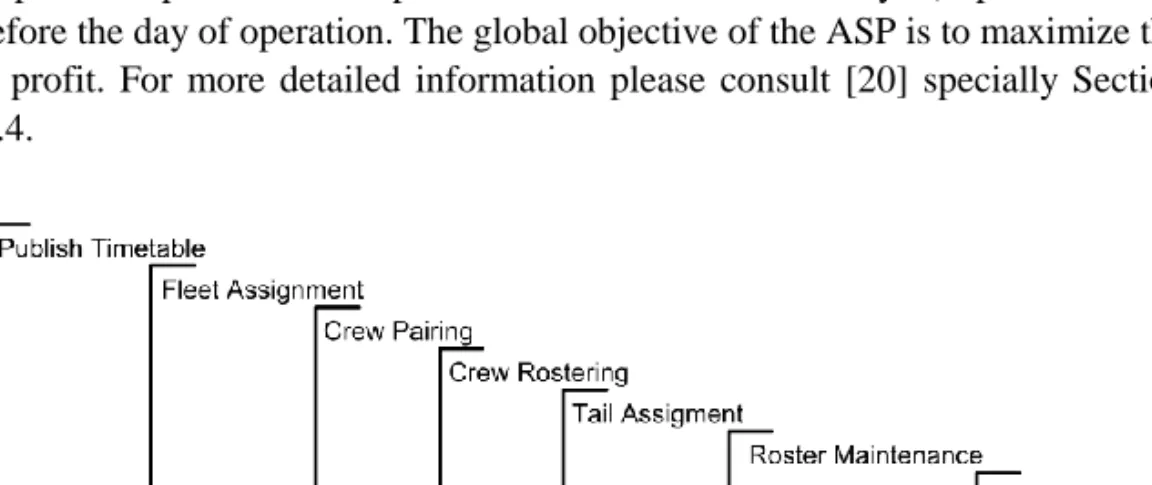
(9) Airline Operations Control: A New Concept for Operations Recovery. 67. 3.1. Airline Scheduling Problem According to Kohl et al., [2] the scheduling process of an airline company is composed by the long and short-term phases presented in Figure 1. The scheduling process has three main dimensions or views: (1) passenger view; (2) aircraft view and (3) crew view. The first one represents the seats available to be sold to the airline customers. The other two views, represents resources that will be allocated. Everything starts with publishing the flights timetable for a specific period of time (usually six months). After publishing the timetable, the revenue management phase starts. Here the goal is to maximize the revenue obtained selling tickets. At the same time, the scheduling of the two most important resources starts: aircrafts and crew. Regarding the aircraft, the first step is the fleet assignment. Here, the goal is to assign the aircraft type or aircraft fleet that will perform the flights. It is an important step because the aircraft type/fleet will define the number of available seats in each flight. Near to the day of operations, the assignment of the specific aircraft to each flight is performed. This step is known as tail assignment. After the fleet assignment step, it is possible to start to schedule the crew. The first step is the crew pairing. The goal is to define the crew duty periods (pairings) that will be necessary to cover all the flights of the airline for a specific period of time (typical one month). Having the pairings, it is possible to start the crew rostering step that is, assign crewmembers to the pairings. The output of this step is an individual crew roster that is distributed or published in the crew web portal. Finally and until the day of operations, it is necessary to change/updated the crew roster (roster maintenance), to include any changes that might appear after publishing the roster. The airline scheduling problem (ASP) is composed of all the previous phases and steps and ends some hours or days (depends on the airline policy) before the day of operation. The global objective of the ASP is to maximize the airline operating profit. For more detailed information please consult [20] specially Section 2.1 to Section 2.4.. Figure 1. The airline scheduling process.
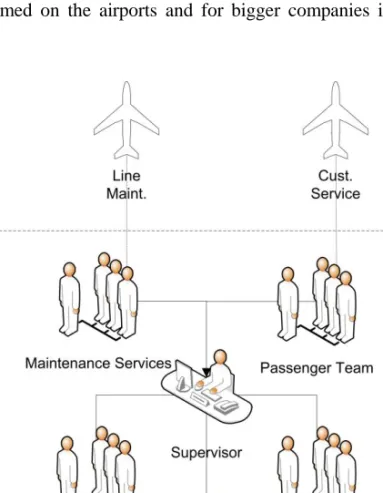
(10) 68. António J. M. Castro and Eugénio Oliveira. 3.2. AOCC Organization The airline operations control problem (AOCP) starts where the airline scheduling problem stops. If everything goes as planned the airline just needs to monitor the execution of the plan. Unfortunately, several unexpected events appear during this phase that can disrupt the plan. To monitor those events and solve the problems that arise from these, it is necessary to define and follow a disruption management process. Airline companies have an entity called Airline Operations Control Centre (AOCC) that is responsible for the disruption management process. There are three main types of AOCC organizations [11]: Decision Centre: The aircraft controllers share the same physical space. The other roles or support functions (crew control, maintenance service, etc.) are in a different physical space. In this type of Collective Organization all roles need to cooperate to achieve the common goal. Integrated Centre: All roles share the same physical space and are hierarchically dependent of a supervisor. For small companies we have a Simple Hierarchy Organization. For bigger companies we have a Multidimensional Hierarchy Organization. Figure 2 shows an example of this kind of AOCC organization. Hub Control Centre (HCC): Most of the roles are physically separated at the airports where the airline companies operate a hub. In this case, if the aircraft controller role stays physically outside the hub we have an organization called Decision Centre with a hub. If both the aircraft controller and crew controller roles are physically outside the hub we have an organization called Integrated Centre with a hub. The main advantage of this kind of organization is to have the roles that are related with airport operations (customer service, catering, cleaning, passengers transfer, etc.) physically closer to the operation. The organization adopted depends on several factors like airline size, airline network type (for example, hub-and-spoke) and geographic distribution of the operation, as well as, tradition and/or company culture. In Figure 2 we present the organization of a typical Integrated Operational Control Centre. It is important to point out the role of the supervisor, a characteristic that makes this organization hierarchical and, also, the operation time-window that marks the responsibility boundaries of the AOCC. This operation time-window is different from airline to airline but, usually, ranges from 72 to 24 hours before to 12 to 24 hours after the day of operation. The roles or support functions more common in an AOCC, according to Kohl et al., [2] and [11], are the following: Flight Dispatch: Prepares the flight plans and requests new flight slots to the Air Traffic Control (ATC) entities (FAA in North America and EUROCONTROL in Europe, for example). Aircraft Control: Manages the resource aircraft. It is the central coordination role in the operational control. In a disruptive situation, tries to minimize the delays by changing aircrafts and rerouting or joining flights, among other actions. Usually, uses some kind of computer system to monitor the operation that, in some cases, might.
(11) Airline Operations Control: A New Concept for Operations Recovery. 69. include some decision supports tools. Much more common is the use of rules-ofthumb based on work experience (a kind of hidden knowledge). Crew Control: Manages the resource crew. Monitors the crew check-in and checkout, updates and changes the crew roster according to the disruptions that might appear during the operation. Like the previous role, it uses some kind of system with or without decision support tools. The experience and the use of rules-of-thumb are still the most common decision tools. To use reserve crew and exchange crewmembers from other flights, are among the possible actions used to solve crew problems. Maintenance Services: Responsible for the unplanned maintenance services and for short-term maintenance scheduling. Changes on aircraft rotations may impact the short-term maintenance (maintenance cannot be done at all stations). Passenger Services: Decisions taken on the AOCC will have an impact on the passengers. The responsibility of this role is to consider and minimize the impact of the decisions on passengers, trying to minimize the passenger trip time. Part of this role is performed on the airports and for bigger companies it is part of the HCC organization.. Figure 2. Integrated airline operational control centre.
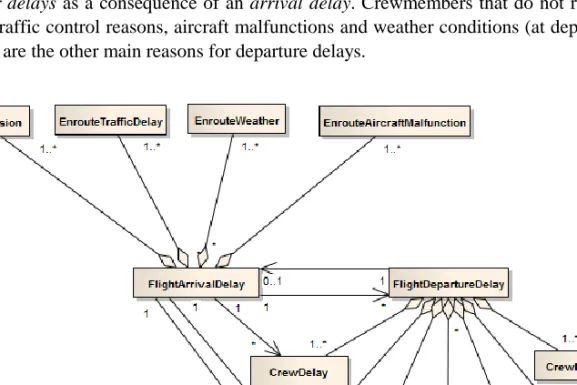
(12) 70. António J. M. Castro and Eugénio Oliveira. 3.3. Typical Problems In the previous section we presented typical AOCC organizations and the roles that exist on those organizations. Now, it is important to understand the typical problems that appear during the execution of the airline operation. From our observations in a real AOCC, and from Kohl & Karisch [21], we found the typical problems presented in Figure 3. In this diagram we have also included the impact that each problem might have on flight arrival or departure delays as well as the relation that exist between them. The diagram also shows that the problems might propagate due to the relation between them and generate new problems on different flights. This propagation characteristic makes the problem more difficult to be solved optimally in a real time and dynamic environment, like the one we have on the AOCC. As we can see in Figure 3 there is an obvious relation between Flight Arrival Delays and Flight Departure Delays. Most of the flights are performed by aircrafts that are used in previous flights. If we have an arrival delay and the aircraft turn-around time at the airport is not enough, then, if the AOCC does not find an alternative solution, we will also have a departure delay. From the diagram we can also see that the main reasons for flight arrival delay (besides the delay on departure) are: En-route air traffic, en-route weather, en-route aircraft malfunction and flight diversion. In the previous cases and to minimize the arrival delay it is necessary a cooperation between the pilot, the AOCC and ATC. Regarding departure delays, the main reasons are: crew delays, cargo/baggage loading delays and passenger delays as a consequence of an arrival delay. Crewmembers that do not report for duty, air traffic control reasons, aircraft malfunctions and weather conditions (at departure or at arrival) are the other main reasons for departure delays.. Figure 3. Typical AOCC problems and relations.
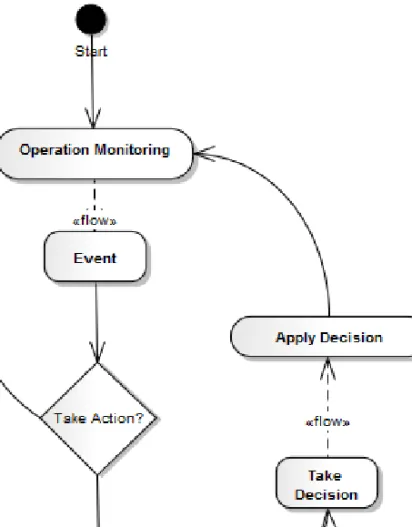
(13) Airline Operations Control: A New Concept for Operations Recovery. 71. Figure 4. AOCC disruption management process. 3.4. Current Disruption Management Process As we can see from the previous section, there are several problems that might cause flight delays. AOCCs have a process to monitor the events and solve the problems, so that flight delays are minimized with the minimum impact on passenger and, preferably, with the minimum operational cost. In Figure 4 we present the current disruption management process in use at most of the airlines. This process has five steps: 1. Operation Monitoring: In this step the flights are monitored to see if anything is not going according the plan. The same happens in relation with crewmembers, passenger check-in and boarding, cargo and baggage loading, etc. 2. Take Action: If an event happens, like for example, a crewmember is delayed or an aircraft malfunction, a quick assessment is performed to see if an action is required. If not, the monitoring continues. If an action is necessary than we have a problem that needs to be solved..
(14) 72. António J. M. Castro and Eugénio Oliveira 3. Generate and Evaluate Solutions: Having all the information regarding the problem the AOCC needs to find and evaluate the candidate solutions. Usually, a sequential approach is adopted when generating the solutions. First, the aircraft problem is solved. Then, the crew problem and finally, the passengers. It is understandable that the AOCC adopts this approach. Without good computer tools, it is difficult to take care of the problem, considering the three dimensions (aircraft, crew and passengers) simultaneously. Although there are several costs involved in this process, we found that the AOCC relies heavily on the experience of their controllers and in some rulesof-thumb (a kind of hidden knowledge) that exist on the AOCC. 4. Take Decision: Having the candidate solutions a decision needs to be taken. 5. Apply Decision: After the decision the final solution needs to be applied in the environment, that is, the operational plan needs to be updated accordingly.. In our opinion, this process can greatly benefit from an intelligent agent based approach to the problem, as we will explain in Section 4.. 3.5. Main Costs Involved In the step Generate and Evaluate Solutions of the disruption management process on the previous section, we should consider the main costs involved in generating and choosing from candidate solutions. According to our observations these are the main costs involved when generating and evaluating a solution for a specific disruption: 1. Crew Costs: the average or real salary costs of the crewmembers, additional work hours and perdiem days to be paid, hotel costs and extra-crew travel costs. 2. Flight Costs: airport costs (approach and taxing taxes, for example), service costs (cleaning services, handling services, line maintenance, etc.), and average maintenance costs for the type of aircraft, ATC en-route charges and fuel consumption. 3. Passenger Costs: passenger airport meals, passenger hotel costs and passenger compensations. Finally, there is a less easily quantifiable cost that is also included: the cost of delaying or cancelling a flight from the passenger point of view. Most airlines use some kind of rule-ofthumb when they are evaluating the impact of the decisions on passengers. Others just assign a monetary cost to each minute of delay and evaluate the solutions taking into consideration this value. In a previous work [31, 32] we propose a different way of calculating this cost component. Section 4.5 highlights the most important parts of this approach.. 3.6. Current Tools and Systems In a previous work [11] we have classified the current tools (or systems that provide those tools) in use at AOCCs in one of these three categories:.
(15) Airline Operations Control: A New Concept for Operations Recovery. 73. 1. Database Query Systems (DBQS) 2. Decision Support Systems (DSS) 3. Automatic or Semi-Automatic Systems (ASAS) The DBQS – Database Query Systems (the most common situation at airlines) allows the AOCC human operators to perform queries on the existing databases to monitor the airline operation and to obtain other data essential for decision-making. For example, the aircraft and/or crew roster, aircraft maintenance schedule, passenger reservations, and so on. These systems are useful and relatively easy to implement and/or acquire but they have some important disadvantages, for example, to find the best solution and to take the best decision is completely dependent on the human operator. As we have explained in [11] there are two problems when airline companies use only this type of systems: (1) the solution quality is dependent on knowledge and experience of the human operator and, (2) due to the usual difficulty of the human being in leading with large volumes of data simultaneously, they do not use all the necessary information (variables) to take the best decision. The DSS - Decision Support Systems, besides having the same characteristics of the DBQS, also include additional functionalities to support the human operators on the decisionmaking. For example, after a request made by a human operator, these systems are able to recommend the best solution to solve a problem related with a delayed aircraft. Some of them may just recommend a flight re-scheduling but others are able to justify the candidate solution as well as to present the solution cost. DSS systems eliminate some of the disadvantages of the DBQS systems. Namely, they are able to analyse large volumes of data and, because of that, propose solutions that take into consideration more information (variables). The decision-making still is on the human operator side but, now, he is able to take better decisions. Unfortunately, one of the big problems with airline companies is the absence and/or complexity of the computerized information system keeping all the operational information. These are of paramount importance for the success of the decision support tools. This problem, referred in [2] as the Data Quality and System Accessibility Problem, gains more importance when we start to implement decision support tools and/or automatic or semi-automatic systems. The goal of the third type of systems, ASAS – Automatic or Semi-Automatic Systems, is to automate as much as possible the AOCC, replacing the functional part by computerized programs. Specifically, these systems try to automate the repetitive tasks and also the tasks related with searching for the best solution (problem solving). In a totally automatic system, decision-making is also taken by the system. In a semi-automatic system, the final decision is taken by the human operator. In ASAS type of systems, the AOCC does not need as much human operators as in the previous ones, to operate correctly. Usually, roles or functions related with operation monitoring, searching for solutions related with aircraft, crew or passenger problems and re-allocation of resources, are performed by specialists agents [12] replacing the human specialists. The final decision regarding the application of the solution found by these systems on the environment (for example, making the necessary changes on the airline operational plan database) depends on the human supervisor. According to [13] and [14] the agent and multi-agent systems paradigm is more appropriate to be used in this domain than any other paradigm. Our new concept for operations recovery fits in this type of systems..
(16) 74. António J. M. Castro and Eugénio Oliveira. 4. A NEW CONCEPT FOR OPERATIONS RECOVERY In Section 3 we introduced the Airline Scheduling Problem and the Airline Operations Control Problem (or Disruption Management Problem). We have described the AOCC organization and roles as well as the typical problems that appear during the execution of the operational plan. The disruption management process used by airlines was presented as well as the main costs involved in generating and evaluating the solutions. We have also classified the current tools and systems in three categories. In this section we present our new concept for disruption management in the airline domain, including how we represent the AOCC using a multi-agent system (MAS), an organization of intelligent agents. To implement the MAS we have used Java1 and JADE [22]. These tools provide the necessary development framework and runtime environment for our agents.. 4.1. Introduction Looking at the current roles in the AOCC (Figure 2), we see that some of them correspond to very repetitive tasks. For example, the aircraft controller (a member of the aircraft team) is constantly checking the computer system (including, e-mail, datalink system, telex, etc.) to see if there is any problem that might affect the departure or arrival of a flight. A similar routine regarding monitoring crewmembers is performed by the crew controller (a member of the crew team). When a problem is detected, the process of solving it is also very repetitive. For example, if a flight is delayed, the possible and general actions than an aircraft controller has to solve the problem are (the applicability of each action depends on the specific problem at hand): 1. 2. 3. 4.. Use an aircraft from a later flight (change aircrafts). Reroute the flight (helpful when the delay is related with slots). Join flights (use one aircraft to also perform the flight of the broken aircraft). Freight an aircraft and crew from another company, also known as ACMI – Aircraft, Crew, Maintenance and Insurance. 5. Delay the flight. 6. Cancel the flight. The crew controller also performs very repetitive tasks when trying to solve crew problems. For example, the general actions he can use to solve the problems are (the applicability of each action depends on the specific problem at hand): 1. 2. 3. 4.. Use a reserve crew at the airport. Use a reserve crew that lives near the airport. Use another crew from another flight. Invite a day off crew.. 1 http://www.java.com.
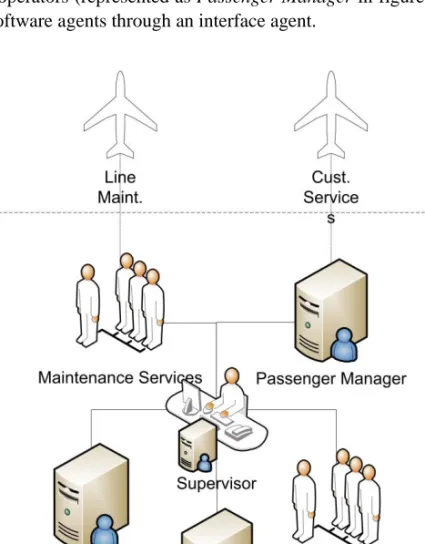
(17) Airline Operations Control: A New Concept for Operations Recovery 5. 6. 7. 8.. 75. Propose to change the aircraft to a different aircraft type. Proceed without the crewmember. Delay the flight. Cancel the flight.. Taking into consideration the above as well as the characteristics of the agent and multiagent paradigm (see next section) we propose to represent the AOCC by a multi-agent system, replacing the monitoring, aircraft controller, crew controller and part of the passenger role, by intelligent agents as represented in Figure 5. In this new approach, the aircraft team will be replaced by a sub-organization of agents (represented as Aircraft Manager). The same will happen to the crew team (represented as Crew Manager). Regarding the passenger services, we propose to replace by software agents the task of finding the best solutions to the problems with passengers (usually a plan of alternative flights to each disrupted passenger) and keep the other tasks to be performed at the airports by human operators (represented as Passenger Manager in figure 5). The supervisor interacts with the software agents through an interface agent.. Figure 5. New concept for integrated Airline Control Centre.
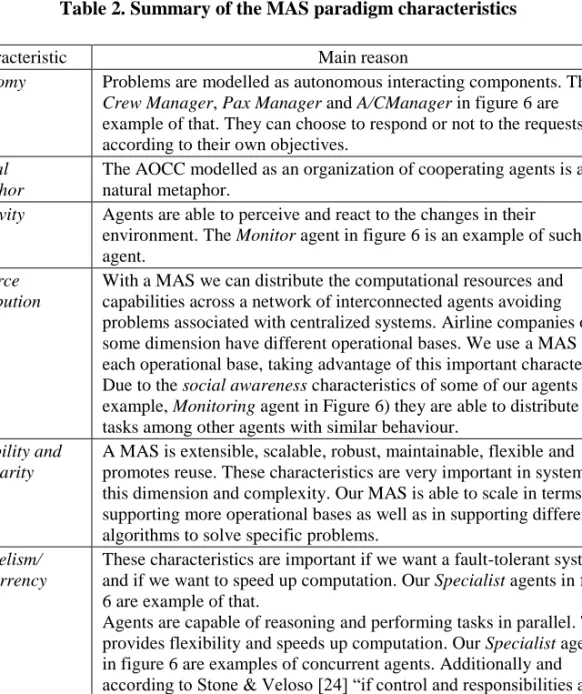
(18) 76. António J. M. Castro and Eugénio Oliveira. 4.2. Why an Agent and Multi-Agent System Paradigm? Before presenting the architecture of our multi-agent system, it is important to point out the characteristics of this paradigm, according to [13, 23], that make us adopt it to model this problem. Table 2 summarizes the characteristics. For the interested reader, more details are available in [32], section III. Table 2. Summary of the MAS paradigm characteristics Characteristic Autonomy. Natural Metaphor Reactivity. Resource Distribution. Scalability and Modularity. Parallelism/ Concurrency. Legacy Systems. Main reason Problems are modelled as autonomous interacting components. The Crew Manager, Pax Manager and A/CManager in figure 6 are example of that. They can choose to respond or not to the requests according to their own objectives. The AOCC modelled as an organization of cooperating agents is a natural metaphor. Agents are able to perceive and react to the changes in their environment. The Monitor agent in figure 6 is an example of such an agent. With a MAS we can distribute the computational resources and capabilities across a network of interconnected agents avoiding problems associated with centralized systems. Airline companies of some dimension have different operational bases. We use a MAS for each operational base, taking advantage of this important characteristic. Due to the social awareness characteristics of some of our agents (for example, Monitoring agent in Figure 6) they are able to distribute their tasks among other agents with similar behaviour. A MAS is extensible, scalable, robust, maintainable, flexible and promotes reuse. These characteristics are very important in systems of this dimension and complexity. Our MAS is able to scale in terms of supporting more operational bases as well as in supporting different algorithms to solve specific problems. These characteristics are important if we want a fault-tolerant system and if we want to speed up computation. Our Specialist agents in figure 6 are example of that. Agents are capable of reasoning and performing tasks in parallel. This provides flexibility and speeds up computation. Our Specialist agents in figure 6 are examples of concurrent agents. Additionally and according to Stone & Veloso [24] ―if control and responsibilities are sufficiently shared among agents, the system can tolerate failures by one or more agents‖. Our MAS can be totally or partially replicated in different computers. If one or more agents fail, the global objective is not affected. Legacy systems can be wrapped in an agent layer to be able to interact with other systems. It the air transportation domain, most likely, we need to interact with older but functional systems. So, this characteristic is very important..
(19) Airline Operations Control: A New Concept for Operations Recovery. 77. Figure 6. MAS architecture. 4.3. MAS Architecture To develop a software system it is important to follow a methodology. Multi-agent systems are not an exception. The architecture presented here is the result of following an agent-oriented methodology, specifically an adaptation of GAIA according to [25]. The base for this architecture was the service and agent model that resulted from following the methodology. Figure 6 shows the architecture of our multi-agent system approach. The boxes represent agents, the solid lines represent interactions between agents and the dash lines represent actions in the environment. The cloud represents the negotiation at the managers‘ level. In this figure we are representing only one instance of the system. All agents can be replicated with the exception of the Supervisor agent. Each agent performs one or more roles in the AOCC. The Monitor agent looks for events on the operational plan that may trigger any aircraft/flight, passenger and/or crew problem. This agent has social-awareness characteristics in the sense that it is able to recognize and interact with other agents with the same role, splitting the tasks. For example, if each monitor agent instance corresponds to a different hub, they will monitor the corresponding hub operational plan. This agent, like others in our system, is autonomous because it is able to consider an event as a problem only when specific conditions or characteristics are present. The CrewManager and A/CManager agents are responsible for crew and aircraft/flight problems, respectively. They manage a team of expert agents [12] with the role of finding solutions for the problems in their area of expertise. The expert or specialist agents implement different heterogeneous problem solving algorithms and are able to run in parallel. The.
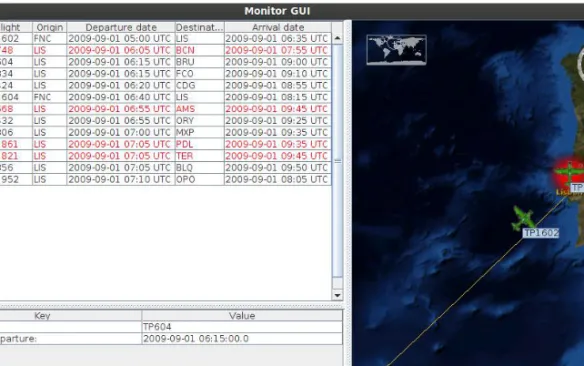
(20) 78. António J. M. Castro and Eugénio Oliveira. managers are autonomous because they only respond to requests related with their area of expertise. To find the best solution regarding passenger problems we have the PaxManager. The agent Supervisor and agent EventInformation are the only ones that interact with a human user of the AOCC. The solutions selected by the Supervisor are presented to the human. Includes solution details (and the rationale behind the solution) to help the human decide and are ranked according to the criteria of the airline company. After getting approval from the human supervisor, the Supervisor agent requests Applier agent to apply it on the environment. In figure 6, Data Sources represent the environment that all agents are able to observe and act upon. All the necessary information is included in the data sources. For example, company and airport information, flight schedule, aircraft and crew rosters, etc. Additional information to support some characteristics of the MAS like learning is also included on the data sources. The Tracking agent supports the tracking characteristics of the system and the Data Visualization agent supports the visualization of the information (flight movements, delays, problems, etc.) showing what is happening at the AOCC. Figure 7 shows a partial GUI updated by the Data Visualization agent. There is also a Learning agent that will support the advanced learning characteristics of the system (not implemented yet). In Section 7, the interested reader can find more information about the way we expect to apply learning in our MAS. Finally, the protocols we use are the following (the first three are FIPA2 compliant ones): Fipa-Request: This protocol allows one agent to request another to perform some action and the receiving agent to perform the action or reply, in some way, that it cannot perform it. Fipa-request is used in interactions between the Monitor and Crew, Pax and A/C Manager interactions. Fipa-Query: This protocol allows one agent to request to perform some kind of action on another agent. It is used in the interactions that involve PaxManager, A/CManager, CrewManager and Supervisor agent; Supervisor, Applier and EventInformation agent and, finally, EventInformation and Monitoring agent. Fipa-Contract.net [29]: A simplified version of this protocol is used in the interactions between the Managers and the expert/specialised agents. GQ-Negotiation: This negotiation protocol is a generalization of the Q-Negotiation protocol as presented in [26]. We use it at the manager agents‘ level so that we can get the best integrated solution. The next section gives more information about this protocol.. 4.4. Decision Mechanisms We use two levels of negotiation. The Manager Agents Level, that is, between A/CManager, CrewManager and PaxManager. At this level they cooperate to find an integrated solution, that is, one that includes the impact on passengers, crew and aircraft. The Team Level (or Specialist Agents Level), that is, between each manager and the expert/specialist team agents. In the following sections we explain both decision mechanisms. 2. http://www.fipa.org.
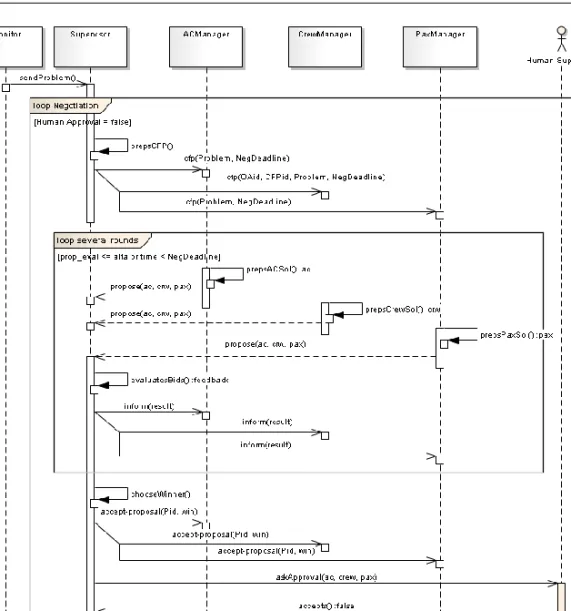
(21) Airline Operations Control: A New Concept for Operations Recovery. 79. Figure 7. User Interface (Partial) updated by the Data Visualization agent. 4.4.1. Manager agents level negotiation At this level we are using a generalization of the Q-Negotiation protocol present in Rocha & Oliveira [26, 27]. Rocha & Oliveira propose a negotiation mechanism in the context of agent-based Virtual Organisation (VO) formation process, which selects the optimal group of organisations that satisfies the VO needs. In this scenario, each organisation has the objective to maximize its own profit and, for that, the negotiation process takes into account the rationality and self-interestedness of the agents. The Q-Negotiation includes a multi-attribute negotiation with several rounds and qualitative feedback. Additionally, the agents are able to learn (adapt) their strategies during bid formulation, due to the inclusion of a Q-Learning algorithm. According to the authors ―(…) Q-Learning enables on-line learning, which is an important capability (…) where agents will learn in a continuous way during all the negotiation process, with information extracted from each one of the negotiation rounds, and not only in the end with the negotiation result‖. We believe that the Q-Negotiation protocol can be useful in our domain, given that we perform the necessary adaptation. Figure 8 shows a simplified version of the GQ-Negotiation protocol (Generic QNegotiation) that results from the adaptation of Rocha & Oliveira protocol, applied to our domain. The Monitor agent sends the problem to the Supervisor agent, including information about the dimension affected (aircraft, crew or passenger) as well as the schedule time and costs (flight, crew and passenger). The agent Supervisor assumes the role of organizer and using the information about the problem, prepares an call-for-proposal (cfp) that includes the problem, a range of preferred values for delay, flight costs, crew costs, passenger costs,.
(22) 80. António J. M. Castro and Eugénio Oliveira. Figure 8. GQ-Negotiation Protocol (simplified version). passenger trip time and a negotiation deadline. After the cfp, the first round of negotiation starts. The ACManager, CrewManager and PaxManager agents (respondent agents) present the proposal according to their interests. For example, the ACManager wants to minimize the flight costs and delay and the PaxManager wants to minimize the passengers trip time and cost. It is important to point out that the proposals presented by the respondent agents are based on the candidate solutions found by their specialist agents as explained in section 4.4.2 and 4.6. The proposals are evaluated by the Supervisor and qualitative feedback is sent to the respondent agents. At this time we use a simple function to evaluate the proposals as indicated in Equation 1.. (1).
(23) Airline Operations Control: A New Concept for Operations Recovery. 81. In this equation da, dc and tt, represents the aircraft delay, crew delay and passenger trip time; ac, cc and pc represents the aircraft cost, crew costs and passenger cost of a specific proposal. The set of aircraft delay from all proposals is represented by DA and a similar approach is followed for the other equation components. Each component has a weight represented by α, β, γ and δ with values between 0 and 1. Using the feedback, the respondent agents change their proposals. The bid formulation process uses a Q-Learning algorithm endowing the agent with the capability to learn on-line along the negotiation process. This loop of proposals and feedback ends when the Supervisor agent founds a proposal that satisfies its preferences. The respondent agents are informed of the result. After having the best solution, the Supervisor agent shows to the human supervisor the solution and the rationale behind it. The human supervisor can choose to apply it or not. If he chooses to not apply the solution, some feedback is given. For example and for a specific problem, it might be better to have lower passenger costs even if it means higher flight costs. Using this feedback, the Supervisor agent (the one with the organizer role in the negotiation process) improves the range of preferences included in the cfp and the negotiation process restarts. Before finish this section, it is important to point out that Ehlers & Langerman [28] proposed the use of an Intelligent Interface Agent that uses an hybrid approach (combination of an expert system and a Q-Learning system) to learn the preferences of the users when solving disruptions in airline schedules. Although there are some similarities (starting with the domain), we believe that our approach differs considerably. For example, we use a multiagent system that represents the AOCC and in this context, the agents are able to negotiate and learn autonomously. There are other differences but this one, by itself and in our understanding, shows the main difference between the two approaches.. 4.4.2. Team level negotiation At the Team Level we use a fipa-contract.net [29, 30] protocol with some modifications. Figure 9 presents this protocol applied to the CrewManager team. The Monitoring agent requests a solution to a specific problem. If the CrewManager agent (organizer) has expertise to propose a solution, he can decide to reply. For that, he issues a cfp (call for proposal) to start the negotiation process. On the cfp it is included information about the problem as well as deadlines for receiving an answer (refuse/propose) and for receiving the candidate solution from the responder agent (CrewSimmAnneal in the example). The respondent agent answers back with refuse or propose. If he answers with propose it means that he will seek for a possible solution according to the cfp conditions. The organizer agent answers back with an accept-proposal. To speed-up the communication, it was here that we have simplified the protocol. In our approach, we do not need to select from the received answers because we want all available agents to work in parallel. That is the reason why the answer from the respondent agents is ―yes‖ or ―no‖, meaning that they are available (or not) to seek for candidate solutions. If the respondent agent finishes the task with success, it will send the candidate solution included in the inform-result performative. If he fails, the reasons are included in a failure performative..
(24) Table 3. Summary of costs involved # 2 3. 4. 5. 6. 7. Equations. Description Total Operational Cost (tc) includes Direct Operational Costs (dc) and Quality Operational Costs (qc). Direct Operational Costs (dc) of a specific solution are costs that are easily quantifiable and are related with the operation of the flights, namely, Crew Costs (cc), Flight Costs (fc) and Passenger Costs (pc). The Crew Cost (cc) for a specific flight includes the salary costs of all crew members (Salary), additional work hours to be paid (Hour), additional perdiem days to be paid (Perdiem), hotel costs (Hotel) and extra-crew travel costs (Dhc). The Flight Cost (fc) for a specific flight includes the airport costs (Airp), i.e., charges applied by the airport operator like approaching and taxing; service costs (Service), i.e., flight dispatch, line maintenance, cleaning services and other costs; average maintenance costs for the type of aircraft that performs the flight (Maint); ATC en-route charges (Atc); and fuel consumption (Fuel), i.e., fuel to go from the origin to the destination (trip fuel) plus any additional extra fuel required. The Passenger Cost (pc) of the delayed passengers for a specific flight includes airport meals the airline has to support when a flight is delayed or cancelled (Meals), hotels costs (PHotel) and any compensation to the passengers according to regulations (Comp). Quality Operational Costs (qc) of a specific solution are costs that are not easily quantifiable and are related with passenger satisfaction. The quantification of this value is very important to increase the quality level of an airline company when facing a disruption. For more information about this topic please see section 4.5 and/or consult [31, 32]..
(25) Airline Operations Control: A New Concept for Operations Recovery. 83. Figure 9. Contract net protocol (simplified). After receiving all the candidate solutions, the organizer agent needs to select the best one. This process is explained in [32] and is based on the Total Operational Cost criteria. Table 3 summarizes the costs involved.. 4.5. Quality Operational Costs The Airline Operations Control Centre (AOCC) has the mission of controlling the execution of the airline schedule and, when a disruption happens (aircraft malfunction, crewmember missing, etc.) find the best solution to the problem. It is generally accepted that, the best solution, is the one that does not delay the flight and has the minimum direct operational cost. Unfortunately, due to several reasons, it is very rare to have candidate.
(26) 84. António J.M. Castro and Eugénio Oliveira. solutions that do not delay a flight and/or do not increase the operational cost. From the observations we have done in a real AOCC, most of the times, the team of specialists has to choose between candidate solutions that delay the flight and increase the direct operational costs. Reasonable, they choose the one that minimize these two values. Also from our observations, we found that some teams in the AOCC use some kind of rule of thumb or hidden knowledge that, in some cases, make them not choose the candidate solutions that minimize the delays and/or the direct operational costs. For example, suppose that they have disruptions for flight A and B with similar schedule departure time. To solve the problem, they have two candidate solutions: one is to delay flight A in 30 minutes and the other would delay flight B in 15 minutes. The direct operational costs for both candidate solutions are the same. Sometimes they would choose to delay flight A in 15 minutes and flight B in 30 minutes. We can state that flights with several business passengers, VIP‘s or for business destinations correspond to the profile of flight A in the above example. In our understanding this means that they are using some kind of quality costs when taking the decisions, although not quantified and based on personal experience. In our opinion, this knowledge represents an important part in the decision process and should be included on it.. 4.5.1. Quantifying Quality Costs To be able to use this information in a reliable decision process we need to find a way of quantifying it. What we are interested to know is how the delay time and the importance of that delay to the passenger are related in a specific flight. It is reasonable to assume that, for all passengers in a flight, less delay is good and more is bad. However, when not delaying is not an opinion and the AOCC has to choose between different delays to different flights which one should they choose? We argue that the decision should take into consideration the passenger‘s profile(s) of the specific flight and not only the delay time and/or operational cost. For quantifying the costs from the passenger point of view, we propose the following generic approach: 1. Define the existing passenger profile(s) in the flight. 2. Define a delay cost for each passenger in each profile. 3. Calculate the quality costs using the previous steps. Most likely, every airline company will have a different method to define the passenger profile in a specific flight. Most of the airlines will just consider one or two profiles (for example, business and economy). To get the number of passengers that belong to these profiles is very easy. Airline companies can use the flight boarding information to calculate this number. Most of the airline companies will choose to use a fixed delay cost value to each passenger of each profile. These numbers can reflect the perception of the costs from the point of view of the company or can result from a statistical analysis of the company information. In our opinion and that is one of the main contributions of our approach, we think that this cost should be calculated from the passenger point of view. This implies to use a formula to calculate the costs of each profile that represents this relation. Giving the above we believe that the quality costs should result from the relation between the number of passenger profiles in the flight and the delay cost for each passenger from their point of view, expressed by Equation 7 in Table 3..
(27) Airline Operations Control: A New Concept for Operations Recovery. 85. 4.5.2. Airline example The final goal in this real example is to be able to have passenger profiles to every flight in the company, regarding the delay cost from the point of view of the passengers. To get this information, we have done a survey to several passengers on flights of the airline company. Besides asking in what class they were seated and the reason for flying in that specific flight, we asked them to evaluate from 1 to 10 (1 – not important, 10 very important) the following delay ranges (in minutes): less than 30, between 30 and 60, between 60 and 120, more than 120 and flight cancellation. From the results we found the passenger profiles in Table 4. For the profiles in Table 4 to be useful, we need to be able to get the information that characterizes each profile, from the airline company database. We found that we can get the number of passengers of each profile in a specific flight from the boarding database, using the information in Table 5. Besides being able to get the number and characterization of profiles from the survey data, we are also able to get the trend of each profile, regarding delay time/importance to the passenger. Plotting the data and the trend we got the graph in Figure 10 (x – axis is the delay time and y – axis the importance). If we apply these formulas as is, we would get quality costs for flights that do not delay. Because of that we re-wrote the formulas. The final formulas that express the importance of the delay time for each passenger profile are presented in Table 6. It is important to point out that these formulas are valid only for this particular case and express the information we have from this specific survey data. Our goal is to update this information every year, using the annual company survey, and obtain different formulas according to flight destinations, flight schedules and/or geographical areas. Table 4. Passenger Profiles Profiles Business Pleasure Illness. Main Characteristics Travel in first or business class; VIP‘s; Frequent Flyer members; Fly to business destinations; More expensive tickets. Travel in economy class; Less expensive tickets; Fly to vacation destinations. Stretcher on board; Medical doctor or nurse travelling with the passenger; Personal oxygen on board or other special needs.. Table 5. Boarding Information Profiles Business Pleasure Illness. Relevant Fields for Profiling #C/CL pax; #VIP‘s; #Freq. Flyer; #Pax according ticket price; Departure or arrival = business. #Y/CL pax; #Pax according ticket price; Departure or arrival = vacation. #Pax special needs; Stretcher on board=yes.. Table 6. Final Quality Formulas for the Airline Example Profiles Business Pleasure Illness. Formula y = 0.16*x2+1.39*x y = 1.20*x y = 0.06*x2+1.19*x.
(28) 86. António J.M. Castro and Eugénio Oliveira. Figure 10. Case study trend formulas for the profiles. Let‘s calculate the quality operational costs for the following flight (assuming 10 as the coefficient to convert to monetary costs): Flight 103 will be delayed 30 minutes at departure. It has 20 passengers in the business profile (B), 65 in pleasure profile (P) and 1 in the illness profile (I). Applying the formulas in Table 6, the cost of 30 minutes delay for each passenger in each profile is: Bcost-103 = 0.16*302+1.38*30 = 185.4 Pcost-103 = 1.2*30 = 36 Icost-103 = 0.06*302+1.19*30 = 89.7 The quality operational cost for the flight 103 with a delay of 30 minutes is: QCcost-103 = 10*(20*185.4+65*36+1*89.7) = 61377. 4.6. Problem Solving Algorithms As it is possible to see in Figure 6 (Section 4.3), the aircraft and crew dimension have, each one, a team of specialist agents. Each agent should implement a heterogeneous problem solving algorithm on the team they belong to. Preliminary results show that a single problem solving algorithm is not able to solve, dynamically and within the required time restriction, all types of problems that we have identified during our observations (see Section 3.3). Taking advantage of the modularity, scalability and distributed characteristics of the MAS paradigm, we are able to add as many specialist agents as required, so that all types of problems are covered. As we have seen in Section 4.3 and 4.4.2, the idea is to have all specialist agents of a team looking for solutions concurrently. In this section we are going to show how we have implemented one of the specialist agents of the crew team, namely, CrewHillClimb. This agent implements a hill climb.
(29) Airline Operations Control: A New Concept for Operations Recovery. 87. algorithm. For more details regarding how we have implemented this and other specialist agents, please read Mota [33]. The hill climbing agent solves the problem iteratively by following the steps: 1. Obtains the flights that are in the time window of the problem. This time window starts at the flight date, and ends at a customizable period in the future. This will be the initial solution of the problem. The crew members‘ exchanges are made between flights that are inside the time window of the problem. 2. While some specific and customizable time has not yet passed, or a solution below a specific and customizable cost has not been found, repeats steps 3 and 4. 3. Generates the successor of the initial solution (the way a successor is generated is described below). 4. Evaluates the cost of the solution. If it is smaller than the cost of the current solution, accepts the generated solution as the new current solution. Otherwise, discards the generated solution. The way a solution is evaluated is described below. 5. Send the current solution to the CrewManager agent following the protocol as we have seen in Section 4.4.2. The generation of a new solution is made by finding a successor that distances itself to the current solution by one unit, that is, the successor is obtained by one, and only one, of the following operations: Swap two crewmembers between flights that belong to the flights that are in the time window of the problem. Swap a crewmember of a flight that belongs to the flights that are in the time window of the problem with a crewmember that isn‘t on duty, but is on standby. When choosing the first element to swap, there are two possibilities: (1) choose randomly or (2) choose an element that is delayed. The choice is made based on the probability of choosing an element that is late, which was given a value of 0.9, so that the algorithms can proceed faster to good solutions (exchanges are highly penalized, so choosing an element that is not late probably won‘t reduce the cost, as a possible saving by choosing a less costly element probably won‘t compensate the penalization associated with the exchange). If the decision is to exchange an element that is delayed, the list of flights will be examined and the first delayed element is chosen. If the decision is to choose randomly, then a random flight is picked, and a crewmember or the aircraft is chosen, depending on the probability of choosing a crewmember, which was given a value of 0.85. When choosing the second element that is going to swap with the first, there are two possibilities: (1) swap between elements of flights or (2) swap between an element of a flight and an element that is not on duty. The choice is made based on the probability of choosing a swap between elements of flights, which was given a value of 0.5. The evaluation of the solution is done by an objective function that measures the following types of costs: The crew cost according to Equation 4 in Table 3; The penalization for exchanging elements;.
(30) 88. António J.M. Castro and Eugénio Oliveira Table 7. Implementation of the hill climbing algorithm in Java GregorianCalendar currentDate = new GregorianCalendar(); int secondsExecution = (int) ((currentDate.getTimeInMillis() startDateResolution.getTimeInMillis()) / 1000); while(!Shared.to(problem.getNumSeconds(), secondsExecution, problem.getMaxCost(), currentSolutionCost)) { // get successor successor = Shared.generateSuccessor(Shared.copyArrayList(currentSolution)); // checks if successor has an inferior solution cost successorCost = Shared.calculateCost(successor, initialPlainSolution); System.out.println("Successor Cost: " + successorCost + "\n"); if(sucessorCost < currentSolutionCost) { currentSolution = successor; currentSolutionCost = successorCost; } currentDate = new GregorianCalendar(); secondsExecution = (int) ((currentDate.getTimeInMillis() startDateResolution.getTimeInMillis()) / 1000); }. The penalization for delayed elements. The cost associated with this aspect is the highest, because the goal is to have no delayed elements. The Hill Climbing Objective Function (hc) is given by Equation 8. (8) hc = cc + excW * nExc + delayW * nDelay In this equation, cc represents the crew cost calculated according to equation 4 (table 3), excW represents the penalization for crew exchanges, nExc represents the number of crew exchanges, delayW represents the penalization for delaying crewmembers and nDelay the number of delayed crewmembers.. 5. EXPERIMENTAL SETUP To evaluate our approach we have setup a scenario that includes 3 operational bases (A, B and C). Each base includes their crewmembers each one with a specific roster. The data used corresponds to a real airline operation of June 2006 of base A. A scenario was simulated where 15 crewmembers, with different ranks, did not report for duty in base A. In table 7 we present the collected information for each event..
(31) 89. Airline Operations Control: A New Concept for Operations Recovery Table 7. Information collected. 6 7 8 9 10 11 12 13 14 15. 114. 1ORY85P. 0. 10. 112. 2LIS24X. 30. 0. 90. 3LIS25X. 25. 3. 77. 2LHR63P. 5. 25. 85. 2LHR63P. 0. 20. 95. 1LHR31P. 0. 23. 52. 2LHR19P. 10. 27. 105. 1ZRH12X. 0. 5. 115. 1LIS16S. 20. 3. 97. 1LIS16S. 5. 2. 108. 1LIS158T. 0. 4. 92. 3LIS174S. 0. 1. 129. 4LIS50A. 0. 2. 83. C Pax. Crew Name. 11. 06-06 01:35 06-06 01:35 06-06 01:35 17-06 04:15 15-06 21:20 17-06 08:45 17-06 08:45 16-06 08:55 17-06 08:45 17-06 21:30 26-06 03:05 26-06 03:05 26-06 03:05 28-06 04:15 29-06 07:40. 370. 2. CAB. 80. John A. 370. 2. CAB. 45. Mary A. 370. 1. CPT. 35. Anthony. 1757. 2. CAB. 99. Paul M. 632. 2. CAB. 56. John B. 1549. 1. CPT. 57. Paul S. 1549. 1. OPT. 53. Mary S. 843. 2. CCB. 23. Sophie. 1341. 2. CCB. 34. Angel. 1318. 1. CPT. 32. Peter B. 585. 2. CAB. 20. Paul G. 585. 2. CAB. 10. Alice. 585. 2. CAB. 15. Daniel. 1258. 2. CAB. 71. George. 219. 1. OPT. 65. Allan. Crw Nr. 10. 05-06 13:35 05-06 13:35 05-06 13:35 16-06 16:15 15-06 09:20 16-06 20:45 16-06 20:45 15-06 20:55 16-06 20:45 17-06 09:30 25-06 15:05 25-06 15:05 25-06 15:05 27-06 16:15 28-06 19:40. Cred Min. 1ORY149S. Y Pax 123. Flt Dly 7. Rnk. 5. 0. Crew Grp. 4. 1ORY149S. Ready DateTime. 3. 05-06 07:25 05-06 07:25 05-06 07:25 15-06 04:10 15-06 04:10 15-06 12:50 15-06 12:50 15-06 14:15 15-06 15:25 15-06 15:25 25-06 05:20 25-06 05:20 25-06 05:20 25-06 06:15 25-06 14:20. End DateTime. 2. Duty ID. 1. Duty Date Time. Table 8. Events used (testing).
(32) 90. António J.M. Castro and Eugénio Oliveira Table 9. Partial data for method 4 Duty ID 1 2 3 4 5 6 7 8 9 10 11 12 13 14 15. 1ORY149S 1ORY149S 1ORY85P 2LIS24X 3LIS25X 2LHR63P 2LHR63P 1LHR31P 2LHR19P 1ZRH12X 1LIS16S 1LIS16S 1LIS158T 3LIS174S 4LIS50A Totals. Base ID. Crew Grp. B A C B B C B B C B C A C B A. 2 2 1 2 2 1 1 2 2 1 2 2 2 2 1. Rank CAB CAB CPT CAB CAB CPT OPT CCB CCB CPT CAB CAB CAB CAB OPT. Hour Pay 0,00 0,00 0,00 637,77 0,00 102,90 37,22 229,17 0,00 0,00 0,00 0,00 0,00 985,00 152,72 1844,77. Perdiem Pay 72,00 72,00 106,00 144,00 72,00 212,00 144,00 72,00 144,00 212,00 80,00 80,00 31,00 216,00 288,00 1945,00. Quality Op. Cost 0 501,31 0 838,11 1021,42 272,10 0 0 788,78 0 426,98 144,34 0 0 0 3993,02. Direct Op. Cost 86,40 72,00 148,40 938,12 86,40 440,86 217,46 361,40 201,60 254,40 112,00 180,00 43,40 1081,20 440,72 4564,36. Each event corresponds to a crewmember that did not report for duty in a specific day. The data for each event is presented in Table 8. As an example, event 15 corresponds to the following: Allan, a crewmember with number 65 and rank OPT (first officer), belongs to crew group 1 (flight crew), did not report for duty with ID 4LIS50A with briefing time at 14:20 in 25-06-2006. This flight has 83 economy passengers and 2 business passengers and it did not delay on departure. The new crewmember must have the same rank and belong to the same group. The duty ends at 19:40 on 28-06-2006 and the rest period end at 07:40 in 29-062006. For the payroll, the duty will contribute with 219 minutes. Solutions were found after setting-up the scenario, using four different methods. The first three methods, named Human (M1), Agent-no-Quality (M2) and Agent-Quality (M3) are explained in [32]. Basically, in the human method we have used a human controller from the AOCC, using current tools, to find the solutions. In the agent-no-quality an agentbased approach was used without considering the quality costs as presented in equation 7 in table 3. In the agent-quality method it was considered the quality costs. For more information, please read [32]. In the fourth method, we have used the approach presented in section 4, but without the user feedback (see section 4.4.1). Table 9 presents the collected data.. 6. RESULTS AND DISCUSSION For each method the experimentation results are presented in table 10. The discussion that compares method 1 (human), method 2 (agent-no-quality) and method 3 (agent-quality) was presented in our previous work [32]. Here, we are going to concentrate our attention in comparing the agent-quality approach with the one presented in this chapter (integrated). In the integrated approach we use the two levels of negotiation as explained in section 4.4 but without the user feedback. From the results we can see the following:.
(33) 91. Airline Operations Control: A New Concept for Operations Recovery Table 10. Results summary Human (M1) Total % Event base: - From base (A) - From base B - From base C Time to Find Solution (avg sec) Flight Delays (avg min): - Base A (avg) - Base B (avg) - Base C (avg) Direct Operational Costs: Total by Base: - Base A - Base B - Base C Quality Operational Cost: Total by Base: - Base A - Base B - Base C Total Operational Costs: Total by Base: - Base A - Base B - Base C. Agent-no-Quality (M2) Total %. Agent-Quality (M3) Total %. Integrated (M4) Total %. 7 6 2. 47% 40% 13%. 3 7 5. 20% 47% 33%. 3 7 5. 20% 47% 33%. 3 6 6. 20% 40% 40%. 101. 100.00%. 25. 24.75%. 26. 25.74%. 28. 27.72%. 11. 100.00%. 7. 63.64%. 6. 54.54%. 14 9 12 3839.36. 40% 26% 34% 54.54%. 7 4 12 4130.07. 30% 17% 52% 58.67%. 5 6 6 4564.36. 29% 35% 35% 64.84%. 288.00 1275.80 2275.56 7788.47. 11.23% 49.77% 88.77% 100%. 578.83 1429.54 2121.70 4781.53. 14.02% 34.61% 51.37% 61.39%. 592.72 3025.38 946.26 3993.02. 12.99% 66.28% 20.73% 51.27%. 1649.57 3617.66 2521.24 11628.01. 21.18% 46.45% 32.37% 165%. 593.30 1562.19 2626.04 8911.60. 12.41% 32.67% 54.92% 126.6%. 645.65 1859.52 1487.86 8557.38. 16.17% 46.57% 37.26% 121.6%. 1937.57 4088.42 4796.80. 16.66% 35.16% 41.25%. 1172.13 2991.73 4747.74. 13.15% 33.57% 53.28%. 1238.37 4884.90 2434.12. 14.47% 57.08% 28.44%. 7039.60. 100.00%. 4845.55 1796.40 397.60. 92.42% 34.26% 7.58%. The integrated method decreases the flights delays in approximately 14.30% (on average). The flight delays in each base are much more balanced than with any of the other methods. For example, with the quality method we got 7 minutes delay in base A, 4 in base B and 12 in base C. With our approach we got 6 minutes delay in base A, 6 in base B and the same value in base C (average values). The quality costs with the integrated method decreased on average 16.48%. The total operational costs decreased on average 3.95%. The direct operational costs increased on average 10.51%. The time to find a solution increased on average 7.69%. These results are encouraging. We see that the flight delays, quality costs and total operational costs decrease. However, the direct operational costs increased around 10% and this value can correspond to a significant amount of money. If we read this figure as-is, we have to consider that we did not achieve an important goal. In our opinion, this result should be interpreted together with the flight delay result. Although the integrated method increases.
(34) 92. António J.M. Castro and Eugénio Oliveira. the direct operational costs in 10% it was able to select solutions that decrease the flight delays in 14.30%. So, when there are several solutions to the same problem, the integrated method is able to select the solution with less quality costs (corresponds to better passenger satisfaction), less operational cost and, due to the relation between flight delays and quality costs, the solution with less flight delays. Considering the above conclusion how does it compare with minimizing the direct operational cost and the expected flight delay? It is a reasonable question because the flight delay is the variable that has the biggest impact on passenger satisfaction and we could expect that the results were the same. So, in general, we might say that this assumption is true. But what should happen when we have two solutions for the same problem, with the same delay and direct operational cost? Which one should we choose? For us, it depends on the on-board passenger profiles and the importance that they give to the delays. It is this important value that we capture with our quality operational cost. Our approach uses all this criteria to achieve the best integrated solution and, because of the GQ-Negotiation protocol, we were able to decrease the quality operational costs in 16.48% when compared with the agentquality approach (that also uses quality operational costs). Regarding the time to find a solution, the integrated approach took 7,69% more time than the agent-quality. The fact that we are using a negotiation protocol at the Managers Level explains this Figure. However, the average time (28 seconds) is still within the acceptable values, so this increase as a minor impact on the proposed approach. It is important to point out that we need to evaluate a higher number of scenarios with data from the all year. The air transportation domain has seasonal behaviours and that might have an impact on the results we have found in our work. Nevertheless, we believe that these results are encouraging.. 7. CONCLUSION We have introduced the Airline Operations Control Problem as well as the Airline Operations Control Centre (AOCC), including typical organizations and problems, the current disruption management (DM) process, a description of the main costs involved and a classification of current tools and systems. We proposed a new concept for disruption management in airline operations control, where the most repetitive tasks are performed by several intelligent software agents, integrated in a multi-agent system that represents the AOCC. We found that the multi-agent paradigm is very adequate to model this type of problems and, as such, we presented the reasons that make us adopt it. A description of the proposed solution with agents and some of their characteristics (social-awareness and autonomy, for example), as well as their roles and protocols used, was included. We presented the costs criteria as well as the negotiation algorithms used as part of the decision mechanisms. Four different methods were used to test our approach using data from an airline company. The results show that with our approach and when compared with methods that minimize direct operational costs, it is possible to have solutions with shorter flight delays while contributing to better passenger satisfaction..
Imagem
+7

Documentos relacionados
For that, different parameters of the EHDA process will be tested, namely, the voltage, the flow rate, the needle diameter, the distance between the needle and the collector (TTC),
Each particle of the flow gets into the front funnel of a channel, then moves through the channel along the body boundary, and escales through the rear funnel, and its final
O Lar de Idosos é uma resposta social desenvolvida em alojamento colectivo, de utilização temporária ou permanente, para idosos em situação de maior risco de perda de
Padrão de conduta ou “max lag” definitivo para a conduta critério de Início da Transição – Estado defesa/ataque por recuperação da posse de bola por acção defensiva seguida
Apesar de as plantas das duas cultivares have- rem apresentado maior crescimento vegetativo quando houve remoção dos botões florais, mesmo no menor período de tempo testado, 15
La Organización Mundial del Turismo (OMT) ha reconocido una sensibilización del turista por aspectos ambientales. Este factor va más allá de la diversificación motivacional,
A partir do que foi proposto no artigo, considera-se de fundamental importância a criação da primeira Liga Acadêmica de Psicologia da Saúde Comunitária
Neste recorte de um projeto de pesquisa intitulado “Estudo Socioeconômico e Demográfico da População Idosa no Meio Rural do Município de Santa Cruz do Sul”, de caráter
