Ryanair Holdings PLC
Equity Valuation Research
Diogo Leite
Dissertation written under the supervision of
Professor José Carlos Tudela Martins
Dissertation submitted in partial fulfilment of requirements for the MSc in
Finance, at the Universidade Católica Portuguesa, December 12th 2017.
Abstract
Ryanair Holdings PLC is an airline, offering short-haul services between UK, Ireland, Continental Europe and Morocco. They offer it through a single route scheduling system, providing an ultra-low fare without connections. They carry more than 131 million of customers per year with more than two thousand flights every day.
This dissertation presents an Equity Valuation of Ryanair Holdings PLC, the European leader in terms of commercial aviation and one of the most international companies in Ireland. It will provide a deeper analysis of the company in order to apply two different valuation methods: Discounted Cash Flow and Relative (or Multiples) Valuation. Afterwards, there will be a comparison between this dissertation and an equity research from Credit Suisse.
Resumo
Ryanair Holdings PLC é uma companhia aérea que oferece voos de curta duração entre o Reino Unido, a Irlanda, o continente europeu e Marrocos. A Ryanair oferece este serviço através de um sistema singular, proporcionando um conjunto de tarifas de baixo custo sem a possibilidade de efetuar escalas. A companhia transporta mais de 131 milhões de passageiros por ano com mais de dois mil voos todos os dias.
Esta dissertação apresenta uma avaliação da empresa Ryanair Holdings PLC, a líder europeia em termos de aviação comercial e uma das empresas mais internacionais na Irlanda. Será realizada uma análise completa da empresa de forma a aplicar dois métodos de avalição diferentes: Discounted Cash Flow e Avaliação Relativa (ou por Múltiplos). Após a avaliação, será realizada uma comparação entre esta dissertação e um relatório do Credit Suisse.
Acknowledgments
For now, I can say that this dissertation is my last step in my academic career. Almost 17 years after starting to study, I am happy to say I made a lot of friends both in Porto and Lisbon (never forgetting the period when I was abroad in 2012) and many of them have helped me in order to fulfill my goals and overtake any difficulty I have ever faced.
I will start with my family: they have been my foundation for everything, both in my personal or my academic life. Without them (including my parents, brother and grandparents), I would never be able to complete my master degree and be the person I am right now.
I also thank my friends, the ones who played a decisive role in my life. I am lucky to have them in my life and much of what I am today I owe them. I highlight the ones I keep from Espinho (my hometown), Porto (bachelor’s degree) and Lisbon; there is no need to refer names, they know it already.
Finally, I would thank all my teachers who helped me throughout all these years, mainly professor José Carlos Tudela Martins for his support and availability during the last semester of my academic life.
Contents Index
1. Introduction ... 1
2. Literature Review ... 2
2.1 Discounted Cash Flow ... 2
2.1.1 Free Cash Flow to Firm ... 3
2.1.2 Free Cash Flow to Equity ... 4
2.1.3 Adjusted Present Value ... 5
2.2 Dividend Discount Model ... 6
2.3 Multiples Valuation ... 7
3. Overview ... 8
3.1 Industry ... 8
3.1.1 LCCs ... 8
3.1.2 Five Forces of Porter ... 11
3.2 Ryanair ... 11 3.2.1 SWOT ... 13 4. Methodology ... 15 4.1 Forecasts ... 15 4.1.1 Operating Revenues ... 15 4.1.2 Operating Expenses ... 17 4.1.3 Payout Policy ... 19 4.1.4 CAPEX ... 20
4.1.5 Net Working Capital ... 20
4.1.6 Debt ... 21
4.1.7 Tax Rate ... 21
4.2 Valuation ... 21
4.2.1 Discounted Cash Flow ... 22
4.2.1.1 Free Cash Flow to the Firm ... 22
4.2.1.2 Discount Rate ... 22
4.2.1.4 Estimated Price ... 25
4.2.2 Multiples ... 26
4.2.2.1 Peer Group ... 26
4.2.2.2 Estimated Price ... 27
4.3 Sensitivity Analysis ... 28
5. Equity Research Comparison ... 30
6. Conclusion ... 33
7. Appendixes ... 34
7.1 Income Statement 2017-25, in million euros (source: own computations and Ryanair 2017FY Annual Report) ... 34
7.2 Balance Sheet 2017-25, in million euros (source: own computations and Ryanair 2017FY Annual Report) ... 35
7.3 Cash Flow Statement 2017-25, in million euros (source: own computations and Ryanair 2017FY Annual Report) ... 37
7.4 Net Working Capital 2017-25, in million euros (source: own computations and Ryanair 2017FY Annual Report) ... 38
7.5 CAPEX 2017-25, in million euros (source: own computations and Ryanair 2017FY Annual Report) ... 39
7.6 Depreciations 2017-25, in million euros (source: own computations and Ryanair 2017FY Annual Report) ... 40
7.7 Number of Aircrafts 2018-24 and Total (source: Ryanair 2017FY Annual Report) ... 41
Graphs Index
Graph 1 - Low Cost vs Full Service Flights (source: StatFor) ... 9 Graph 2 - LCC share of available seats in 2016 (source: IATA) ... 9 Graph 3 - Ryanair's airports by number destinations 2007-17 [share of destinations operating in 2017] (source: anna.aero) ... 12 Graph 4 - Ryanair's stock price performance 2012-17 (source: Thomson Reuters) ... 13 Graph 5 - Weight of each expense on total operating expenses (source: 2017FY
Tables Index
Table 1 - Types of Multiples (source: Corporate Finance Institute) ... 7
Table 2 - Forecast of Scheduled Revenues 2016-24 (source: own computations) ... 15
Table 3 - Forecast of Operating Revenue 2016-24 (source: own computations) ... 16
Table 4 - Forecast of Operating Profit in absolute terms 2016-24 (source: own computations) ... 18
Table 5 - Forecast of Operating Profit on a per passenger basis 2016-24 (source: own computations) ... 19
Table 6 - Historical and Scheduled Ryanair's payout (source: 2017FY Ryanair Annual Report) ... 19
Table 7 - FCFF computation 2018-24 (source: own computations) ... 22
Table 8 - Computation of Debt Value of Operating Leases (source: own computations) ... 24
Table 9 - Computation of Non-Traded Debt (source: own computations) ... 24
Table 10 - Ryanair's bonds (source: 2017FY Ryanair Annual Report) ... 24
Table 11 - Terminal Value computation 2018-24 (source: own computations) ... 25
Table 12 - DCF estimated price (source: own computations) ... 26
Table 13 - Peer Group and Multiples (source: Thomson Reuters) ... 27
Table 14 - Estimated price from EV/EBITDA (source: own computations) ... 28
Table 15 - Estimated price from P/E Ratio (source: own computations) ... 28
Table 16 - Sensitivity analysis through WACC and Growth Rate (source: own computations) ... 29
Table 17 - Sensitivity Analysis through Fuel&Oil and Airport&Handling Charges (source: own computations) ... 29
Table 18 - Forecast 2018-24 comparison between Dissertation and Credit Suisse (source: own computations and Credit Suisse Equity Research) ... 30
Table 19 - Valuation comparison between Dissertation and Credit Suisse (source: own computation and Credit Suisse Equity Research) ... 31
1. Introduction
Ryanair is the leading airline in Europe, transporting more than 131 million of customers per year with more than two thousand flights every day. They connect more than two hundred destinations in Europe and North Africa. The future looks positive: Ryanair has more than two hundred ordered aircrafts for the next seven years, as they look to lower fares and grow even more in terms of carried passengers. In 2017, Ryanair has become the first airline in Europe to achieve a total of 1 billion customers.
This dissertation will focus on Ryanair, as the main purpose is to value the company’s business in order to achieve a final share price per stock unit. After getting this value, we will be able to compare it to the market and to other researches and we will conclude whether investors should buy, hold or sell their positions.
We will divide the dissertation in four main parts. The first one is Literature Review and it will explain the concepts behind the valuation, including used models. Then, we chose to provide an Overview of both the aviation industry and Ryanair to give a closer perception to the reader. We call the third part Methodology, as it will include forecasts for the next years as well as the valuation, using DCF and multiples approaches, and respective sensitivity analysis. Finally, we will compare our final result to the one achieved by Credit Suisse Equity Research Team, explaining the main differences and similarities.
2. Literature Review
According to Damodaran (2006), it is really important to determine where the value of each company is coming from. It arises in three different ways: generating cash flows, expected growth and respective risk; however, it is really difficult to find a model fitting everything in a perfect way, so the best option is to use more than one model. Related to each model, we have some assumptions to do: this is what will make the results reliable and pretty close to a perfect one.
In this section, we will talk about valuation models, especially the most used ones: Discounted Cash Flow, Dividend Discount Model and Multiples Valuation. While describing each model, it will be explained its preponderancy in Ryanair’s valuation.
2.1 Discounted Cash Flow
Discounted Cash Flow method presents future growth of the company, while discounting specific risk with the discount rate from each industry. It assumes that present values of the company are equal to future cash flows’ present value.
As it is impossible to forecast a long period, the company’s value will be the sum of the present value of cash flows with the residual value of the company. The residual value is the company’s value resulting from future cash flows, outside the forecasted period. This section will focus on three main models: Free Cash Flow to the Firm, Free Cash Flow to Equity and Adjusted Present Value, since these are the most important and most used all over the world.
Ryanair has shown a stable capital structure in the last five years, so I chose to work with a discount cash flow method using WACC as a discount factor. This means I will use Free Cash Flow to the Firm model to get an enterprise value of this Irish airline.
2.1.1 Free Cash Flow to Firm
According to Janiszewski (2011), “Free cash flows to firm are the cash flows that are available to all providers of the company’s capital, both creditors and shareholders, after covering capital expenditures and working capital needs”. This means FCFF are realized in an unlevered way and it will reflect all the cash coming from the assets.
First step includes calculating the FCFF value. It will deduct taxes (T) from the firm’s earnings before interests and taxes (EBIT), add depreciations and amortizations (D&A) due to being non-cash movements and, finally, deduct capital expenditure (CAPEX) and changes in net working capital (∆ NWC) because it is not reflected in the calculations of EBIT and it is possible to happen an increase in cash requirements, respectively. The following equation reflects this first step.
𝐹𝐶𝐹𝐹 = 𝐸𝐵𝐼𝑇 (1 − 𝑇) + 𝐷&𝐴 − ∆ 𝑁𝑊𝐶 − 𝐶𝐴𝑃𝐸𝑋 (1)
Secondly, we need to compute WACC, which consists on “the rate at which the cash flows must be discounted to obtain the same result as in the valuation using equity and debt cash flows discounted at the required return to equity (cost of equity - Ke) and to debt (cost of debt - Kd)” (Fernandez, 2010). Its calculation is described in equation (2).
𝑊𝐴𝐶𝐶 = 𝐸
𝐷+𝐸∗ 𝐾𝑒(𝑙𝑒𝑣𝑒𝑟𝑒𝑑) + 𝐷
𝐷+𝐸∗ 𝐾𝑑(𝑙𝑒𝑣𝑒𝑟𝑒𝑑) ∗ (1 − 𝑇) (2)
It is very difficult to predict returns, however we can estimate it through Capital Asset Pricing Model (CAPM). In this method, we will use the risk-free rate (Rf), a levered beta coefficient1 (β levered) and market risk premium2 (MRP) to calculate the Cost of Equity.
Equation (3) shows how to compute the cost of equity by CAPM.
𝐾𝑒 = 𝑅𝑓 + 𝛽𝑙𝑒𝑣𝑒𝑟𝑒𝑑∗ 𝑀𝑅𝑃 (3)
Regarding Cost of Debt and following Damodaran (2012), we will consider three different values: the risk free rate, debt’s tax advantages and default risk. If the company has long-term bonds outstanding, we use the yield as a proxy to delong-termine the cost of debt;
1 Beta is a “systematic risk coefficient for market assets, stock brokers, investment managers…” (Fabozzi and Francis, 1978)
2 Market Risk Premium is the excess return obtained by bearing the market risk, compared to the risk free rate (MRP = Expected Return – Risk Free Rate)
otherwise, it is computed according to the investment rating and the default spread associated to a specific rating. Equations (4) and (5) shows how to calculate an after tax cost of debt.
𝑃𝑟𝑒 𝑇𝑎𝑥 𝐾𝑑 = 𝐷𝑒𝑓𝑎𝑢𝑙𝑡 𝑆𝑝𝑟𝑒𝑎𝑑 + 𝑅𝑓 (4)
𝐴𝑓𝑡𝑒𝑟 𝑇𝑎𝑥 𝐾𝑑 = 𝑃𝑟𝑒 𝑇𝑎𝑥 𝐾𝑑 ∗ (1 − 𝑇) (5)
Next, we will need to include the terminal value of the firm because this means the company achieved a steady state, in other words, ““the company remains qualitatively similar year by year after the valuation horizon and that it has a stable development of earnings, free cash flows, dividends and residual income” (Levin and Olsson, 2000). The company will now have a stable growth (g) and this rate is computed on equation (6).
𝑔 =𝑅𝑒𝑡𝑎𝑖𝑛𝑒𝑑 𝐸𝑎𝑟𝑛𝑖𝑛𝑔𝑠
𝐸𝑎𝑟𝑛𝑖𝑛𝑔𝑠 ∗ 𝑅𝑂𝐸 (6)
Finally, in order to get the company’s value, we will discount the free cash flows to the firm by the WACC and include the growth rate in the same computation, as described in equation (7). 𝐶𝑜𝑚𝑝𝑎𝑛𝑦′𝑠 𝑉𝑎𝑙𝑢𝑒 = ∑ 𝐹𝐶𝐹𝐹𝑡 (1+𝑊𝐴𝐶𝐶)𝑡+ 𝑁 𝑇=1 𝐹𝐶𝐹𝐹𝑁+1 𝑊𝐴𝐶𝐶−𝑔 (1+𝑊𝐴𝐶𝐶)𝑁 (7)
2.1.2 Free Cash Flow to Equity
According to Pinto (2015), free cash flow to equity is “the cash flow available to the company’s holders of common equity after all operating expenses, interest and principal payments have been paid and necessary investments in working and fixes capital have been made”.
It can be calculated deducting capital expenditures and net value with debtholders (payments and receipts, represented by DNV) from the operations’ amount. Equation (8) show the computation of FCFE, where NI represents the net income.
We will also need to discover the required factor to discount all cash flows and the most appropriated one is the return that investors demand to invest on company’s equity (cost of equity). It can be computed in the same way as in Free Cash Flow to Firm.
Finally, we discount the free cash flows to equity by cost of equity (Ke) and we will again include in the computation the terminal value, as we can see on equation (9).
𝐶𝑜𝑚𝑝𝑎𝑛𝑦′𝑠 𝑉𝑎𝑙𝑢𝑒 = ∑ 𝐹𝐶𝐹𝐸𝑡 (1+𝐾𝑒)𝑡+ 𝑁 𝑇=1 𝐹𝐶𝐹𝐸𝑁+1 𝐾𝑒−𝑔 (1+𝐾𝑒)𝑁 (9)
2.1.3 Adjusted Present Value
Adjusted Present Value (APV) tends to be considered as one of the best valuation methods by most authors. It is really important because it is able to capture changes in the capital structure of the company over the time. It is considered by many authors as “especially versatile and reliable” (Luehman, 1997), permitting a better approach to all elements which are being evaluated.
APV will compute the value of the company in three steps. First, we need to calculate the firm’s value as if it was totally equity financed (no debt), using the unlevered cost of equity [(Ke(unlevered)].
Secondly, we will take into account all positive effects coming from the debt side, namely “tax savings obtained through the payment of the debt’s service” (Fernandez, 2004): this is called Interest Tax Shield (ITS).
The last step includes computing the present value of financial distress costs. In this step, we will include the probability of default (PD) and all costs related with bankruptcy. This includes direct and indirect costs.
Equation (10) reflects the process of computing an enterprise value with adjusted present value. 𝐶𝑜𝑚𝑝𝑎𝑛𝑦′𝑠 𝑉𝑎𝑙𝑢𝑒 = ∑ 𝐹𝐶𝐹𝐹𝑡 (1+𝐾𝑒(𝑢𝑛𝑙𝑒𝑣𝑒𝑟𝑒𝑑))𝑡+ 𝑁 𝑇=1 𝐹𝐶𝐹𝐹𝑁+1 𝐾𝑒(𝑢𝑛𝑙𝑒𝑣𝑒𝑟𝑒𝑑)−𝑔 (1+𝐾𝑒(𝑢𝑛𝑙𝑒𝑣𝑒𝑟𝑒𝑑))𝑁 + 𝐼𝑇𝑆 + 𝑃𝐷 ∗ 𝐵𝐶 (10)
Despite all the positive things, it is really challenging to perform this valuation because it will be hard to measure distress and agency costs, as well as personal taxation. Interest Tax Shields can be discounted using Cost of Debt, while it is difficult to measure and calculate Bankruptcy Costs.
2.2 Dividend Discount Model
Dividend Discount Model consists on computing a stock’s value by “forecasting dividends and discounting them to the present” (Damodaran, 2002). This model is based on two big factors: dividends per share (DPS) and cost of equity (Ke).
The following equation shows how we can use the dividend discount model, always keeping in mind the same idea: “when investors buy stocks, they generally expect to get two types of cash-flow – dividends during the period she holds the stock and an expected price at the end of the holding period”. As the expected price is influenced by dividends on the future, the “value of a stock is the present value of dividends through infinity” (Damodaran, 2002).
𝑉𝑎𝑙𝑢𝑒 𝑜𝑓 𝑠𝑡𝑜𝑐𝑘 (𝑝𝑒𝑟 𝑠ℎ𝑎𝑟𝑒) = ∑ 𝐸(𝐷𝑃𝑆)
(1+𝐾𝑒)𝑡
𝑡=∞
𝑇=1 (11)
On equation (12), we see how to compute the value of the stock using the modified Gordon Growth Model. It is the simplest and the most used one because it fits companies with similar or lower growth rates than the growth rate in the economy and companies intending to continue on the future with the same dividend payout policies. In this model, we will use a dividend’s expected growth rate (g) as one of the inputs.
𝑉𝑎𝑙𝑢𝑒 𝑜𝑓 𝑠𝑡𝑜𝑐𝑘 =𝐷𝑃𝑆𝑡+1
𝐾𝑒−𝑔 (12)
Despite being considered as one of the simplest models to value equity, we have a lot of assumptions to be made: growth rate can’t exceed the cost of equity, financial policies must stay similar to the ones we have at the moment and FCFE should be always close to the amount of dividends.
Ryanair has an unstable dividend payout policy, they just don’t follow any pattern about when and how much they will distribute dividends. Because of this fact, Dividend Discount Model was ignored.
2.3 Multiples Valuation
Multiples valuation (or relative valuation) consists in a “valuation of corporate assets based on similar assets in the market” (Damodaran, 2016). This is a simple method, but some tricks are needed in order to perform a good valuation.
Firstly, we need to define the most appropriate peer group: it is not easy, we may be taking into account a lot of factors, however this is a crucial point in the method. Some examples of variables that can help us to choose a “good” peer group are market, sales, return on invested capital or earnings.
Equity Enterprise Value (EV)
Price-Earnings Ratio EV-Sales
Price-Book Ratio EV-EBITDA
Dividend Yield EV-EBITDAR (…Rental costs)
Price-Sales EV-Invested Capital
Table 1 - Types of Multiples (source: Corporate Finance Institute)
Then, the next step consists in choose the multiples to use. There are two main groups of multiples: equity (much affected by varying levels of debt) and enterprise-value. I will use one from each group: Price-Earnings Ratio (PER), due to its relevancy in researches and financial reports, and Enterprise Value-to-EBITDA (EV/EBITDA), respectively. Actually, this enterprise-value multiple is the most used in aviation because “industry’s high fixed costs (related to owning airplanes) result in significant depreciation, amortization and rent expenses”3. Besides this, it is able to avoid manipulation in
depreciation accounts.
3. Overview
3.1 Industry
The airline industry is known for its intense competition between companies with a giant focus on the price, leading to a greater efficiency. In terms of number of passengers, it has been rising since people are willing to travel more often. Technological improvements, new business models and efficiency developments are absorbing inflation and enabling more people to fly.
From the beginning of commercial air traffic, the airline industry have been growing a lot, even after we compare with GNP trend and productivity increases. Industry has been liberalized slowly over the past years and new companies with new business models are contributing to a rise in total market.
This industry has increased their revenues in the last ten years from US$354 billion to US$756 billion. In spite of the rising revenues, profit margin is decreasing, mainly because of the intense competition between airlines. Recently (last five years), the margin is falling between three and five percent.
Low Cost Carriers (LCCs) are one of the newest business models in the industry. They have been increasing its significance since the 1990s. In opposite, existing airlines continue to fly with unchanged or small rising volumes. Actually, LCCs (in which Ryanair is included) represent 25 percent of the worldwide market.
3.1.1 LCCs
Low Cost Carriers have played a big role in the expansion of the airline industry, they have been the key to this recent success. This low cost model focus on reducing costs: secondary airports, quick transfers in airports, no in-flight service and charges on all extra services, from reserved seat to early check in. LCC usually flies on short-haul routes, so they can return to its hub and avoid unnecessary costs on other airports.
LCC is one of the quickest growing market segment in the industry, especially if we compare to Traditional Scheduled or Full Service Airline (FSA). In the last ten years, low cost flights increased by 61 percent (from five thousand to eight thousand per day in 2016), while FSA flights decreased 10 percent. Recent examples show that LCC is the only sector which is growing during periods of economic and political instability.
Graph 1 - Low Cost vs Full Service Flights (source: StatFor)
According to Graph 1, LCC share of flights climbed from 19 percent in 2007 to 30 percent in 2016, completing almost a third of total traffic in the world. In opposite, FSA flights decreased from 59 percent to 53 percent in the period of time.
Graph 2 - LCC share of available seats in 2016 (source: IATA)
0% 20% 40% 60% 80% 2007 2008 2009 2010 2011 2012 2013 2014 2015 2016 LCC FSA 0% 10% 20% 30% 40% 50% 60% Southeast Asia Europe North America
Middle East Northeast Asia
Southeast Asia is the leading region in terms of LCC share of available seats with a maximum number of 58 percent in 2016. Both LCC and FSA are increasing a lot in this region, mainly due to tourism. Thai Lion Air and Air Asia are the biggest players in this part of Asia.
In North America, LCC are clearly an active player in the market (30 percent), however they have not the same role as Southeast Asia. We can highlight Southwest as the biggest one with 14 percent of all flights in United States. JetBlue Airways and Spirit are also important airlines in North America.
Middle East, Northeast Asia and Africa are not so relevant in terms of LCC, especially because of liberalized air spaces in the first case or market access barriers in the last one. Despite being property of Emirates, Fly Dubai is starting to have some impact in the Middle East region, where LCC share of all available seats is slightly above 20 percent. The industry of aviation inside Europe has come under pressure due to a big increase in competition and overcapacity. To compete with LCCs, network airline companies are giving and outsourcing a huge amount of short-haul flights to their own LCCs or even production companies. For example, IAG, Lufthansa and Air France-KLM downgraded a lot of flights to Vueling, Eurowings and Transavia, respectively.
The five European countries leading in terms of number of LCC flights are Germany, Spain, France, the United Kingdom and Italy. Even more important than this data, in Spain, LCCs are already more widespread than Full Service ones.
However, two big companies represents almost half of all LCC movements in Europe: Ryanair with 26 percent and EasyJet with 19 percent. The third biggest one, named Air Berlin, will disappear in October 2017 and represented 8 percent of all LCC flights in Europe at the end of 2016.
In terms of airports, we can highlight five with the largest numbers of LCC movements per day in Europe: London Gatwick (hub for EasyJet), London Stansted and Barcelona (hubs for Ryanair), Dusseldorf (hub for Air Berlin) and Istanbul Sabiha Gökçen.
3.1.2 Five Forces of Porter
Bargaining Power of Suppliers is low due to the fact that airlines can choose all
suppliers (from fuel to services) they want. They are free to choose from a wide list in almost everywhere, except in terms of aircrafts. Airbus and Boeing dominate 80 percent of the market and airlines tend to choose one of these to be the main supplier.
Bargaining Power of Customers is high because, nowadays, it is easy to compare fares
between different airlines and customers do not face switching costs.
Threat of Potential Entrants is low mainly because of two big reasons. The first one is
the high investment a new airline would need: for example, the standardized model of Ryanair (Boeing 737-800) costs $96 million. If we take into account a new airline would also need a lot of staff, it becomes difficult to enter the market. The second reason is related with slots and routes available: big and most important airports have all their slots occupied and some routes have a maximum level of movements allowed per day.
Threat of Substitutes is also low because there is no other mean of transport than can
take people from one place to another so quickly and cheaply as an airplane. Airplane is a quicker, more comfortable and sometimes cheaper than other means, such as bus or car.
Rivalry inside the Industry is high: actually, we have many companies operating the
same route (for example London-New York is served by seven airlines) and cost advantages are easy to follow by other airlines, mainly if we take into account that they are Low Cost Carriers.
3.2 Ryanair
Ryanair is Europe’s largest airline, with more than 100 million passengers transported every year and more than 200 airports served throughout Europe, Morocco and Israel. They have more than 2,000 scheduled flights per day, which makes it the largest low-cost carrier and one of world’s largest airlines in the world in terms of daily movements and international passengers carried.
Ryanair provides many ancillary services related with air passenger, from non-flight scheduled services to in-flight sale of beverages or providing hotel and accommodation services via their website.
Graph 3 - Ryanair's airports by number destinations 2007-17 [share of destinations operating in 2017] (source: anna.aero)
Ryanair was founded in Swords (Ireland) in 1984 and has more than 90 bases all over Europe, having its head office at Dublin airport, the second largest hub of Ryanair. The biggest base for Ryanair is London Stansted Airport with more than 40 aircraft based there out of a total of 407 aircrafts (plus four more ordered and currently being produced at Boeing in Renton, USA).
In the top 15 of Ryanair’s airports, naturally leaded by London Stansted, we have a mix of leisure and business airports, also with a mix on the share of destinations currently operating. While Stansted, Dublin, Bergamo and Charleroi are being able to maintain the routes over the past 10 years, airports such as Girona, Hahn or Ciampino are losing relevancy because Ryanair is being capable of buying some slots on main airports as Barcelona, Frankfurt International and Rome Fiumicino, respectively.
0 50 100 150 200 London Stansted [73%] Dublin [69%] Milan Bergamo [65%] Brussels Charleroi [70%] Girona [35%] Frankfurt Hahn [44%] Weeze [45%] Alicante [61%] Madrid [57%] Pisa [53%] Rome Ciampino [53%] Liverpool [41%] Stockholm Skavsta [38%] Malaga [76%] Paris Beauvais [55%]
Graph 4 - Ryanair's stock price performance 2012-17 (source: Thomson Reuters)
Ryanair is growing on a sustainable way, we can see that by observing Ryanair’s price performance in recent years. Ryanair’s RPM (Revenue Passenger Miles) increased more than 10% in the last year to 81 million and scheduled passenger revenues rose almost 20% to €4,967 million in 2016 fiscal year. Average price per passenger dropped from €47.05 in 2015 to €46.67 in last year.
3.2.1 SWOT
Ryanair’s main strength is its low fare policy and all low cost practices. Along with EasyJet, they are the most powerful LCC in Europe and they have an agreement not to compete against each other in the same routes or similar customers. Ryanair also uses a single model aircraft (Boeing 737-800) and a lot of secondary airports, which allows them to have and practice an economy of scale. Apart from the reasons revealed above, we can also highlight best on-time performance, short turnaround strategy and the elimination of agents or third parties commission by using bookings just from the website. In terms of weaknesses, the biggest problem a LCC face is that customers don’t show any loyalty to the airline because they are very price sensitive. Ryanair also operates a lot of flights through secondary airports, which means a bigger distance to city center. Other problems Ryanair faces are: needing a high level of innovation to sustain these low
0 2 4 6 8 10 12 14 16 18
fares; being dependent of new taxes and regulations; being treated as an uncaring airline by media and having poor customer services.
Recently, many European flag carriers took processes of restructuration with a cut on several routes and markets. Ryanair is taking advantage of these opportunities on the market with low fares, frequency increases, new routes, bases and acquisitions (Aer Lingus as an example). US-European “Open Skies” agreement is also a change and a real possibility to enter in the American market with some connections to Europe.
Regarding threats, many of them are coming from other airlines: LCC compete against each others with ultra low fares, sometimes on the same routes; FSA are promoting discount fares with a decrease on the price but also on the service (no in-flight service, no checked bags, for example) and destinations are becoming busy due to a high amount of flights and different carriers serving the same airport / region. Changes in fuel price are a serious risk because it can result in hedging problems or problems in term of quantity. In spite of not having revenues in US dollars, many operating costs are incurred in USD, which means Ryanair have to face direct exchange rate risks. Brexit and the unknown consequences of the previous are also a problem because 28% of revenues (FY 2016) came from operations in the United Kingdom. Nowadays, problems with pilot holidays have cancelled a high number of Ryanair flights, which is harming Ryanair’s popularity and reliability.
4. Methodology
4.1 Forecasts
In order to get a correct analysis and consequent valuation of Ryanair, we need to give an accurate forecast in each component of Ryanair’s business. In each one, we will focus on the income statement, balance sheet and cash flow statement, explaining all the assumptions and computations made to get the best forecast possible.
4.1.1 Operating Revenues
According to last annual report, Ryanair has taken a diverse and exhaustive strategy with competitive prices in the last 10 years. This strategy, which includes some leases and contracts with Boeing, will last at least until 2024, which makes it logical to project the next seven years, taking into account 2025 as the steady state year.
In order to project future operating revenues, we took into account data from the last five years.
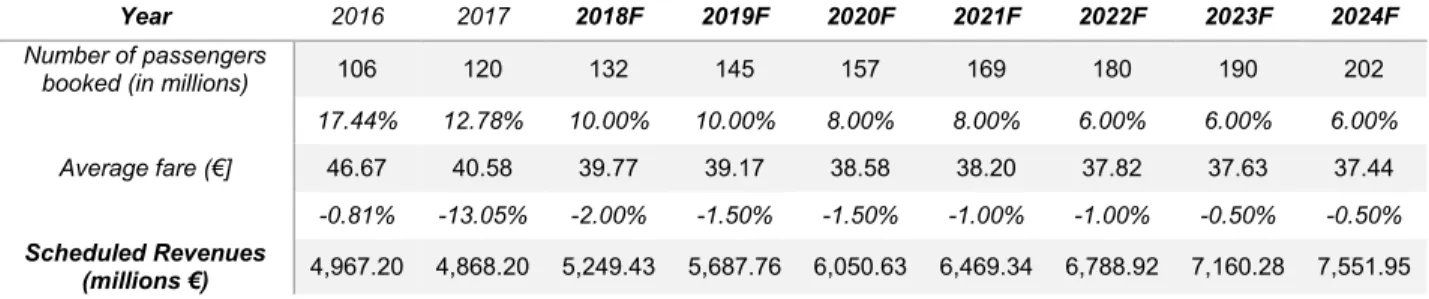
Table 2 - Forecast of Scheduled Revenues 2016-24 (source: own computations)
In terms of scheduled revenues (product of number of passengers for the average fare), we forecast an increase in next years, mainly because of a big rise in number of passengers. According to Ryanair’s CEO and Ryanair FY2017 Annual Report, the Irish company has the goal of increasing the volume of passengers to 200 million per year in 2024, which means an increase of 67% in the next seven years. However, in spite of being a really hard objective, we know it is possible, it will be probably achieved and it stays in line with the actual fleet expansion plan. The average fare suffered a big decrease
Year 2016 2017 2018F 2019F 2020F 2021F 2022F 2023F 2024F
Number of passengers
booked (in millions) 106 120 132 145 157 169 180 190 202
17.44% 12.78% 10.00% 10.00% 8.00% 8.00% 6.00% 6.00% 6.00% Average fare (€] 46.67 40.58 39.77 39.17 38.58 38.20 37.82 37.63 37.44
-0.81% -13.05% -2.00% -1.50% -1.50% -1.00% -1.00% -0.50% -0.50%
Scheduled Revenues
in the last fiscal year (-13%), mainly because of the introduction of government taxes on travel, for example Italy increased the tax by €2.50 and Norway introduced a new one of nearly €8.50 in the last year. As a consequence, Ryanair closed two bases in Italy and closed the Oslo base in October 2016. Despite “the ability of increasing fares being somehow limited”, in next years, we hope the decrease will not be so significant.
Other revenues consist on ancillary ones: non-flight scheduled, in-flight sales and internet-related. Ryanair is hoping to “enhance operating results through Ancillary Services”, which consisted on approximately on 27% of Ryanair’s operating revenues on the last fiscal year. Their idea is to increase this value in terms of reserved seating, car hire, priority boarding and on-board sales, by implementing many strategic initiatives to improve customer service offering (AGB customer experience program is a good example).
Year 2016 2017 2018F 2019F 2020F 2021F 2022F 2023F 2024F
Scheduled Revenues 4,967.20 4,868.20 5,249.43 5,687.76 6,050.63 6,469.34 6,788.92 7,160.28 7,551.95
Ancillary revenues 1,568.60 1,779.60 1,918.96 2,079.19 2,211.85 2,364.91 2,481.73 2,617.48 2,760.66
Operating Revenue 6,535.80 6,647.80 7,168.39 7,766.95 8,262.48 8,834.24 9,270.66 9,777.76 10,312.61
4.1.2 Operating Expenses
There are seven different sources of operating expenses and they are all expressed in the following graph. The graph is showing the weight of each one on total operating expenses, taking into account data from 2017 fiscal year. We can see clearly that fuel and oil is the most representative one with nearly 40% of the total.
Graph 5 - Weight of each expense on total operating expenses (source: 2017FY Ryanair Annual Report)
Staff costs mainly consist on salaries, wages and some benefits. They increased by 8% in the last fiscal year, however, if we perform a per passenger computation, these costs decreased by 4%. These changes are related to new routes and an increase on the number of aircrafts.
In absolute terms, Ryanair’s depreciation increased 16%; however, on a per passenger basis, it increased by 3%, which is clearly in line with 52 more aircraft when comparing with 2016 fiscal year. We forecast this category assuming an average of depreciation and amortizations from the last five years (2013-2017).
Fuel and oil costs per passenger decreased by 18%, while in absolute terms, they decreased just 8%. Ryanair has entered into contracts to protect itself from changes in fuel prices, generally by signing forward contracts covering up to 36 months of anticipated fuel need. For example, on 2017 July, Ryanair had already some arrangements to cover
12% 10% 37% 3% 2% 13% 17% 6% Staff costs Depreciation Fuel and oil
Maintenance, materials & repairs
Aircraft rentals Route charges
Airport and handling charges Marketing, distribution & other
more than 90% of the fuel required until 2018 March. Despite expected decreases on the oil price exposing Ryanair to hedging losses, we assume the value would be similar to the average from total revenues of the last five years. In other words, there will be a slightly increase over the next years, lower than 10% every year.
Maintenance, materials & repairs costs consist basically on the “cost of routine maintenance provision for leased aircraft and the overhaul of spare parts”. Most changes in these item are derived from the timing of these routine maintenance because they are always provided by Boeing in U. S. Dollars. In absolute terms, these expenses increased by 8%, however they decreased by 3% on a per passenger calculation.
Route charges are one of the categories with less changes over the years. The last fiscal year was not a good example because there were some price reductions on France, Germany and United Kingdom, which caused a decrease of 7% on route charges per passenger (absolute increase of 5%).
Airport and handling charges per passenger tend to be a regular item as well: they decreased by 8% in the last fiscal year, following an increase in traffic and some competitive airport deals, recently signed. On an absolute computation, these charges increased by 4%.
Ryanair’s marketing, distribution and other expenses include some costs also applicable to ancillary revenues and increased by 10% on the last fiscal year (despite being down 3% on a per-passenger basis). These costs included higher distribution costs due to higher on-board sales, disruption costs related to some strikes and passenger’s compensation costs.
On these last four categories, along with aircraft rentals, we assume there was no big deal affecting future results, so we compute our forecast taking into account the average from total revenues in the last five years.
Year 2016 2017 2018F 2019F 2020F 2021F 2022F 2023F 2024F + Operating Revenue 6,536 6,648 7,168 7,767 8,262 8,834 9,271 9,778 10,313
- Operating Expense 5,076 5,114 5,853 6,341 6,746 7,213 7,569 7,983 8,420 = Operating Profit 1,460 1,534 1,316 1,426 1,517 1,622 1,702 1,795 1,893
Year 2016 2017 2018F 2019F 2020F 2021F 2022F 2023F 2024F + Operating Revenue 61.43 55.40 54.31 53.49 52.69 52.16 51.64 51.38 51.13 - Operating Expense 47.70 42.62 44.34 43.67 43.02 42.59 42.16 41.95 41.74
= Operating Profit 13.72 12.78 9.97 9.82 9.67 9.58 9.48 9.43 9.38 Table 5 - Forecast of Operating Profit on a per passenger basis 2016-24 (source: own computations)
Despite an increasing on the operating profit in absolute terms, on a per passenger basis we see the margin will decrease on the next years until 2024. This is line with Michael O’Leary (Ryanair’s CEO) statement regarding an increase on the number of passengers booked through competitive fares: “having the goal of increasing Ryanair’s booked passenger volumes to approximately 200 million passengers per annum by March 31, 2024”.
4.1.3 Payout Policy
Year Capital Return Amount (in €M)
FY 2018 Buyback 600 FY 2017 Buyback 550 FY 2016/17 Buyback 886 FY 2016 Special Distribution 398 FY 2016 Buyback 400 FY 2015 Special Dividend 520 FY 2014 Buyback 482 FY 2013 Special Dividend 492 FY 2013 Buyback 67
Table 6 - Historical and Scheduled Ryanair's payout (source: 2017FY Ryanair Annual Report)
According to previous table, even if we exclude the special distribution from Aer Lingus’ sale, Ryanair has been increasing the amount distributed to shareholders and this is the main objective from the Board. For example, “On July 1, 2016, the Board confirmed that it will hold an EGM on July 27, 2016 to seek approval from shareholders to grant the Board of the Company the discretion to engage in further share buy-backs” (after this information, they decided to schedule the last two buybacks represented on the previous table).
The company has been successful and they believe it will continue in the same way in the next years. In our forecasts, we should expect a rise on the payout ratio to a value
between 50% and 73% (excluding the smallest and biggest values, these are the minimum and the maximum payout ratio on the range 2013-2018,); from 2019, the chosen value was 65% as it represents the average in the period 2016-2018.
4.1.4 CAPEX
Main component of Capital Expenditures is the acquisition of new airplanes (main investment); secondary investments include expenditures on hangar and buildings, plant and equipment, fixtures and fittings, motor vehicles and financial investments.
On the primary investments, we computed the difference between the current gross value of aircrafts and the value from previous fiscal year, taking in consideration the rate of depreciation. This rate of depreciation was calculated through an average of the last five years (2013-2017).
In terms of secondary investments, we assume a value always connected to the traffic growth. It is also important to highlight the null value in financial investments because the sale of Aer Lingus stake was on 2015.
4.1.5 Net Working Capital
Operating Net Working Capital is equal to the difference between current assets and current liabilities and it is a measure of short-term liquidity. Our forecast is related with Ryanair Annual Report, in other words, variations in working capital would come from changes in operations and revenues.
Ryanair’s fleet will increase from 383 to 585 aircrafts in the end of 2024 fiscal year, this means the value of expenses will also increase on a similar proportion and current liabilities become higher than current assets.
As derivative financial instruments play an important role on Ryanair’s business, we chose to keep a significant value of those in our forecasts (assuming “an operational side
4.1.6 Debt
Ryanair has a value of debt of €4.385 million on March 2017, end of 2017 fiscal year. They are divided into long term debt (€3.928 million) and finance lease obligations (€457 million), almost 60% of them with a maturity smaller than five years.
Regarding operating lease obligations, they are equal to €185 million, with a maximum maturity of five years. Ryanair has also issued €2.450 million in three unsecured Eurobonds with maturity dates between 2021 and 2023.
Finally, we calculated interest expenses based on a historical debt / assets ratio (37%) and on a cost of debt of 1.49% (“The weighted-average interest rate on the cumulative borrowings under these facilities of €4,384.5 million at March 31, 2017 was 1.49%”4).
4.1.7 Tax Rate
Ryanair pays taxes in Ireland, so it is affordable to say it will be according to the statutory Irish rate of 12.5%. Taking into account the fluctuations from last five years, we will assume the statutory rate as the effective tax rate.
4.2 Valuation
In this section, we conduct a Discounted Cash Flow valuation using the WACC method because we project a stable capital structure, as mentioned before. We evaluate Ryanair as 31 March of 2017 and the explicit period will go until 31 March of 2024.
A multiples valuation was also used in order to strength the valuation and to stress test DCF method. Besides this, relative valuation is also very important because it is used by many analysts and investment banks.
4.2.1 Discounted Cash Flow
4.2.1.1 Free Cash Flow to the Firm
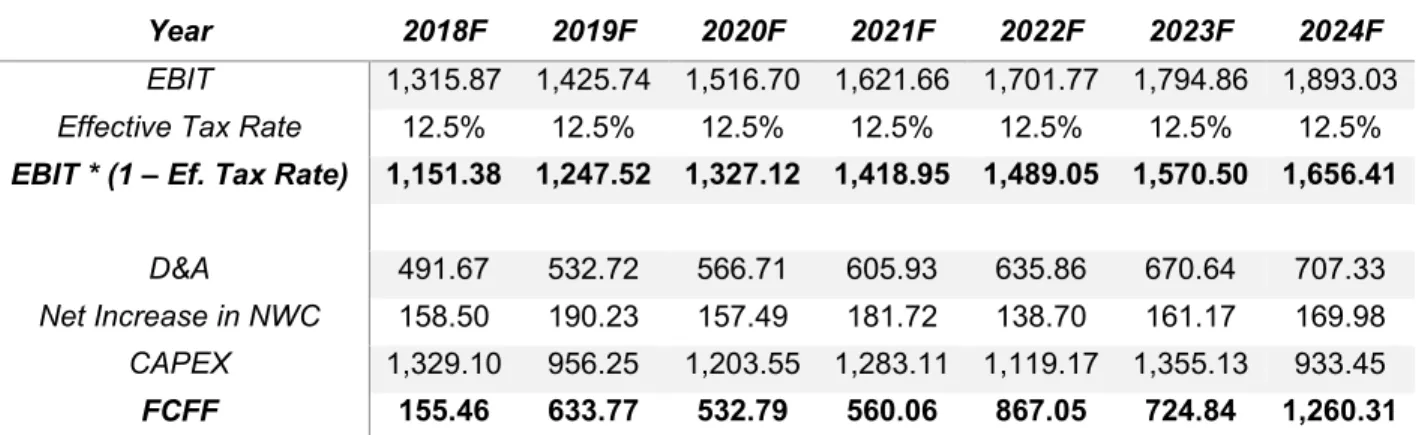
First step of the valuation involves the computation of future cash flows, using the Free Cash Flow to the Firm method. This method is shown on equation (13).
𝐹𝐶𝐹𝐹 = 𝐸𝐵𝐼𝑇 (1 − 𝑇) + 𝐷&𝐴 − ∆ 𝑁𝑊𝐶 − 𝐶𝐴𝑃𝐸𝑋 (13)
Excepting the first and the last year, cash flows were pretty stable. Both extremes are justified with Capital Expenditures (CAPEX): in the first year we are facing the delivery of fifty airplanes while on the last year Ryanair has no more deliveries under 2013 Boeing contract and is planning to return fifteen aircraft.
EBIT and Depreciations are presenting a growth higher than 20%, while Net Working Capital requirements are positive and quite regular.
Year 2018F 2019F 2020F 2021F 2022F 2023F 2024F
EBIT 1,315.87 1,425.74 1,516.70 1,621.66 1,701.77 1,794.86 1,893.03
Effective Tax Rate 12.5% 12.5% 12.5% 12.5% 12.5% 12.5% 12.5% EBIT * (1 – Ef. Tax Rate) 1,151.38 1,247.52 1,327.12 1,418.95 1,489.05 1,570.50 1,656.41
D&A 491.67 532.72 566.71 605.93 635.86 670.64 707.33
Net Increase in NWC 158.50 190.23 157.49 181.72 138.70 161.17 169.98
CAPEX 1,329.10 956.25 1,203.55 1,283.11 1,119.17 1,355.13 933.45
FCFF 155.46 633.77 532.79 560.06 867.05 724.84 1,260.31
Table 7 - FCFF computation 2018-24 (source: own computations)
4.2.1.2 Discount Rate
In order to discover the Weighted Average Cost of Capital (WACC), we need a set of variables regarding debt and equity.
The first step is the computation of the Cost of Equity (Ke). We assume a Risk Free Rate of 0.48%, equivalent to the long term Government Bond Yields 10Y for Germany (Euro Zone Risk Free Rate), a Levered Beta of 1.01 (retired from Thomson Reuters) and a Market Risk Premium of 6.48%. This value includes a specific Country Risk Premium
Damodaran’s website (January 2017). The final calculation of the Ke is shown on the following equation.
𝐾𝑒 = 0.48% + 1.01 ∗ 6.48% = 7.02% (14)
Secondly, we need to add the default spread of 2.25% (associated with Ryanair’s credit rating of BBB5) to the Risk Free Rate in order to get a Pre Tax Cost of Debt of 2.73%.
After using the Irish Tax Rate of 12.5%, we achieved a final value to the After Tax Cost
of Debt of 2.39%. The previous computation is shown on equation 15.
𝐴𝑓𝑡𝑒𝑟 𝑇𝑎𝑥 𝐾𝑑 = (0.48% + 2.25%) ∗ (1 − 12.5%) = 2.39% (15)
Now, for the Market Value of Equity and assuming values from 31 March of 2017, we got a final value of 18,158.14 million of euros. This was achieved due to a number of shares outstanding of 1,249.70 million and a share price of 14.53€.
𝐸𝑞𝑢𝑖𝑡𝑦 𝑀𝑉 = 1,249.70 ∗ 14.53 = 18,158.14 𝑀€ (16)
Finally, regarding the Market Value of Debt, it was obtained using three different methods. The first one is the computation of the Debt Value of Operating Leases, then the conversion of non-traded debt into marketable debt and the last one is simply adding the amount outstanding of Ryanair’s three different bonds.
The inclusion of Operating Leases has the objective of presenting a healthier and better outlook, when compared to interest expenses. We will follow Damodaran’s approach when dealing with this component: “To convert operating lease commitments into an equivalent debt amount requires that we discount these commitments back to the present”6.
Maturity Commitment Present Value
< 1 year 77.10 76.07
1 - 2 years 53.50 51.38
2 - 5 years 54.60 49.69
> 5 years 0.00 0.00
Debt Value of Operating Leases 177.14
5 Damodaran. Default Spreads
Table 8 - Computation of Debt Value of Operating Leases (source: own computations)
Regarding non-traded debt, we “treat the debt on the books as one coupon bond, with a coupon set equal to the interest expenses on all the debt and the maturity set equal to the face-value weighted average maturity of the debt, and then to value this coupon bond at the current cost of debt for the company”7. The following table shows how we compute
the total amount of non-traded debt.
Maturity Long Term Debt Finance Lease Obligations Commitment %
< 1 year 325.60 130.20 201.11 10.40%
1 - 2 years 299.70 129.30 189.28 9.78%
2 - 5 years 1,541.10 197.00 766.87 39.64%
> 5 years 1,761.60 0.00 777.24 40.18%
Average of 4.94 years Total Non-Traded Debt 1,934.50
Table 9 - Computation of Non-Traded Debt (source: own computations)
After achieving the total Non-Traded Debt (Book Value) of 1,934.50 million of euros, we converted it to Market Value using the following equation and got a final value of 1,995.91 million of euros. 𝑀𝑉 𝑜𝑓 𝑁𝑜𝑛 − 𝑇𝑟𝑎𝑑𝑒𝑑 𝐷𝑒𝑏𝑡 = 𝐼𝑛𝑡𝑒𝑟𝑒𝑠𝑡 𝐸𝑥𝑝𝑒𝑛𝑠𝑒𝑠 ∗(1− 1 (1+𝐾𝑑)𝐴𝑣𝑒𝑟𝑎𝑔𝑒 𝑌𝑒𝑎𝑟𝑠) 𝐾𝑑 + 𝑇𝑜𝑡𝑎𝑙 𝑁𝑜𝑛−𝑇𝑟𝑎𝑑𝑒𝑑 𝐷𝑒𝑏𝑡 (1+𝐾𝑑)𝐴𝑣𝑒𝑟𝑎𝑔𝑒 𝑌𝑒𝑎𝑟𝑠 (17) 𝑀𝑉 𝑜𝑓 𝑁𝑜𝑛 − 𝑇𝑟𝑎𝑑𝑒𝑑 𝐷𝑒𝑏𝑡 = 67.20 ∗(1− 1 (1+2.73%)4.94) 2.73% + 1,934.50 (1+2.73%)4.94= 1,995.91 𝑀€ (18)
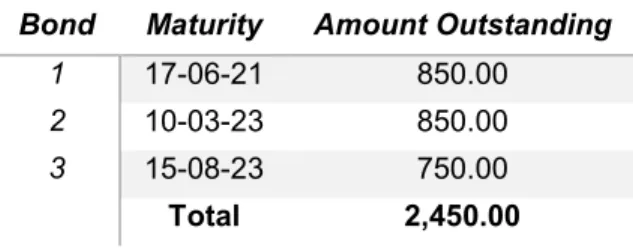
The last step includes adding the value of 2,450.00 million of euros, which corresponds to the total amount outstanding in three different bonds. This amount is represented on the next table.
Bond Maturity Amount Outstanding
1 17-06-21 850.00
2 10-03-23 850.00
3 15-08-23 750.00
Total 2,450.00
The sum of these three sources of debt led to a Total Debt Market Value of 4,623.05 million of euros.
After completing the last four steps, we calculated the weight of equity and debt on the company and we got the values of 79.71% and 20.29%, respectively. Using both weights and costs, we computed the Weighted Average Cost of Capital and achieved a final WACC of 6.08%. This calculation is shown on the following equation.
𝑊𝐴𝐶𝐶 = 79.71% ∗ 7.02% + 20.29% ∗ 2.39% = 6.13% (19)
4.2.1.3 Terminal Value
Regarding Terminal Value computation, a growth rate of 1.80% was considered, which is in line with International Monetary Fund calculations in 2017. Assuming also a constant WACC of 6.08% (as shown on point 4.2.1.2) and a perpetuity over the Free Cash Flow to the Firm after reaching the steady state in 2025, we achieved a terminal value of 21,012.40 million of euros.
It is important to highlight that “growth rate cannot be higher than overall economy growth rate projected for the geography”8 Ryanair is operating in, as no business is able to grow
quicker than the economy where it belongs.
Year 2018F 2019F 2020F 2021F 2022F 2023F 2024F FCFF 155.46 633.77 532.79 560.06 867.05 724.84 1,260.31 Discounted FCFF 155.46 597.42 473.43 469.12 684.61 539.50 884.25 Cumulative Discounted FCFF 155.46 752.88 1,226.31 1,695.43 2,380.04 2,919.54 3,803.80 Terminal Value 21,012.40 22,290.79 23,646.96 25,085.64 26,611.85 28,230.91 29,948.48
Table 11 - Terminal Value computation 2018-24 (source: own computations)
4.2.1.4 Estimated Price
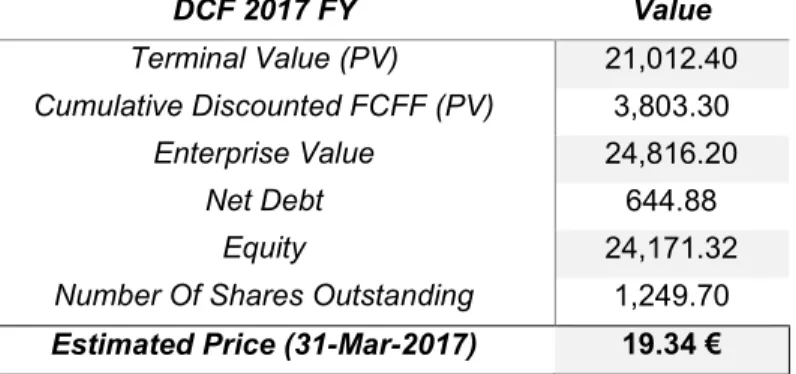
Using the terminal value and cumulative discounted FCFF, we were able to get the Enterprise Value of 24,816.20 million of euros. If we deduct the Net Debt, which is equal to the total debt minus current financial assets and cash, we achieved the estimated Equity Value of 24,171.32 million of euros. Finally, by dividing the Equity Value by the
number of shares outstanding, we got an Estimated Price of 19.34€, representing an upside of 33% when compared to the current price on 31 March of 2017 (14.53€).
DCF 2017 FY Value Terminal Value (PV) 21,012.40 Cumulative Discounted FCFF (PV) 3,803.30 Enterprise Value 24,816.20 Net Debt 644.88 Equity 24,171.32
Number Of Shares Outstanding 1,249.70 Estimated Price (31-Mar-2017) 19.34 €
Table 12 - DCF estimated price (source: own computations)
4.2.2 Multiples
Multiples valuation is widely used by companies and analysts, representing a way to stress test other types of valuation (DCF can be one of them). This chapter will be divided in two parts: explanation the chosen peer group and the results from this relative valuation.
4.2.2.1 Peer Group
Analyzing different variables from Thomson Reuters, such as market cap, revenues, regions, segment (product specifications) and growth stages, we were able to reach a short but concise peer group to perform the multiples valuation.
Regarding market cap, it was difficult to find a company which could be able to enter our peer group. Ryanair is the second biggest airline on the world by market cap with nearly 20 billion of euros, only after Southwest and Delta Air Lines (more than 29 billion of euros, each one). Next firms on the list include Air China, United Airlines, IAG Group (International Consolidated Airlines Group, including companies such as British Airways, Iberia or Aer Lingus), Deutsche Lufthansa, ANA (Japanese flag carrier), Japan Airlines, China Eastern and China Southern Airlines, companies with a market cap from 10 to 16 billion of euros but operating on different segments or markets.
In terms of regions, all European carriers with short haul flights over Europe and North Africa were able to enter in our peer group. In consequence, the natural choice was to include EasyJet and Norwegian Air Shuttle. EasyJet is a low cost airline operating flights in Europe and Morocco, with a similar amount of revenues when compared to Ryanair (5,947 vs 6,647 million of euros), while Norwegian, in spite of operating a few long-haul flights to North America, is a Scandinavian company focusing on low cost service in Europe, mainly from/to Scandinavia and UK. Wizz Air, a Hungarian low cost carrier, was discarded because they are much more recent than Ryanair and they have been focusing on Eastern Europe, which is not in line with Ryanair’s focus on Mediterranean and Southern Europe.
Regarding Ryanair’s market segment, our choice was to include Southwest Airlines in our peer group, as this is the biggest low-cost carrier in the world and they have been acting as an historical reference to all companies operating on the low-cost segment. Finally, we closed our peer group by adding Turkish Airlines, also an airlines with revenues close to 8 million of euros. Despite operating lots of long-haul flights from their hub at Istanbul, the Turkish flag carrier is considered to be the most similar to Ryanair in terms of growth stage.
4.2.2.2 Estimated Price
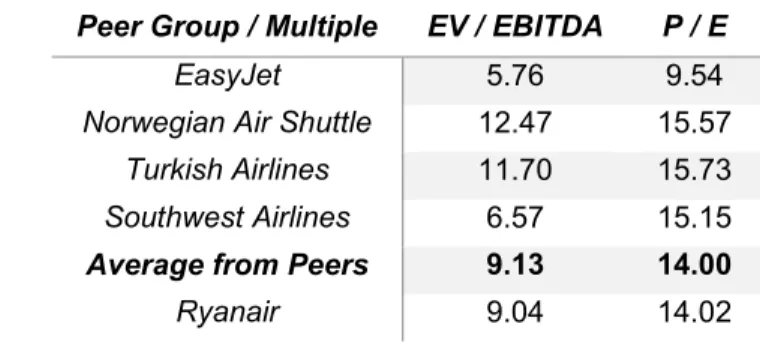
We started our computation by analyzing EV / EBITDA and P / E ratios in our peer group. Peer Group / Multiple EV / EBITDA P / E
EasyJet 5.76 9.54
Norwegian Air Shuttle 12.47 15.57
Turkish Airlines 11.70 15.73
Southwest Airlines 6.57 15.15
Average from Peers 9.13 14.00
Ryanair 9.04 14.02
Table 13 - Peer Group and Multiples (source: Thomson Reuters)
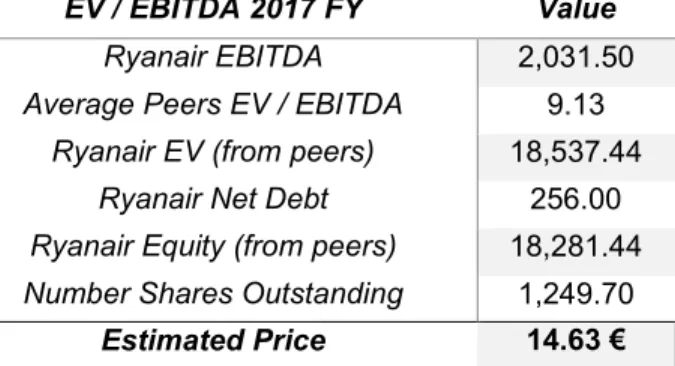
Regarding EV / EBITDA ratio, we achieved a final price of 14.63€, which is clearly in line with the current price of 14.53€ and also with last years, when this multiple has been
clearly regular. A quick remark is also needed in order to highlight that there may be some large disparities on EBITDA and Enterprise Value inside our peer group.
EV / EBITDA 2017 FY Value
Ryanair EBITDA 2,031.50
Average Peers EV / EBITDA 9.13
Ryanair EV (from peers) 18,537.44
Ryanair Net Debt 256.00
Ryanair Equity (from peers) 18,281.44
Number Shares Outstanding 1,249.70
Estimated Price 14.63 €
Table 14 - Estimated price from EV/EBITDA (source: own computations)
In terms of P / E ratio, we got a similar value of 14.74€, just 1.45% above current price. Because of Ryanair’s low earnings expectations (when compared to its peers), the estimated price is not as high as the one computed through a Discounted Cash Flow valuation. Despite the previous fact, we are observing a conversion between Ryanair and its peers in Price / Equity Ratio since 2015.
P / E Ratio 2017 FY Value
Ryanair EPS 1.05
Average Peers P / E 14.00 Estimated Price 14.74 €
Table 15 - Estimated price from P/E Ratio (source: own computations)
4.3 Sensitivity Analysis
A sensitivity analysis was performed to stress test past valuations and to expose some vulnerabilities of Ryanair. We will explore some effects on estimated price achieved through Discounted Cash Flow valuation, by changing some values both on financial (WACC and Growth Rate) and on operational segments (Fuel & Oil and Airport & Handling Charges).
Firstly, on the financial part, we focused on variables with high impact on the computation of the estimated price. We analyzed the impact of variations of 0.4% on the growth rate,
higher than the one from the respective economy), and 0.5% on the Weighted Average Cost of Capital, the main discount factor which includes lots of assumptions related with debt and equity. Analyzing the results from the following table, we can show that the estimated price should be between 13.28€ and 24.28€, representing 31% downside and a 26% upside potential when compared to the initial estimated price of 19.34€.
WACC 5.28% 5.68% 6.08% 6.48% 6.88% Growth Rate 0.60% 18.53 16.91 15.52 14.33 13.28 1.00% 20.09 18.19 16.60 15.24 14.07 1.40% 21.97 19.72 17.86 16.3 14.97 1.80% 24.28 21.56 19.34 17.54 16.00
Table 16 - Sensitivity analysis through WACC and Growth Rate (source: own computations)
On the operational segment, we focused on two variables representing part of the most important ones to Ryanair: Fuel and Oil represents the biggest slice of all costs, while Airport and Handling Charges tend to vary according to the number of passengers and routes Ryanair is operating. After assuming variations of 1%, the combination of both variables showed that we should expect a share price between 10.06€ and 28.61€, representing a 48% downside and upside potential when compared to the initial estimated price (19.34€).
Fuel & Oil
31.86% 32.86% 33.86% 34.86% 35.86% 36.86% 37.86% Airport & Handling Charges 9.62% 28.61 27.06 25.52 23.97 22.43 20.88 19.34 10.62% 27.06 25.52 23.97 22.43 20.88 19.34 17.79 11.62% 25.52 23.97 22.43 20.88 19.34 17.79 16.24 12.62% 23.97 22.43 20.88 19.34 17.79 16.24 14.70 13.62% 22.43 20.88 19.34 17.79 16.24 14.70 13.15 14.62% 20.88 19.34 17.79 16.24 14.70 13.15 11.60 15.62% 19.34 17.79 16.24 14.70 13.15 11.60 10.06
Table 17 - Sensitivity Analysis through Fuel&Oil and Airport&Handling Charges (source: own computations)
5. Equity Research Comparison
This section compares our valuation with the one performed by research analysts9 of
Credit Suisse on 9 October 2017. Their valuation is also based on a Discounted Cash Flow using the Weight Average Cost of Capital approach and on a relative valuation using three other airlines (EasyJet, IAG and Deutsche Lufthansa).
Firstly, we started by comparing both forecasts. While this dissertation estimates the income statement until Ryanair reaches a steady state in 2025, Credit Suisse focuses solely on the next three years.
Despite both of them showing an increase on most variables, the investment bank forecasts a higher growth on EBITDA, Operating Profit and Net Income, leading us to believe they are more optimistic than us. For example, as we can see on the previous table, they are forecasting in 2020 nearly the same values we expect to have in 2024 (EBITDA: 2,574 in 2020 versus 2,600 in 2024; Operating Profit: 1,902 in 2020 versus 1,893 in 2024; Net Income: 1,634 in 2020 versus 1,660 in 2024).
Table 18 - Forecast 2018-24 comparison between Dissertation and Credit Suisse (source: own computations and Credit Suisse Equity Research)
Year 2018F 2019F 2020F 2021F 2022F 2023F 2024F Operating Revenues Dissertation 7,168 7,767 8,262 8,834 9,271 9,778 10,313 Bank 6,952 7,377 7,965 -- -- -- -- Operating Expenses Dissertation 5,853 6,341 6,746 7,213 7,569 7,983 8,420 Bank 5,290 5,649 6,063 -- -- -- -- EBITDA Dissertation 1,808 1,958 2,083 2,228 2,338 2,465 2,600 Bank 2,226 2,352 2,574 -- -- -- -- Operating Profit Dissertation 1,316 1,426 1,517 1,622 1,702 1,795 1,893 Bank 1,662 1,728 1,902 -- -- -- -- Net Income Dissertation 1,154 1,251 1,330 1,422 1,492 1,574 1,660 Bank 1,423 1,480 1,634 -- -- -- --
Dissertation Bank
Method DCF (WACC) DCF (WACC)
Relative Weight 80% 50%
EBIT Margin 18% 25%
WACC 6.08% 8.50%
Terminal Growth Rate 1.80% 3.00%
Estimated Price 19.34 € 20.89 €
Method Multiples Multiples
Relative Weight 20% 50%
Estimated Price 14.68 € 18.27 €
Final Estimated Price 18.41 € 19.58 €
Table 19 - Valuation comparison between Dissertation and Credit Suisse (source: own computation and Credit Suisse Equity Research)
In the previous table, it is possible to compare both estimated prices: while on this dissertation we achieved a share price of 18.41€ (19.34€ on DCF and 14.68€ on multiples), Credit Suisse analysts concluded the estimated share price should be 19.58€ (20.89€ on DCF and 18.27€ on multiples).
Despite discounting cash flows at a higher rate (WACC: 8.50% vs 6.08%), Credit Suisse has an optimistic idea regarding the future with an EBIT Margin of 25% (7p.p. higher than the one expected by this dissertation). If we take into account Credit Suisse’s Blue Sky Scenario with an EBIT Margin of 30% or the Grey Sky Scenario with an EBIT Margin of 14%, they achieved share prices of 27.61€ or 12.10€, respectively, which shows the impact of this variable on the final result.
Regarding terminal growth rate, it was our decision not to surpass the inflation rate for Ireland, calculated by International Monetary Fund and situated now on 1.80%. Credit Suisse opted to work with a 3% growth rate.
In terms of Multiples Valuation, it is easy to infer some differences on both computations. As there are big differences in terms of long and short-haul flights (load factor, revenue per seat, route charges, taxes and currencies), we decided to create a peer group focused specifically on low-cost carriers, with just one exception (Turkish Airlines). In opposite, Credit Suisse analysts worked with Deutsche Lufhansa, IAG Group and EasyJet, being EasyJet the only airline matching both peer groups. Deutsche Lufthansa is the German
flag carrier and IAG Group includes Spanish (Iberia), British (British Airways) and Irish (Aer Lingus) flag carriers; they have high
Apart from these assumptions, this dissertation also boosts the importance and relevancy of the Discounted Cash Flow method in order to increase its strength on the final estimated share price. While Credit Suisse has achieved the final price by simply computing the average between DCF and Multiples Valuation, we decided to give a relative weight of 80% to the DCF and the remaining 20% to the Relative Valuation.
6. Conclusion
When working with two approaches (DCF and Multiples) on an Equity Valuation, it is crucial to take the best insights from each one and know the best way to treat it. Lots of assumptions, forecasts, peers and multiples are created and calculated, so it is from extreme relevancy to keep them on the future and capture the true findings about the company we are working with.
The comparison with Credit Suisse valuation helped us to prove and show the differences between two valuations performed by different analysts. In spite of both approaches achieving different results (18.41€ from dissertation vs 19.58€ from Credit Suisse), both of them assume an optimistic future for Ryanair and present an “Overweight” recommendation in the next months.
However, Ryanair needs to be careful: as it is an airline, they know macro-economic cycles can heavily impact them in a negative way, as well as they are facing troubles in increasing average fares with such a larger network. Despite being hedged against fuel price risk in next years, they also need to be aware of “other cost-cutting challenges given a lowest-in-industry cost base”10.