Faro
2005
Orientador: Doutora Alice Newton
Co-orientador: Doutora Vera Ribeiro
Constituição do Júri:
Presidente: Reitor da Universidade do Algarve
Vogais: Doutor Joandomènec Ros i Aragonés
Doutora Maria Teresa Henriques de Faria Fernandes
Doutor João Pedro Salgueiro Gomes Ferreira
Doutora Alice Newton
Doutora Vera Ribeiro
S
OFIAV
ITÓRIAP
ENELAS
OTTO–M
AYORL
OUREIRO(Tese para obtenção do grau de doutor
no ramo de Química,
especialidade de Química do Ambiente)
Faculdade de Ciências e Tecnologia
P
RIMARY
P
RODUCTION
IN SYSTEMS SUBJECT TO
PRIMARY PRODUCTION
IN SYSTEMS SUBJECT TO
NATURAL AND ANTHROPOGENIC EUTROPHICATION
(Tese para a obtenção do grau de doutor no ramo de Química,
especialidade de Química do Ambiente)
SOFIA VITÓRIA PENELA SOTTO-MAYOR LOUREIRO
Orientador: Doutora Alice Newton
Co-orientador: Doutora Vera Linda Ribeiro Marques
Constituição do Júri:
Presidente: Reitor da Universidade do Algarve
Vogais: Doutor Joandomènec Ros i Aragonés
Doutora Maria Teresa Henriques de Faria Fernandes
Doutor João Pedro Salgueiro Gomes Ferreira
Doutora Alice Newton
Doutora Vera Linda Ribeiro Marques
FARO
2005
To my Mother, and all we’ve shared, and all we’ll share, Here, and Everywhere!
Este trabalho foi possível graças à valiosa colaboração de um grande número de pessoas. A todos elas desejo expressar os meus sinceros agradecimentos!
À Professora Alice Newton, a orientadora deste projecto, pela sua ajuda, disponibilidade e constante pensamento positivo. À Professora Vera Ribeiro pela sua co-orientação e colaboração. Agradeço também ao Dr John Icely toda a ajuda durante as amostragens, no desenvolvimento do projecto e durante a escrita da tese.
Ao Professor Joandomènec Ros (Universitat de Barcelona) e Dra Dolors Vaqué (Institut de Ciències del Mar, Barcelona) por me acolherem como estudante dentro do âmbito do Programa SÓCRATES/ERASMUS.
É de lembrar a preciosa ajuda técnica e grande amizade do Jean Michel-Novalet (Sagremarisco) e do Joaquim Llinás (Unitat de Tecnologia Marina, Barcelona). Obrigada por tudo!
A assistência do Dr Igor Khmelinskii durante as análises de clorofila, do Engenheiro Hélio Martins e da Pilar Puyana (Universidade do Algarve) durante a análise de nutrientes, foram imprescendíveis.
Ao Professor João Gomes Ferreira (Universidade Nova de Lisboa), Dra Marta Estrada (Institut de Ciències del Mar, Barcelona) pelos seus esclarecimentos científicos. À Professora Margarida Castro pelos esclarecimentos no âmbito da estatística e ao Professor Paulo Relvas pelos esclarecimentos de oceanografia física (Universidade do Algarve). À Dra Teresa Moita (IPIMAR) pela revisão crítica do estudo realizado em Sagres.
À equipa da Delegação dos Portos do Sul, Sagres, pela cedência de um espaço de trabalho durante parte do estudo desenvolvido em Sagres, e por toda a sua assistência. Ao Nuno Amado pela ajuda durante as amostragens de Sagres.
Ao NERC (Natural Environment Research Council) RSDAS (Remote Sensing Data Analysis Service) do PML (Plymouth Marine Laboratory) pela cedência das imagens satélite, e ao Dr Álvaro Peliz (Universidade de Aveiro) pela ajuda com os dados das imagens satélite. À Dra Glória Pereira e à Dra Rubina Rodrigues (University of Wales, Bangor) pela cedência dos dados de clorofila e produção primária relativos à amostragem de Junho de 2001 na Ria Formosa, assim como ao projecto OAERRE pelos dados de amónia de Junho 2001, e de fosfato de Dezembro de 2001 e Abril 2002, relativos às amostragens da Ria Formosa.
Tenho também a agradecer ao João Pedro Costa a possibilidade de usar a sua espetacular fotografia como capa desta dissertação!
Ao apoio concedido pelo Programa SÓCRATES/ERASMUS (contrato 29248 13 501/2001) no período de estudos efectuados na Universitat de Barcelona / Institut de Ciències del Mar. Esta investigação foi parcialmente financiada pelo contrato OAERRE da União Europeia EVK3-CT1999-00002, pelo projecto PRAXIS-MAR 1696-95 da Fundação para a Ciência e a Tecnologia, e pela bolsa de doutoramento Praxis XXI/BD/15840/98 da Fundação para a Ciência e a Tecnologia dentro do âmbito do III Quadro Comunitário de Apoio pelo FSE e o MCES.
D
ECLARAÇÃOParte dos estudos incluídos nesta dissertação foram publicados:
Loureiro, S., A. Newton and J.D. Icely. 2005. “Microplankton composition, production and upwelling dynamics in Sagres (SW Portugal) during the summer of 2001”, Scientia Marina, 69 (3): 323-341.
Loureiro, S., A. Newton and J. Icely. 2005. “Effects of nutrient enrichments on primary production in the Ria Formosa coastal lagoon (Southern Portugal)”, Hydrobiologia, 550: 29-45.
Loureiro, S., A. Newton and J. Icely. 2006. “Boundary conditions for the European Water Framework Directive in the Ria Formosa lagoon, Portugal (physico-chemical and phytoplankton quality elements)”, Estuarine Coastal and Shelf Science, 67 (3) 382-398.
A autora da dissertação declara que interveio na execução do trabalho experimental e suas análises, no tratamento e interpretação dos resultados, e na redacção dos manuscritos.
C
ONTENTSAGRADECIMENTOS [v]
DECLARAÇÃO [vii]
ABSTRACT [xv]
RESUMO [ xix]
LIST OF ACRONYMS AND ABBREVIATIONS [xxiii]
LIST OF FIGURES [xxv]
LIST OF TABLES [xxxi]
▐ 1. GENERAL INTRODUCTION [1]
1.1. PRIMARY PRODUCTION [1]
Primary Production in marine ecosystems [2] Limiting factors of primary production [3] Measuring Primary Production [7]
1.2. EUTROPHICATION [9]
An Example of Natural Eutrophication: The Upwelling Event [9]
Anthropogenic Eutrophication [11] 1.3. OBJECTIVES AND THESIS STRUCTURE [16] References [19]
▐ 2. NATURAL EUTROPHICATION: SAGRES [27]
2.1. MICROPLANKTON COMPOSITION, PRODUCTION AND UPWELLING DYNAMICS IN SAGRES (SW PORTUGAL) DURING THE SUMMER OF 2001 [29]
Summary [29] Resumen [30] Introduction [30]
Material & Methods [32]
Sampling [32]
Upwelling index [34]
Production and respiration rates [34]
Microplankton identification and carbon content [35]
Analysis of microplankton assemblage [35]
Results [35]
States of the upwelling season [36]
Wind and hydrographic conditions [36]
Time-series of depth profiles [41]
Physical, biological and chemical parameters [42]
Microplankton abundance, biomass and composition [44]
Statistical assemblage analysis [48]
Potentially HAB organisms [49]
Discussion [51]
Physical events and microplankton assemblage [51]
Potentially HAB organisms [54]
Production and respiration rates [55]
Conclusions [56]
Acknowledgements [57] References [58]
2.2. ENRICHMENT EXPERIMENTS AND PRIMARY PRODUCTION AT SAGRES (SW. PORTUGAL) [67]
Abstract [67] Introduction [67]
Material & Methods [68]
Sampling and Analysis [68]
Microplankton identification [69]
Net Production [69]
Enrichment Experiment [69]
Univariate indices [70]
Results [70]
Wind and hydrographic conditions [70]
Treatment effects [74] Discussion [77] Initial conditions [77] Methodological constrains [79] Enrichment response [79] Conclusions [81] Acknowledgements [81] References [81]
▐ 3. ANTHROPOGENIC EUTROPHICATION: RIA FORMOSA [87]
3.1. BOUNDARY CONDITIONS FOR THE EUROPEAN WATER FRAMEWORK DIRECTIVE IN THE RIA FORMOSA LAGOON, PORTUGAL (PHYSICO-
CHEMICAL AND PHYTOPLANKTON QUALITY ELEMENTS) [89]
Abstract [89] Introduction [90]
Study area [92]
Material & Methods [94]
Sampling [94]
Microplankton identification [95]
Statistical treatment [95]
Results [96]
Variations of measured parameters [96]
Absolute variations [96] Sampling variations [96]
Microplankton assemblage [100]
Microplankton abundance changes [100] Statistical community analysis [102]
Biotic and abiotic relations [104]
Univariate indices [107]
Discussion [107]
Abiotic and biotic variability [107]
Microplankton dynamics [111]
Modelling and application of monitoring indices [112]
Conclusions [114]
Acknowledgements [115] References [115]
3.2. EFFECTS OF NUTRIENT ENRICHMENT ON PRIMARY PRODUCTION IN THE RIA FORMOSA COASTAL LAGOON (SOUTHERN PORTUGAL) [123]
Abstract [123]
Introduction [124]
Material & Methods [126]
Study site [126]
Sampling and Analysis [127]
Microscopic Identification [127]
Net Production [127]
Enrichment Experiment [128]
Statistical Analysis [128]
Results [130]
Biotic and abiotic factors [130]
Response to enrichment: Production and Chl a [132]
Nutrient dynamics [133]
Microplankton composition changes [134]
Discussion [136]
Methodological Constraints [136]
Microplankton Productivity and Biomass limitation [138]
Comparison with other studies [141]
Conclusions [142]
Acknowledgements [142] References [143]
▐ 4. COMPARISON BETWEEN THE TWO SYSTEMS: SAGRES & RIA FORMOSA [151]
Natural samples [151] Enriched samples [157] Conclusions [158]
References [160] ▐ 5. GENERAL CONCLUSIONS [163]
References [169]
ANNEX A: MATERIAL & METHODS [175]
A.1. DETERMINATION OF DISSOLVED OXYGEN IN SEAWATER [175]
A.2. DETERMINATION OF NUTRIENTS IN SEAWATER [178]
Determination of Ammonium-Nitrogen Dissolved in Seawater [178]
Determination of Nitrite-Nitrogen Dissolved in Seawater [181]
Determination of Nitrate-Nitrogen Dissolved in Seawater [183]
Determination of Phosphate-Phosphorus Dissolved in Seawater [187]
Determination of Silicate-Silicon Dissolved in
Seawater [189]
A.3. MICROSCOPIC IDENTIFICATION [192] References [193]
ANNEX B: ADDITIONAL DATA [195]
B.1. RIA FORMOSA PRODUCTION AND RESPIRATION RATES [195]
B.2. RIA FORMOSA CARBON BIOMASS [195]
B.3. UNIVARIATE INDICES [196]
Sagres: summer 2001 [200]
Ria Formosa: Enrichment Experiments [200] B.4. POTENTIALLY HARMFUL ALGAL BLOOMS (HAB) [201]
Ria Formosa: Natural Samples [201] Ria Formosa: Enriched samples [203]
A
BSTRACTThe input of nutrients to the aquatic system can have both natural (e.g. upwelling events) and human (e.g. sewage discharges, run-off of inorganic fertilizers from agricultural land) origins. The level of anthropogenic (human) eutrophication has grown in the past century. Primary production rates have increased significantly as a response, which can lead to harmful effects when the balance between the production and decomposition of organic matter is affected. These include the depletion of oxygen as excessive organic matter decomposes and the migration or death of surrounding life forms. Other consequences of nutrient enrichment may include changes in the natural autotrophic community structure by altered nutrient ratios, reduced biological diversity, increase in harmful algal blooms, poisoning of organisms, concluding in deterioration of the ecological and chemical status of waters. A decrease in fisheries, aquaculture and recreational resources may follow. To control and reverse eutrophication it is important to understand the dynamics between nutrients and the algal assemblage, identifying which nutrient is primarily limiting algae biomass and production. Within the context of the European Union (EU) several policies aim to reduce eutrophication and ensure the protection and improvement of the European aquatic environment. These include the Urban Waste Water Treatment (UWWT) Directive (91/271/EEC), the Nitrate Directive (91/676/EEC) and the recent Water Framework Directive (WFD) (2000/60/EC).
The general objective of this thesis was to investigate the relation between nutrients (specifically nitrogen and phosphorus) and the activity and structure of the pelagic assemblage of microalgae in the two selected study areas, recently included as part of the intercalibration sites for the Common Implementation Strategy of the WFD. The underlying hypothesis is that the microphytoplankton assemblage is affected by nutrient concentrations and ratios. This was tested both by field and experimental work. In management terms, this study evaluates whether the microphytoplankton assemblage (and its selected supporting elements) are good tools for the identification and management of anthropogenic eutrophication within the context of the WFD. Are these elements sufficient to distinguish between Natural and Anthropogenic Eutrophication? Can we use these tools for management? The Sagres station (SW. Portugal), adjacent to the upwelling centre of Cabo S. Vicente and close to an oyster-culture was selected for the study of natural eutrophication, whereas
the Ria Formosa coastal lagoon (S. Portugal) was representative of a system subject to both natural and anthropogenic nutrient enrichment. The sampling in Sagres was performed during the upwelling season, from May to September (2001). The Ria Formosa was sampled according to the frequency recommended by the WFD (every 3 months) during representative conditions: close to the summer and winter solstice, and spring and autumn equinox, coinciding with both high (HW) and low water (LW), between June 2001 and July 2002. The water was collected from three contrasting stations on the western lagoon. Nitrogen and phosphorus enrichment experiments were conducted additionally over short-time scales on small volumes of water collected during a period of relaxation of upwelling conditions in Sagres (September 2002), and during the growing season (summer solstice of 2001 and 2002), as well as the autumn equinox (September 2001), in the Ria Formosa.
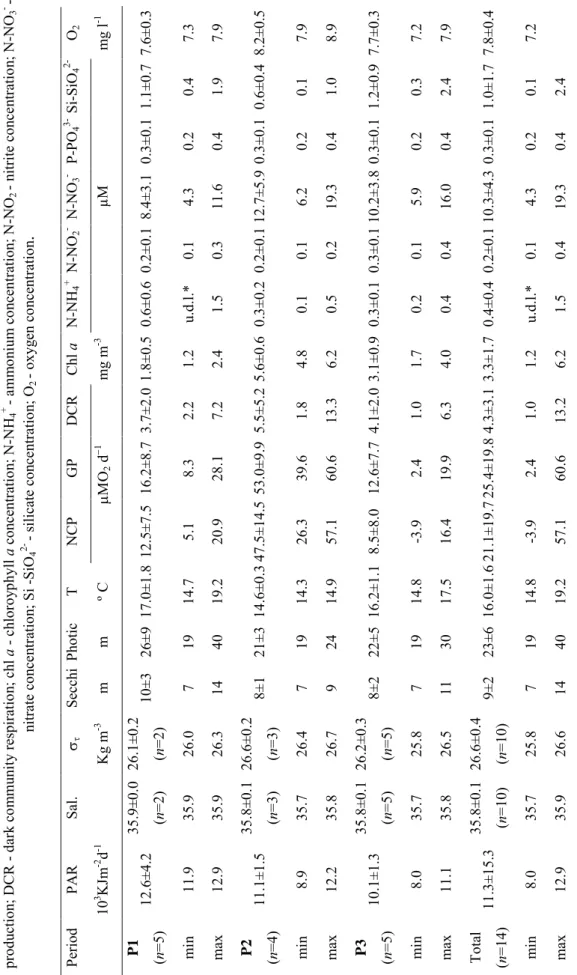
The results indicated that during the upwelling season the cold nutrient-rich waters of Sagres were dominated by the presence of diatoms. Flagellate forms developed by the end of the season when stratification occured, which was probably associated with the intrusion of the warm coastal countercurrent from the Gulf of Cádiz. Chaetoceros spp., Thalassiosira spp., Lauderia spp., Detonula spp., and Pseudo-nitzschia spp. were identified as a summer upwelling proxy. Production rates (seasonal average gross production: 25.4±19.8 µM O2 d-1)
were comparable to other productive systems. Respiration, on the contrary, was low during the survey. Nitrogen seemed to be the major nutrient regulating the microalgae activity, both during the upwelling season in the form of “new” nitrogen (essentially nitrate), and during relaxation stages in regenerated forms (essentially ammonium). Diatoms were the most sensitive group to nitrogen enrichment, including Pseudo-nitzschia spp. that may include toxic species. Altogether, the main factors influencing the development and structure of the algal community in Sagres were of physical nature, which in turn determined the chemical supply of nutrients to the photic zone.
The microplankton community peaked in the summer solstice samplings (June 2001 and July 2002) in the Ria Formosa lagoon, with diatoms as the greatest contributors to the total numbers, whereas flagellates generally dominated the carbon biomass. The statistical analysis clustered the microplankton samples into their seasonal sampling groups. Physical factors such as temperature, salinity and solar radiation, together with the availability of nitrogen (especially in reduced forms) appear to be important parameters contributing for the microplanktonic evolution. The oceanic assemblage differed from the internal lagoon community on certain occasions. Events such as coastal upwelling in the adjacent waters and land run-off episodes within the Ria can contribute to a greater differentiation between the
Ria-ocean systems, and thereby to the selection of distinct biological forms. The Ria had an important role as an exporter of both algal biomass and nutrients to adjacent waters during the sampling campaigns. The importance of coastal upwelling events as a contributor for the trophic level of the lagoon was also highlighted. Further work may clarify the relative degree of natural versus anthropogenic processes for the eutrophication of the lagoon. High concentrations of nutrients and algal biomass can accumulate in regions prone to restricted water renewal such as upstream channels. High numbers of microalgae can also occur adjacent to UWWT plants. Transport mechanisms ultimately regulate the final location of the accumulated material. Nitrogen is suggested to be the potential limiting nutrient of the pelagic microalgae community of the lagoon during the growing season according to enrichment experiments, with diatoms as the most sensitive group. In temperate ecosystems, a switch in limiting factors is expected due to the seasonal change of biological and environmental variables.
The systems appear to differ significantly during the growing season, both in biological and physico-chemical parameters, but these differences seem to be nevertheless not sufficient to distinguish between Natural and Anthropogenic Eutrophication. Similar responses to enrichment bioassays were also observed in both systems. Harmful Algal Blooms (HAB) taxa seem to develop mainly due to natural events (upwelling), suggesting that this parameter should be used with caution as an indicator of anthropogenic eutrophication in Portuguese coastal waters. Altogether, although the fact that the microphytoplankton assemblage responded to changing trophic conditions supports the need to incorporate these data in monitoring programmes, these tools seem not to be sufficient for the management of anthropogenic eutrophication in the selected areas.
The two scenarios were in the ranges of mesotrophic conditions during the samplings, which is likely a consequence of the mechanisms of mixing and transport present in both areas. The high potential of dilution from the Atlantic Portuguese coastal waters contributes to its low degree of eutrophication problems. This works contributes to the on-going process of implementation of the WFD, and to the database of knowledge of the productive systems of Sagres and Ria Formosa.
R
ESUMOA introdução de nutrientes no sistema aquático pode ter origem natural (exº eventos de afloramento) e humana (exº descargas de esgotos, escorrimento de fertilizantes inorgânicos de terrenos agrícolas). O nível de eutrofização antropogênica (humana) cresceu no século passado. Como resposta verificou-se um aumento significativo da taxa de produção primária, o qual pode induzir efeitos nocivos sempre que o equilíbrio entre a produção e a decomposição da matéria orgânica for afectado. Estes efeitos incluem o esgotamento de oxigénio devido à decomposição da matéria orgânica excessiva, e a migração ou morte das formas de vida circundantes. Outras consequências do enriquecimento de nutrientes podem incluir mudanças na estrutura natural da comunidade autotrófica devido à alteração da proporção de nutrientes, redução da diversidade biológica, aumento do crescimento de algas nocivas, envenenamento de organismos, concluindo na deterioração do valor ecológico e químico da água. Pode suceder-se uma diminuição nos recursos de pescas, de aquacultura e recreativos. Para controlar e reverter a eutrofização torna-se importante compreender a dinâmica entre os nutrientes e a comunidade de algas, identificando qual o nutriente que limita primariamente a sua produção e biomassa. No contexto da União Europeia vários planos de acção visam reduzir a eutrofização e garantir a protecção e melhoria do ambiente aquático Europeu. Estas medidas incluem a Directiva 91/271/CEE, relativa ao Tratamento de Águas Residuais Urbanas, a Directiva Nitratos (91/676/EEC) e a Directiva-quadro da Água (DQA) (2000/60/EC).
O objectivo geral desta tese foi o de investigar a relação entre nutrientes (especificamente azoto e fósforo) e a actividade e estrutura da comunidade pelágica de microalgas nas áreas de estudo seleccionadas, recentemente incluídas na lista de áreas de intercalibração para a estratégia de implementação comum da DQA. A hipótese subjacente é que a comunidade de microfitoplâncton é afectada pelas concentrações e proporções de nutrientes, o que foi testado por trabalho de campo e experimental. Em termos de gestão, este estudo avalia se a comunidade microfitoplanctónica (e os parâmteros de suporte seleccionados) são bons instrumentos para a identificação e administração da eutrofização antropogénica no contexto da DQA. Serão estes elementos suficientes para distinguir entre Eutrofização Natural e Antropogénica? Podemos usar estes elementos para a gestão da eutrofização?
A estação de Sagres (SO. Portugal), junto ao centro de afloramento do Cabo. S. Vicente e perto de uma cultura de ostras, foi seleccionada para o estudo da eutrofização natural, enquanto que a lagoa costeira da Ria Formosa (S. Portugal) foi representativa de um sistema
sujeito ao enriquecimento natural e antropogênico de nutrientes. A amostragem em Sagres foi efectuada durante a época de afloramento, de Maio a Setembro (2001). A Ria Formosa foi amostrada de acordo com a frequência recomendada pela DQA (3 em 3 meses): perto do solstício de verão e de inverno, e o equinócio de primavera e outono, coincidindo com maré alta e baixa, entre Junho 2001 e Julho 2002. A água foi recolhida de três estações na parte oeste da lagoa. Adicionalmente foram feitas experiências de enriquecimento de azoto e fósforo de pequena-escala e curta-duração, em água recolhida num período de relaxamento de condições de afloramento em Sagres (Setembro 2002), e durante a época de crescimento (solstício de verão 2001 e 2002), assim como no equinócio de outono (Setembro 2001), na Ria Formosa.
Os resultados indicaram que durante a época de afloramento as águas de Sagres, frias e ricas em nutrientes, foram dominadas pela presença de diatomáceas. O desenvolvimento de formas flageladas aquando da ocorrência de estratificação esteve provavelmente associada à intrusão da corrente contra-costeira quente vinda do Golfo de Cádiz. A análise estatística de comunidades identificou uma comunidade indicadora do afloramento de verão constituida por Chaetoceros spp., Thalassiosira spp., Lauderia spp., Detonula spp., e Pseudo-nitzschia spp.. As taxas de produção (produção primária bruta média: 25.4±19.8 µM O2 d-1) foram
comparáveis com a de outros sistemas produtivos. Pelo contrário, a respiração foi baixa durante o período de estudo. Como esperado para ambientes marinhos, o azoto parece ser o nutriente regulador da actividade microplanctónica, quer durante a época de afloramento sob a forma de azoto “novo” (essencialmente nitrato), quer durante estágios de relaxamento sob formas regeneradas (essencialmente amónia). As diatomáceas foram o grupo mais sensível ao enriquecimento por azoto, incluindo a Pseudo-nitzschia spp. que pode abranger espécies tóxicas. Ao todo, os principais factores que influenciaram o desenvolvimento e estrutura da comunidade pelágica de microalgas em Sagres foram de natureza física, que por sua vez determinaram o fornecimento químico de nutrientes à zona eufótica.
Na Ria Formosa, a comunidade microplanctónica atingiu o seu máximo nas amostragens dos solstícios de verão (Junho 2001 e Julho 2002) sendo as diatomáceas dominantes em termos de números totais, enquanto que os flagelados dominaram duma maneira geral a biomassa carbónica. A análise estatística de comunidades agrupou as amostras sazonalmente. Factores físicos como a temperatura, a salinidade e a radiação solar, juntamente com a disponibilidade de azoto (especialmente em formas reduzidas) parecem ser importantes parâmetros para a evolução do microplâncton. A comunidade oceânica diferiu da da lagoa em certas ocasiões. Eventos como o afloramento costeiro nas águas adjacentes e episódios de xx
escorrimento das terras na Ria, podem contribuir para uma maior diferenciação entre o sistema Ria-oceano, e consequentemente para a selecção de distintas formas biológicas. Durante as campanhas de amostragem foi evidenciado o papel da Ria como exportador de algas e nutrientes para as águas adjacentes. A importância dos eventos de afloramento costeiro para a contribuição do nível trófico da lagoa foi também realçada. O grau relativo dos processos naturais versus antropogénicos que contribuem para a eutrofização da lagoa pode ser clarificado por trabalhos futuros. Em regiões com tendência para uma renovação restrita de água podem acumular-se altos níveis de nutrientes e de algas. Elevados números de microalgas podem também ocorrer em áreas perto de ETARs (Estações de Tratamento de Águas Residuais). Os mecanismos de transporte podem em última instância regular a localização final do material acumulado. Os resultados das experiências de enriquecimento sugeriram o azoto como nutriente potencialmente limitante da comunidade pelágica de microalgas da lagoa durante a estação de crescimento, sendo as diatomáceas o grupo mais sensível a este enriquecimento. Em ecossistemas temperados espera-se uma mudança temporal de factores limitantes devido à variação sazonal dos parâmetros biológicos e ambientais.
Os sistemas estudados parecem diferir significativamente durante a estação de crescimento em parâmetros biológicos e físico-químicos mas, estes parecem no entanto insuficientes para distinguir entre Eutrofização Natural e Antropogénica. Resultados similares foram também observados aquando das experiências de enriquecimento. Os “blooms” tóxicos de microalgas parecem desenvolver-se principalmente devido a causas naturais (afloramento), sugerindo que este parâmetro deveria ser usado com cautela como indicador de eutrofização antropogênica. No todo, se bem que o facto da comunidade de microalgas responder às mudanças de condições tróficas apoia a necessidade de incluir este dado em programas de monitorização, esta parece não ser suficiente para a administração de eutrofização antropogénica nas áreas seleccionadas.
Durante as amostragens os dois cenários enquadraram-se na escala de condições mesotróficas, provavelmente em consequência dos mecanismos de mistura e transporte presentes em ambas áreas. O alto potencial de diluição das águas Atlânticas costeiras Portuguesas contribui para o seu baixo grau de problemas de eutrofização. Este trabalho contribui para o processo de implementação da DQA e, para a base de dados dos produtivos sistemas de Sagres e da Ria Formosa.
L
IST OF ACRONYMS AND ABBREVIATIONS ANOSIM = Analysis of SimilaritiesANOVA = Analysis of Variance ASP =Amnesic Shellfish Poisoning ATP = Adenosine Triphosphate AVHRR = Advanced Very High
Resolution Radiometer
CCC = Coastal Countercurrent Chl a = Chloropyhll a
CUI = Coastal Upwelling Index DCR = Dark Community Respiration DIN = Dissolved Inorganic Nitrogen DSP = Diarrhetic Shellfish Poisoning DPSIR = Driving Force - Pressure - State -
Impact - Response
EEA = European Environmental Agency EC = European Commission
EU = European Union GP = Gross Production HAB = Harmful Algal Bloom HELCOM = Helsinki Commission
Convention, Convention on the Protection of the Marine Environment of the Baltic Sea Area
HW = High Water
IM = Instituto de Meteorologia
IPIMAR = Instituto de Investigação das
Pescas e do Mar
LW = Low Water
MDS = Multi-Dimensional Scaling NADP = Nicotinamide Adenine
Di-nucleotide Phosphate
NCP = Net Community Production NEEA = U.S. National Estuarine
Eutrophication Assessment
NOAA = U.S. National Oceanic and
Atmospheric Administration
OSPAR = Oslo and Paris Convention, The
Convention for the Protection of the Marine Environment of the North-East Atlantic
PAR = Photosynthetically Available
Radiation
PLN = Proximate Limiting Nutrient PSP = Paralytic Shellfish Poisoning SIMPER = Similarity Percentages SST = Sea Surface Temperature U.S. = United States of America
UWWT = Urban Waste Water Treatment WFD = Water Framework Directive
L
IST OFF
IGURES▐ 1. GENERAL INTRODUCTION
1. Photosynthesis as a function of irradiance [4]
2. Relationship between the compensation and critical depth, and the depth of mixing [5]
3. Representation of Ekman transport along a coast leading to upwelling of cold water [10]
4. Map of major upwelling regions of the world [11] 5. Effects of eutrophication [14]
6. Oxygen depletion zones related to cultural eutrophication [14] 7. DPSIR (Driving Force - Pressure - State - Impact - Response) environmental reporting [15]
▐ 2.1. MICROPLANKTON COMPOSITION, PRODUCTION AND UPWELLING DYNAMICS IN SAGRES (SW PORTUGAL) DURING THE SUMMER OF 2001
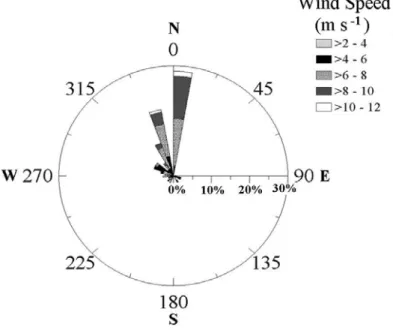
1. Location of the Sagres sampling station [33] 2. Chart of wind direction and speed distribution [36]
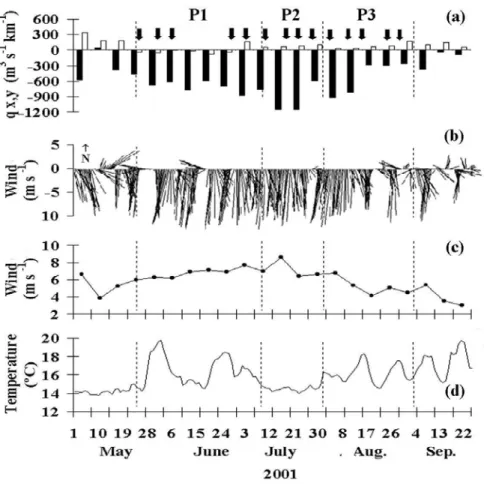
3. Temporal evolution of Ekman transport, wind vectors, wind speed, and sea surface temperature [38]
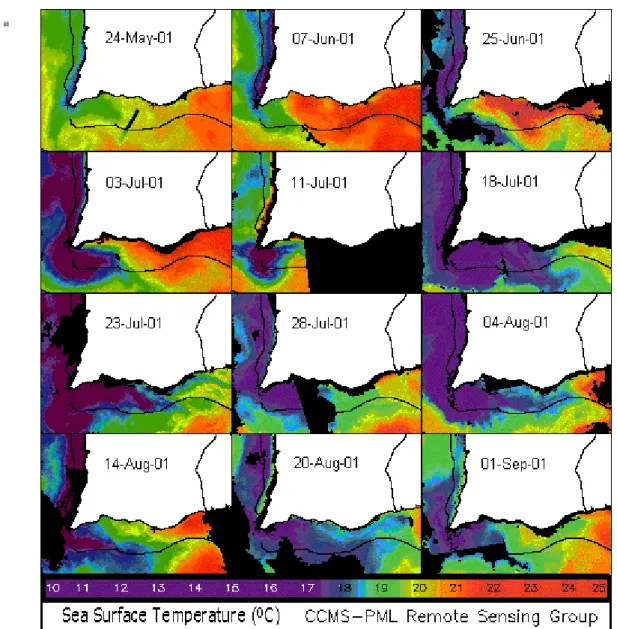
4. Sea Surface Temperature (SST) satellite images [39]
5. Vertical profiles of oxygen concentrations and temperature [41] 6. Vertical profiles of salinity (grey line), and density [42]
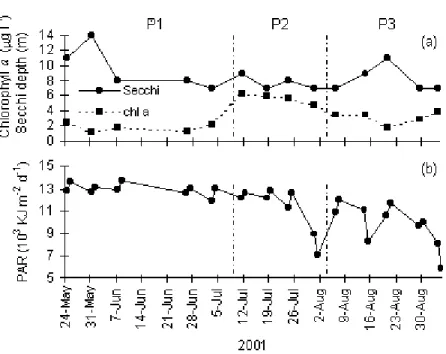
7. Temporal distribution of surface chlorophyll a concentration, Secchi depth and PAR [43]
8. Temporal distribution of surface net community production, gross oxygen production and dark community respiration [44]
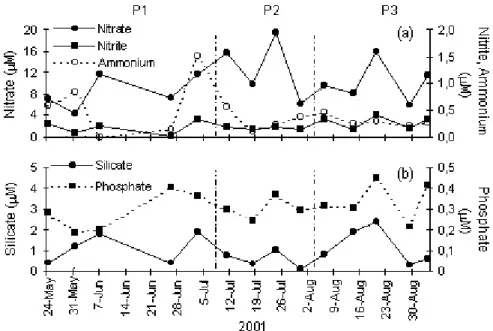
9. Temporal surface distribution of nitrate, ammonium, nitrite, phosphate, and silicate concentration [45]
11. Relative abundance and biomass of the microplankton groups [47] 12. Two dimension Multi-Dimensional Scaling ordination of Bray-Curtis similarities, from square root transformed abundance and biomass [48]
13. Temporal distribution of abundance and biomass of the main taxa contributing to Bray-Curtis dissimilarities [51]
14. Phase plot of gross production versus respiration [55]
▐ 2.2. ENRICHMENT EXPERIMENTS AND PRIMARY PRODUCTION AT SAGRES (SW. PORTUGAL)
1. Temporal evolution of Ekman transport, wind speed, and sea surface temperature [71]
2. Sea Surface Temperature (SST) satellite images [71] 3 Vertical profiles of temperature and salinity [72]
4. Chlorophyll a and net community production vertical data [72] 5. Vertical data of dissolved oxygen concentration and saturation [72] 6. Vertical nutrient profiles [73]
7. Depth-distribution of microplankton abundance [73]
8. Net community production and chlorophyll a depth-integrated values, along with relative contributions [75]
9. Depth-average of initial and final (24 H) nutrients concentration [76 ] 10. Depth-integrated values of microplankton groups [76]
11. Relative composition of microplankton assemblage at initial (time zero), control, and enriched samples [77]
12. Univariate indices of initial, control, and enriched samples [78]
▐ 3.1. BOUNDARY CONDITIONS FOR THE EUROPEAN WATER FRAMEWORK DIRECTIVE IN THE RIA FORMOSA LAGOON, PORTUGAL (PHYSICO-CHEMICAL AND PHYTOPLANKTON
QUALITY ELEMENTS)
1. Sampling stations in the Ria Formosa coastal lagoon [93] 2. Temperature and salinity values [98]
3. Chlorophyll a, ammonium, nitrate, nitrite, phosphate and silicate concentrations [99]
4. Oxygen concentration and saturation [100]
5. Abundance and relative numbers of the microplanktonic groups [102] 6. Cluster dendrogram of the Bray-Curtis similarity matrix of the square root transformed abundances [103]
7. Evolution of the main taxa contributing to the Bray-Curtis dissimilarities between the seasonal groups [104]
8. Two dimension MDS: bubble plots [105]
9. Mean and 95% confidence intervals based on pooled standard deviations of univariate indices of the microplankton community [108]
10. Sea Surface Temperature (SST) satellite images [109]
▐ 3.2. EFFECTS OF NUTRIENT ENRICHMENT ON PRIMARY PRODUCTION IN THE RIA FORMOSA COASTAL LAGOON (SOUTHERN PORTUGAL)
1. Ria Formosa lagoon and sampling stations [125] 2. Microplankton abundance [131]
3. Multi-Dimensional Scaling of the microplankton analysis from the Bray-Curtis similarity matrix of the square root transformed abundance data [132]
4. Net Community Production and biomass (as chlorophyll a) response to enrichment [133]
5. Box-plot distribution from N-stimulated NCP [134]
6. Box-plot distribution from N-stimulated biomass (as chl a) [134] 7. Evolution of inorganic nutrient concentrations during June 2001 [135] 8. Evolution of inorganic nutrient concentrations: September 2001 [136] 9. Evolution of inorganic nutrient concentrations: July 2002 [137] 10. Microplankton composition from September 2001 and July 2002 experiments, expressed as abundance and percentage [138]
▐ 4. COMPARISON BETWEEN THE TWO SYSTEMS: SAGRES & RIA FORMOSA
1. Cluster analysis of the Bray-Curtis similarity matrix of the square root transformed abundances from Sagres and Ria Formosa samples [154]
2. Cluster analysis of the Bray-Curtis similarity matrix of the square root transformed biomass from Sagres and Ria Formosa samples [154]
3. Multi-Dimensional Scaling ordination of Bray-Curtis similarities from square root transformed abundances (bubble plots) [158]
▐ ANNEX B: ADDITIONAL DATA
B.1. Net community production, gross production and dark community respiration during June 2001, September 2001 and July 2002, at the three stations of the Ria Formosa lagoon [195]
B.2. Biomass and relative biomass of the microplanktonic groups at the three stations of the Ria Formosa lagoon [196]
B.3 Cluster dendrogram of the Bray-Curtis similarity matrix of the square root transformed biomass from the three stations at the Ria Formosa lagoon [197]
B.4. Biomass evolution of the main taxa contributing to the Bray-Curtis dissimilarities between the Ria Formosa seasonal groups [199]
B.5. Mean and 95% confidence intervals, based on pooled standard deviations, of ecological indices from the Sagres survey (May to September 2001) [200]
B.6. Abundance k-dominance curves of the different periods from the Sagres survey (May to September 2001) [201]
L
IST OFT
ABLES▐ 1. GENERAL INTRODUCTION
1. Classification of phytoplankton according to size [3] 2. Global primary production in the marine environment [10]
▐ 2.1. MICROPLANKTON COMPOSITION, PRODUCTION AND UPWELLING DYNAMICS IN SAGRES (SW PORTUGAL) DURING THE SUMMER OF 2001
1. Surface values of physical, biological, and chemical parameters [37] 2. Spearman rank-order correlation between biological, chemical and physical parameters [40]
3. List of identified microplankton taxa, its codes, and frequency of occurrence during the survey [46]
4. One-way ANOSIM test for microplankton assemblage differences (in square root transformed abundance and biomass data) between the three a priori groups [49]
5. Taxa contribution (%) to the average abundance and biomass Bray-Curtis dissimilarity, between the three defined sampling period [50]
6. Abundance of potentially HAB organisms [52]
▐ 2.2. ENRICHMENT EXPERIMENTS AND PRIMARY PRODUCTION AT SAGRES (SW. PORTUGAL)
1. Abundance of potentially HAB organisms [74]
▐ 3.1. BOUNDARY CONDITIONS FOR THE EUROPEAN WATER FRAMEWORK DIRECTIVE IN THE RIA FORMOSA LAGOON, PORTUGAL (PHYSICO-CHEMICAL AND PHYTOPLANKTON
QUALITY ELEMENTS)
1. Mean, minimum and maximum values of the parameters measured at the Ria Formosa lagoon during the studied period [97]
2. List of the microplankton taxa found in Ria Formosa, its codes, and frequency of occurrence [101]
3. Results from the one-way ANOSIM test of microplankton assemblage differences (Bray-Curtis similarity matrices of square-root transformed abundances) between the a priori seasonal groups [103]
4. Pairwise Spearman correlations between biological, chemical and physical parameters [106]
5. Boundary conditions for Ramalhete and Ponte stations (historical data and present study data) [106]
▐ 3.2. EFFECTS OF NUTRIENT ENRICHMENT ON PRIMARY PRODUCTION IN THE RIA FORMOSA COASTAL LAGOON (SOUTHERN PORTUGAL)
1. Nutrient concentrations added to natural seawater for the enrichment experiments [128]
2. Initial N to P ratios in control and enriched samples [129] 3. Initial seawater conditions [130]
4. Results of bioassays with natural samples of seawater from a range of coastal areas [140]
▐ 4. COMPARISON BETWEEN THE TWO SYSTEMS: SAGRES & RIA FORMOSA
1. Mean, minimum and maximum values of the measured parameters at Sagres and Ria Formosa;results of Mann-Whitney U test to evaluate the statistical differences of variables between the two groups [153]
2. Mean abundance and biomass of the most frequent taxa (> 50%) in Sagres and Ria Formosa [155]
3. Results of SIMPER analysis giving the contribution (%) from each taxa to the average similarity within each group, and the average dissimilarity between groups (Sagres and Ria Formosa) [156]
B.1. One-way ANOSIM test on the Bray-Curtis similarity matrices of the square-root transformed biomass of the a priori seasonal groups [198]
B.2 Pairwise Spearman correlations between biological, chemical and physical parameters and microplankton biomass data [199]
B.3. Uni-variate indices of control (24 hours) and N production stimulated samples at the Ria Formosa [202]
B.4. Abundance of potentially HAB organisms observed at the Ria Formosa lagoon [203]
B.5. Potentially HAB organisms found at initial (time zero), control and N stimulated samples, during September 2001 and July 2002 experiments at the Ria Formosa lagoon [204]
▐ 1. G
ENERALI
NTRODUCTIONAll flesh is grass. Prophet Isaiah
1.1. PRIMARY PRODUCTION
The autotrophs (Gr. autos: self; trophe: nutrition/food) are organisms capable of synthesizing high-energy organic compounds from low-energy inorganic precursors. They compose the first level of the food chains and are, as such, also called primary producers. The first trophic level includes photo-autotrophs (Gr. photos: light), which use light as energy source, and chemo-autotrophs, which use the chemical energy derived from the oxidation of inorganic compounds (such as ammonium, methane, and sulphur) as the energy source. This chemosynthesis made by bacteria corresponds, in general terms, to a minor fraction of the whole primary production. Primary producers will refer to photoautotrophs in this work, unless specified otherwise. The heterotrophs (Gr. heteros: different) are organisms that use organic compounds for their nutrition. Additionally, there are mixotrophs, which are autotrophic life forms capable of taking organic substances for supplementary nutrition (Raymont, 1980; Falkowski & Raven, 1997).
Photosynthesis is the process by which the photo-autotrophs use radiant energy to produce organic matter. This synthesis involves the reduction of carbon dioxide (Raymont, 1980). It takes place in small organelles called chloroplasts, that contain pigments capable of absorbing light in the visible band (400 to 700 nm range). This photosynthetic band, or photosynthetically available radiation (PAR), corresponds roughly to 40-45% of the total solar radiation at sea level (Kirk, 1994). Photosynthetic pigments includes chlorophylls, carotenoids and biliproteins. All plants contain chlorophyll a (chl a), which is the dominant pigment present in photosynthetic plants, and carotenoids. Red algae, blue-green algae (cyanobacteria) and cryptophytes also contain biliproteins (Kirk, 1994). The production of new plant material (from photosynthesis) over time is termed primary production.
The photosynthetic process is composed by light and dark reactions. The light reactions can be summarised by the equation:
light
2 H2O + 2 NADP+ O2 + 2 H+ + 2 NADPH (1)
3 ADP + 3 Pi → 3 ATP
that describes the electron transport from water to NADP (Nicotinamide Adenine Di-nucleotide Phosphate), associated to ATP (Adenosine Triphosphate) synthesis and oxygen liberation, by means of light energy.
Regarding the dark reactions, the carbon dioxide is fixed by means of a cycle of reactions named the Calvin (or Calvin-Benson) cycle. The energy of ATP and the reducing power of NADPH, which were produced in the light reactions, promote this reduction of CO2 to the
level of carbohydrates:
CO2 + 2 NADPH+ 2 H+ (CH2O) + H2O + 2 NADP+ (2)
3 ATP → 3 ADP + 3 Pi
Thus, the overall photosynthetic process could be summarized by: light
CO2 + 2 H2O (CH2O) + H2O + O2 (3)
(Parsons et al., 1984; Gregory, 1989; Kirk, 1994).
Primary production can be distinguished into gross and net production. The gross primary production is the total amount of organic material produced by photosynthesis. The net primary production deducts the costs of respiration from the total photosynthetic output. It therefore represents the gain in plant biomass that is available for consumption by other trophic levels. Conversely, the energy required for the metabolic processes of all organisms is provided by the respiration of organic matter, the reverse reaction to photosynthesis. Respiration involves the breakdown of complex molecules (such as carbohydrate) associated with the consumption of oxygen to yield energy, carbon dioxide and water (Williams et al., 2002).
The photo-autotrophs within the marine environment, include mainly algae and photosynthetic bacteria (Parsons et al., 1984). However, the principal primary producers in the water column are unicellular algae collectively called phytoplankton (Gr. phytos: plant;
plankton: drifting). Some of these may form colonies. There are approximately 28 000 species
of phytoplankton, characterized by size, shape and pigmentation (Kennish, 2001). The main taxonomic groups include diatoms (class Bacillariophyceae), dinoflagellates (class Dinophyceae), coccolihophores (class Prymnesiophyceae) and silicoflagellates (class Dictyochophyceae). Euglenoids (class Euglenophyceae), cryptomonads (class Cryptophyceae), and green algae (class Chlorophyceae) may also be important in coastal areas. The response of each algae species to the surrounding environmental conditions determines the patterns of planktonic succession. Algal diversity regulates the structure of marine systems and photosynthetic rates, since the algae are at the base of the food chain (Margalef, 1978; Smayda, 1980; Reynolds, 1989).
Table 1 describes the main size classes of phytoplankton.
Size Category Size Range Macroplankton 2 - 20 cm Mesoplankton 0.2 - 20 mm Microplankton 20 - 200 µm Nanoplankton 2 - 20 µm Picoplankton 0.2 - 2 µm
Table 1. Classification of phytoplankton according to size. (from Kennish, 2001)
The phytoplankton contributes to 90% of the total photosynthesis in the marine environment whereas benthic (referring to the organisms that live on the seafloor) macro- and micro-algae and vascular plants (salt marsh plants, mangroves, and seagrasses), present in shallow systems, are the main responsible for the remaining share (Kennish, 2001).
Limiting factors of primary production
The light availability influences the amount of phytoplankton production. Significant photosynthesis occurs essentially in the euphotic (Gr. eu: good, well; photos: light) zone, considered to be the layer within which PAR falls to 1% of the surface value. The benthic algae community is, as such, geographically restricted to shallow coastal areas where the light penetration allows their development (Nybakken, 1997).
The variation of the photosynthetic rate with light is represented in Fig. 1 by the photosynthesis-irradiance (P-E) curve. There is no photosynthesis in the dark, and only respiration occurs. The amount of respiration at low light intensities overcomes photosynthesis until the compensation point (when respiration balances photosynthesis)
Fig. 1. Photosynthesis as a function of irradiance (E). Pmax represents the maximal photosynthesis, Ek the
saturation onset parameter, Ec the light compensation point, Pg the gross photosynthesis, Pn the net
photosynthesis. (from Parsons et al., 1984)
is reached, which occurs at the light compensation point (Ec). Photosynthesis increases with
irradiance until a maximum rate is reached (Pmax, the assimilation number related to the dark
reactions and its capacity to fix carbon). Ek characterizes the onset of saturation. It is
determined by the intersection of Pmax with the extension of the initial slope of the P-E curve.
The initial slope, generally parameterized as α, is defined as the quantum yield and it is related to the light reactions. These parameters are species-specific. Light becomes inhibitory at high intensities, provoking a decline in P as E increases (Parsons et al., 1984; Lalli & Parsons, 1997).
The vertical mixing of the water column determines the phytoplankton exposure to light, thus its photosynthetic rate. The photosynthesis of a cell equals its respiration (Pc = Rc) at the compensation depth (Fig. 2); above this depth there is a net photosynthetic gain, and below it there is a net loss. The cells will be exposed to an average light intensity in the water column during mixing. The critical depth (Dcr) is the depth at which the average light intensity equals
the compensation light (Ic); it corresponds to the depth where photosynthesis throughout the
Dcr,the area contained in the points 1, 2, 3, 4 (Fig. 2) (corresponding to the phytoplankton
respiration) will equal the area contained in the points 1, 2 and 5 (corresponding to the photosynhtesis). If the depth of water mixing (Dm) is greater than the Dcr, then Pw < Rw and no
net production takes place. If the Dcr > Dm, the average light intensity in the mixed layer
Fig. 2. Relationship between the compensation and critical depth, and the depth of mixing (see text). (modified from Lalli & Parsons, 1997)
(through which the phytoplankton is circulating) will be enough so that a positive net production in the water column (Pw > Rw) will be achieved (Parsons et al., 1984; Lalli &
Parsons, 1997).
The amount of solar radiation that reaches the sea surface varies with latitude, decreasing from the equators towards the poles. This factor contibutes to the seasonal differences of primary production between the polar, temperate and tropical regions. However, the light is not the sole factor regulating plant growth. Both light and nutrients must be available for the phytoplankton production to take place. All primary producers require inorganic elements for their nutrition (nutrients). Some generalizations can be made regarding the latitute variation of primary production, which is related to light and nutrient availability, together with seawater mixing conditions. For instance, in temperate regions two peaks of production are commonly observed: one in spring, when light increases and one in autumn, after the breakdown of the thermal stratification developed during summer. The summer surface stratification is broken by the increasing wind-driven mixing, which induces a resuspension of the nutrients (Lalli & Parsons, 1997; Nybakken, 1997).
Essential elements like nitrogen, phosphorus, silicon, iron and manganese can limit primary production in seawater when present in lower concentrations than the required by phytoplankton. Other nutrients (carbon, calcium, magnesium, oxygen, potassium, sodium,
copper, molybdenum, etc), including organic ones (biotin, thiamine, etc), are also required by autotrophs, but are usually available in excess and therefore are generally not limiting (Hecky & Kilham, 1988). Nutrient inputs to the aquatic environment includes land drainage, sewage discharges and river outflow (Boesch & Brinsfield, 2000). The elements that become incorporated in the organisms are recycled after their death by decomposers (bacteria), and returned to the environment in inorganic forms that can be used by primary producers (Nixon, 1981). The concentrations of nutrients present in the euphotic zone depends greatly on the degree of mixing of the water column.
The uptake of carbon, nitrogen and phosphorus by phytoplankton generally follows the ratio 106:16:1 (the Redfield ratio by atoms; Redfield et al., 1963). Nutrient-sufficient phytoplankton produces biomass with a mean C:N:P Redfield ratio. Variations in the stoichiometry of dissolved inorganic nutrients may predict which nutrient will potentially limit biomass production. The Liebig's Law of the Minimum (Liebig, 1840), originally applied to plant or crop growth, stresses the importance of limiting factors in ecology. This law states that growth is not controlled by the total of resources available, but by the scarcest (limiting) one in relation to the need. Only by increasing the amount of the limiting nutrient would the growth of a plant be improved.
According to their content of mineral nutrients the aquatic systems can be classified as: oligotrophic (Gr. oligo: few), referring to regions with low concentration of nutrients and correspondingly low biological activity.
mesotrophic (Gr. meso: middle), regions with intermediate concentrations and productivity.
eutrophic (Gr. eu: good), regions with high nutrient concentrations supporting a high biological activity.
hypertrophic (Gr. hyper: excessive, highest), regions with excessive concentration of nutrients (Kennish, 2001).
Grazing (the consumption of plants by herbivores) can also control biomass. The link between phytoplankton and zooplankton (the most numerous herbivores of the aquatic system) varies with latitude. Grazing generally lags behind phytoplankton peaks in middle latitudes. The phytoplankton population decreases as the grazing pressure increases, leading to an eventual decline on the zooplankton population (Sverdrup et al., 2003). Some mechanisms in the photosynthetic process, such as enzyme activity and electron transport, are influenced by temperature. However, the response of photosynthesis to temperature is
ultimately dependent upon the light availability (Davison, 1991). The dominant factors regulating primary production are as a conclusion: light and nutrient availability (Kirk, 1994).
Measuring Primary Production
Primary production is of major importance regarding carbon and energy budgets of ecosystems. The estimation of primary production rates in the sea, and the proper methods to be used, is a fundamental issue in oceanographic studies. However, no currently used method gives an exact measure of photosynthesis. Ambiguity includes factors as the distinction between gross and net photosynthesis, impact of metabolic processes not directly related to photosynthesis and artifacts associated with incubation (Platt & Sathyendranath, 1993).
To measure primary production one can measure the rate of increase in plant biomass or the rate of photosynthesis. To estimate the plant material in a sample of seawater one may count the cells, or extract the chlorophyll. The evolution of these parameters over time under a fixed area gives the temporal change of biomass estimating the net production (Ryhter, 1956; Sverdrup et al., 2003).
The two main approaches to estimate primary production follow the uptake of carbon dioxide or the generation of oxygen (see equation 3). The changes in dissolved oxygen over time are generally measured by the light-dark bottle incubation method (Strickland & Parsons, 1972). Initial seawater samples are titrated to determine the oxygen concentration at the beginning of the sampling. The remaining samples are incubated during a suitable period in clear (“light”) and opaque (“dark”) bottles. The rates are then estimated by the following equations:
Net Community Production = [O2]light - [O2]initial (4)
Respiration = [O2]initial - [O2]dark (5)
Gross Production = [O2]light - [O2]dark (6)
This method allows the discrimination between net and gross production, and the quantification of respiration. Primary production may be expressed in volumetric units or per unit area. Per unit area primary production can be estimated by taking samples from different depths, which are then depth-integrated to obtain the water column production
expressed in m2 of sea surface. The more sensitive radiocarbon technique is generally preferred when primary production is low.
Carbon uptake and fixation is commonly monitored by adding the radioactive isotope
14C to light and dark bottles that are then incubated (Steeman Nielsen, 1952). The sample
is filtered after incubation and the 14C incorporated in the phytoplankton is measured in a scintillation counter. Carbon uptake is calculated from the amount of radioactivity and the original concentration of unlabelled inorganic carbon in the water. The high sensitivity of this method allows short incubation times, therefore reducing the potential bottle artifacts associated to in vitro techniques. However, it cannot determine unequivocally which term is actually measured, generally expressing a rate between net or gross production.
Modelling can be used as a tool to simulate and predict primary production, although it is not a measurement in sensu stricto. Most predictive models relate the rate of production to light intensity (P-E curves), in which the initial slope, α, and the light-saturated rate of photosynthesis (Pmax) are the fundamental parameters. Rates are usually determined by
laboratory incubations over a light gradient. Curve-fitting is thereafter used to model the light dependence of photosynthesis. The vertical gradient of photosynthesis may be predicted by transferring this data to the underwater light profile. Per unit area production is then estimated by vertical integration (Parsons et al., 1984; Tilzer et al., 1993).
Bio-optical models attempt to predict phytoplankton photosynthesis from light and biomass data. Satellite-borne radiometers can measure the back-irradiance from the upper optical depth of the sea in selected wavelengths. Empirical algorithms are established between surface chl a and water-leaving irradiances, allowing remote sensing estimates of chlorophyll on global scales and further calculation of primary production (Smith & Baker, 1978; Balch et al., 1989).
There are several other estimation methods, none of which widely used. This includes the use of stable oxygen-18 that allows discrimination of photosynthesis and respiration, double-flash fluorometry that uses the natural chlorophyll fluorescence to make instantaneous photosynthesis estimates avoiding the need for containment and incubation, 15NO3
assimilation in vitro allowing the distinction between “new” versus “regenerated” production (Platt & Sathyendranath, 1993), and the carbon-13 technique that has the advantage of using the stable isotope 13C (Hama et al. 1983) rather than the radioactive isotope 14C. Combination of techniques such as flow cytometry with molecular biology (like anti-body molecular probes) allow the estimation of cell-specific photosynthetic rates (Maestrini et al., 1993).
1.2. EUTROPHICATION
Eutrophication can be simply defined as the process of increasing the nutrient concentrations (particularly nitrogen and phosphorus) of a water body through natural or artificial means (Clark et al., 1997). Other definitions are introduced below in the “Anthropogenic Eutrophication” section. Cultural or anthropogenic (Gr. anthropo: man; La.
genic: origin) eutrophication refers to eutrophication attributed to human actions.
Despite the fact that eutrophication can be a natural occurring phenomenon, the general usage is now related to the excessive anthropogenic eutrophication that is affecting several ecosystems throughout the world, including lakes, rivers, estuaries and coastal areas (Schindler, 1974; Diaz & Rosenberg, 1995; Andrén, 1999; Billen et al., 1999; Cloern, 2001). More than half of the world population lives in the coastal region inducing an increase in the levels of disposal of waste products from agriculture, domestic and industrial activities to coastal waters (Paerl, 1999). The evolution of the concept of eutrophication parallels as such the intensified pressure of cultural eutrophication. However, within the context of this work, eutrophication will be referring to both natural and human (anthropogenic) sources. This work will try to characterize these different types of eutrophication.
An Example of Natural Eutrophication: The Upwelling Event
An offshore water mass transport is produced when the wind blows nearly parallel to the coastline. This Ekman transport (Ekman, 1905) is a result of the Coriolis effect (Coriolis, 1835) in which the surface water is deflected ≈ 45º to the right of the wind’s direction in the Northern hemisphere and to the left in the Southern hemisphere. The Coriolis effect can be summarized as the action of the centrifugal forces (set up by the Earth’s rotation) in deflecting the bodies in motion to the right of their original direction in the Northern hemisphere, and conversely in the South. The deeper water of lower temperature and greater density replaces the surface water moving away from the coastline, creating a coastal upwelling current (Fig. 3). Winds can also drive the water toward the coast or make it converge with another water mass. These waters pile up and move downward to create a downwelling current (Barber & Smith, 1981; Sverdrup et al., 2003).
Fig. 3. Cross section: North winds along a west coast on the northern hemisphere causes an offshore Ekman transport of water (a). Plan view: The displaced water is replaced by cold nutrient-rich upwelled water (b). (from Stewart, 2004)
The deeper cold waters have high concentrations of nutrients essential to plant growth. Therefore, although upwelling regions make up only about 0.1% of the surface area of the ocean, they support high levels of primary production on a per unit area basis (Table 2). Table 2. Global primary production in the marine environment.
Regions g C mPP * -2 yr -1 Ocean Area km2 Area % Total PP *
Upwellings 640 0.4 x10⁶ 0.1 0.2 x10⁹
Coasts 160 54 x106 15 8.6 x10⁹
Open oceans 130 307 x106 85 39.9 x10⁹
*PP stands for Primay Production (from Smith & Hollibaugh, 1993).
This enhanced biological productivity by natural eutrophication processes can support a large biomass of commercially valuable fish. Upwelling also exerts a considerable influence on the local weather of the adjacent coastal regions. The cooler waters coming to the surface causes both surface water and land temperatures to drop significantly in periods of active coastal upwelling. Weather onshore of regions of upwelling tends to have fog, low stratus clouds, a stable stratified atmosphere, little convection, and little rain (Stewart, 2004).
Upwelling can be found along the west coasts of continents, along the equator, beneath cyclonic (counter clockwise) winds and adjacent to Langmuir-type cells (linear convergences in the open ocean). The major coastal upwelling regions are found along the eastern ocean boundaries, and the Somali and Arabian coasts (Fig. 4). The ocean currents that drive the main coastal upwelling include: the California current system off western North America, the Peru-Humboldt current system off western South America, the Canary and Iberian current system off northwestern Africa and Iberian Peninsula, the Benguela current system off southwestern Africa and the Somali current in the Indian ocean (Barber & Smith, 1981; Kudela et al., 2005).
Fig. 4. Major upwelling regions of the world (shown by stippled areas). (modified from Barber & Smith, 1981).
Upwelling tends to be seasonal in temperate latitudes, where it peaks in the spring-summer, but tends to be year-round in the more tropical zones. Seasonal or longer variations in wind patterns (such as El Niño) lead to changes in upwelling that can impact fisheries. Also, the spatial variability of this process, as affected by coastline geometry and bottom topography, produces highly heterogeneous environments types. A coastal upwelling index (CUI) based on an estimate of the alongshore wind stress (the driving force for upwelling) has been used to indicate the variations of intensity (Bakun, 1973).
The primary production based on newly available N (nitrogen), i.e., N that originates from below the euphotic zone, is defined as “new” production. The dominant source for new production is nitrate. In upwelling areas the rate of new production is high. The recycled N within the euphotic zone (primarily in the form of ammonium and urea) is the basis for “regenerated” production (Dugdale & Goering, 1967).
Anthropogenic Eutrophication
Anthropogenic eutrophication has become one of the most serious threats to aquatic ecosystems around the world since the last half of the 20th century (Nixon, 1995; Andrén, 1999; Cloern, 2001; Jonge et al., 2002). Lakes and rivers are vulnerable areas but estuarine, coastal and marine ecosystems may also be affected. Problematic regions in Europe include the Baltic Sea (Cederwall & Elmgren, 1990; Bonsdorff et al., 1997; Kononen, 2001), the Greater North Sea (estuaries and fjords, the Wadden Sea, German Bight, Kattegat and eastern Skagerrak; EEA, 2001), the Irish sea (Allen et al., 1998) and estuaries and coastal lagoons of
the Iberian coast and the Mediterranean sea (Arhonditsis et al., 2000; Moncheva et al., 2001; Newton et al., 2003; Nuccio et al., 2003). The European Commission (EC) have issued several directives as a response, including the Urban Waste Water Treatment Directive (UWWT; Directive 91/271/EEC; EC, 1991a), the Nitrates Directive concerning the protection of waters against pollution caused by nitrates from agricultural sources (Directive 91/676/EEC; EC, 1991b), and the recent Water Framework Directive (WFD; Directive 2000/60/EC; EC, 2000), in order to prevent further deterioration and protect and enhance the environmental status of European aquatic systems.
Several definitions regarding anthropogenic eutrophication can be found. The Helsinki Commission (HELCOM, 2000) states eutrophication as:
“a condition in an aquatic ecosystem where high nutrient concentrations stimulate
the excessive growth of algae, which leads to an imbalanced function of the ecosystem”.
The European Environmental Agency (EEA) defines eutrophication (EEA, 2001) following Nixon’s criteria (Nixon, 1995):
“increase in the rate of supply of organic matter to an ecosystem, which most
commonly is related to nutrient enrichment enhancing the primary production in the system”.
The EU definition of eutrophication is incorporated in the key Directive on UWWT (EC, 1991a):
“enrichment of water by nutrients, especially compounds of N and/or P, causing an
accelerated growth of algae and higher forms of plant life, to produce an undesirable disturbance to the balance of organisms present in the water and to the quality of the water concerned.”
The original definition of eutrophication from the U.S. National Estuarine Eutrophication Assessment (NEEA) study (Bricker et al. 1999), developed by the National Oceanic and Atmospheric Administration (NOAA), was recently updated (Bricker et al. 2003b):
“a natural process by which productivity of a water body, as measured by organic matter, increases as a result of increasing nutrient inputs. These inputs are a result of natural processes but in recent decades they have been greatly supplemented by various human related activities. Cultural eutrophication, or nutrient overenrichment, is the enhanced accumulation of organic matter, particularly algae, that is caused by human related increases in the amount and composition of nutrients being discharged to the water body. A variety of impacts may result,
including nuisance and toxic algal blooms, depleted dissolved oxygen, and loss of submerged aquatic vegetation and benthic fauna. These impacts are interrelated and usually viewed as having a negative effect on water quality, ecosystem health, and human uses. Management concerns should address the human, or cultural, portion of nutrient additions insofar as the additions are detrimental to the environment.”
The degree of water quality will depend upon the system’s assimilative capacity, namely, the coupling between algae production and its consumption and decomposition, and the degree of advective transport, in the case of open systems.
The main causes of anthropogenic eutrophication include (Paerl, 1997; Boesch & Brinsfield, 2000; Cloern, 2001):
run-off of inorganic fertilizers from agricultural land (containing nitrates and phosphates).
run-off of manure from farms (containing nitrates, phosphates and ammonia). run-off from erosion (following mining, construction work or poor land use).
discharge of partially treated or untreated sewage (containing nitrates and phosphates). atmospheric deposition of N (originating from ammonia from animal husbandry and from combustion of fossil fuels in traffic, industry and households),
all of which result in deviation from the Redfield ratio (Redfield et al., 1963).
A cascade of possible consequences may follow, like (Paerl, 1997, Vollenweider, 1998; Danilov & Ekelund, 1999; Gacia et al., 1999; Moncheva et al., 2001) (Fig. 5):
excessive and frequent phytoplankton blooms (enhanced primary production). increase in turbidity (cloudiness) of water.
death of underwater rooted plants (seagrass).
increase in the rate of sedimentation, as the uneaten organic material decays. excessive consumption of oxygen for decomposition processes by bacteria.
development of hypoxic (Gr. hypo-: deficient) (Fig. 6) or anoxic (Gr. an-: absence of) conditions (referring to dissolved oxygen concentrations: anoxia < 0 mg l-1 O2; hypoxia >
0, ≤ 2 mg l-1 O2; biologically stressful > 2, ≤ 5 mg l-1 O2) (Diaz & Rosenberg, 1995).
death of fish and other organisms. decrease in species diversity.
change in dominant biota (e.g. from diatoms to flagellates because of the decrease of silicate in Redfield proportions, essential to the development of diatoms; Conley et al., 1993).
Fig. 5. Effects of eutrophication (Bricker et al., 1999).
occurrence of toxic algal blooms.
poisoning of fish, shellfish, birds and mammals (including humans).
Fig. 6. Global distribution of known oxygen depletion zones related to cultural eutrophication (modified from iaz & Rosenberg, 1995).
D
decrease in the amenity value of the water (e.g. it may become unsuitable for drinking or recreational activities).