Vector Sensor Arrays in Underwater Acoustic
Applications
Paulo Santos1, Paulo Felisberto1 and Sérgio M. Jesus1, 1Institute for Systems and Robotics, University of Algarve,
Campus de Gambelas, 8005-139 Faro, Portugal.
{pjsantos, pfelis, sjesus}@ualg.pt
Abstract. Traditionally, ocean acoustic signals have been acquired using hydrophones, which measure the pressure field and are typically omnidirectional. A vector sensor measures both the acoustic pressure and the three components of particle velocity. Assembled into an array, a vector sensor array (VSA) improves spatial filtering capabilities when compared with arrays of same length and same number of hydrophones. The objective of this work is to show the advantage of the use of vector sensors in underwater acoustic applications such as direction of arrival (DOA) estimation and geoacoustic inversion. Beyond the improvements in DOA estimation, it will be shown the advantages of using the VSA in bottom parameters estimation. Additionally, is tested the possibility of using high frequency signals (say 8-14 kHz band), acquired during the MakaiEx 2005, to allow a small aperture array, reducing the cost of actual sub-bottom profilers and providing a compact and easy-to-deploy system.
Keywords: Vector sensor array, Direction of arrival estimation, Bottom properties estimation.
1 Introduction
Acoustic vector sensors measure both the acoustic pressure and the three components of particle velocity. Thus a single device has spatial filtering capabilities not available with pressure hydrophone. A Vector Sensor array (VSA) has the ability to provide information in both vertical and azimuthal directions allowing for a high directivity not possible with arrays of traditional hydrophone with same length and the same number of sensors. These characteristics have been explored during the last decade but most of the studies are related to direction of arrival (DOA) estimation. However, due to the VSA ability to provide directional information, this device can be used with advantage in other applications such as geoacoustic inversion. In this work it is shown that a reliable estimation of ocean bottom parameters can be obtained using a small aperture VSA and high-frequency signals.
This paper is organized as follows: in Section 2 is made a description of the contribution of this work to technological innovation. The state of the art and the related literature is presented in Section 3. Section 4 describes the vector sensor
measurement model and the theory related to the Bartlett estimator based on particle velocity for generic parameter estimation, enhancing the advantages of the VSA. In Section 5, the discussion of the results is made, showing that the VSA remarkably reduces the ambiguities presents in DOA estimation obtained with a hydrophone array and provide information both in vertical and azimuthal direction. Also, it is shown that VSA improves the resolution of bottom parameters estimation, such as sediment compressional speed, density and compressional attenuation based in matched-field inversion (MFI) techniques. The data herein considered was acquired by a four element vertical VSA in the 8-14 kHz band, during the Makai experiment 2005 sea trial, off Kauai I., Hawaii (USA) [1]. Finally Section 6 concludes this work.
2 Contribution to technological innovation
Vector sensors are long time used in underwater acoustic surveillance systems, mainly for DOA estimation. Only from the last decade the interest in VSA rose exponentially, influenced by electromagnetic vector sensor applications and developments in sensor technology that allowed building compact arrays for acoustic applications in the air. It is expected that in a near future will be also commercially available vector sensor devices well suited to develop compact underwater VSA at a reasonable costs. Beyond DOA estimation, it is likely that these new compact systems can be used with advantage over traditional hydrophone arrays in other underwater application fields, thanks to inherent spatial filtering capabilities of vector sensors. Although the advantage of use a VSA in DOA estimation is also considered in this work to show the enhanced spatial filtering capabilities of a short aperture (4 elements) VSA, the main focus is on using the short aperture VSA to improve inversion problems found in underwater acoustics, in particular geoacoustic inversion. The proposed geoacoustic inversion method based on MFI techniques shows the advantage of including particle velocity information that contributes to a better resolution of the estimated parameters, some of them with difficult estimation with traditional hydrophone arrays, even with larger aperture arrays. These methods were tested with field data acquired during Makai Ex 2005 [1], where probe signals in the 8-14 kHz band were used. The bottom estimates obtained are in line with the bottom characteristics known for the area. The band of the probe signal used is well above the band traditionally used in geoacoustic inversion (bellow 1 kHz), thus a systems based on a few elements VSA operating at such frequency band can be very compact, easy-to-deploy or to install in a light mobile platform like AUV, becoming a good alternative to actual profilers.
3 State of the art
During the last decade, several authors have been conducting research on vector sensors processing, most of them theoretical works, suggesting that this type of device has advantage in DOA estimation and giving rise to an improved resolution. Nehorai and Paldi [2] developed an analytical model, initially for electromagnetic sources
extending then to the acoustic case, to compare the DOA estimation performance of a VSA to that of an array that measures only scalar acoustic pressure. At the beginning of 2000’s, Cray and Nuttall [3], performed comparisons of directivity gains of VSA to conventional pressure arrays. Source bearing estimation was explored in [4], where the plane wave beamformer was applied to real data acquired by a four element VSA in the 8-14 kHz band, during Makai Experiment 2005, off Kauai I., Hawaii (USA). Increased spatial filtering capabilities gave rise to new applications where the VSA could be used with advantage over hydrophone arrays. Due to these characteristics the VSA is appearing in different fields like port and waterway security [5], underwater communications [6], underwater acoustic tomography and geoacoustic inversion [7,8]. The bottom parameter estimation results [9,10] using high-frequency signals acquired by the VSA during the Makai Ex 2005 are of considerable interest due to their uniqueness in this research area. Recently, some theoretical works [11,12] were published using quaternion based algorithms in order to more effectively process VSA data. These works are concerned to DOA estimation but in [10] it was suggested that quaternion based algorithms can be used with advantage also in geoacoustic inversions.
4 The measurement model
4.1 Particle velocity model formulation
Solving inversion problems by MFI techniques, a propagation model to generate field replicas is required. Herein a ray tracing model – TRACE [13] – is considered to generate the particle velocity components, beyond the acoustic pressure.
Using the analytical approximation of the ray pressure [13], the particle velocity )
(Θ0
v for a generic set of environmental parameters (Θ0) can be written as [14]:
p ) ( ) (Θ0 =u Θ0 v , (1)
where the vector u is a unit vector related to the pressure gradient. The environmental parameter depends on the characteristics of the acoustic channel, including ocean bottom parameters.
4.2 Data model
Assuming that the propagation channel is a linear time-invariant system, p is the pressure and vx, vy and vz are the three particle velocity components, a narrowband signal at frequency ω(omitting the frequency dependency in the following formulas) due to a source signal s, for a particular set of channel parametersΘ0, measured with an array of L vector sensors, can be written, for acoustic pressure as:
T pL p
p(Θ0)=[y 1(Θ0),...,y (Θ0)]
where ypl(Θ0) is the acoustic pressure at th
l vector sensor. The linear data model for the acoustic pressure is:
p p
p h s n
y (Θ0)= (Θ0) + , (3)
where hp(Θ0)is the channel frequency response measured on L pressure sensors and p
n is the additive noise. In the following formulation it is assumed that the additive noise is zero mean, white, both in time and space, with varianceσn2, uncorrelated between each sensor and uncorrelated with the signal s.
A similar definition has been adapted for the particle velocity:
T zL v z v yL v y v xL v x v v(Θ0)=[y 1(Θ0),...,y (Θ0),y 1(Θ0),...,y (Θ0),y 1(Θ0),...,y (Θ0)] y (4)
becoming the data model for the particle velocity components, taking in account (1): v
p
v u h s n
y (Θ0)= (Θ0)⊗ (Θ0) + , (5)
where ⊗ is the Kronecker product and nv is additive noise.
Taking into account (3) and (5), the VSA data model defined for a signal measured on L elements can be written as:
+ Θ ⊗ Θ = Θ Θ = Θ v p p v p pv s n n h u y y y ( ) ) ( 1 ) ( ) ( ) ( 0 0 0 0 0 . (6)
Data model (6) expands data model for the particle velocity components with acoustic pressure.
4.3 Bartlett estimator
The classical Bartlett estimator is possibly the most widely used estimator in MFI parameter identification, maximizing the output power for a given input signal [15].
The Bartlett parameter estimate Θˆ0 is given as the argument of the maximum of the functional:
{
ˆ ( ) ( ) ( )ˆ( )}
ˆ ( ) ( )ˆ( ) ) (Θ = e Θy Θ0 y Θ0 eΘ =e Θ R Θ0 eΘ H H H B E P (7)where the replica vector estimator eˆ(Θ) is determined as the vector e(Θ) that maximizes the mean quadratic power:
)} ( ) ( ) ( { max arg ) ( ˆ Θ = e Θ RΘ0 eΘ e e H , (8)
where H represents the complex transposition conjugation operator, E
{}
. denotes statistical expectation and{
(Θ0) (Θ0)}
H
maximization problem is well described in [15], thus the Bartlett estimator when only pressure sensors are considered, can be written as:
= Θ) ( , p B P ) ( ) ( ) ( ) ( ) ( 0 Θ Θ Θ Θ Θ p H p p p H p h h h R h . (9)
Appling the above formulation to the data model (5), it was shown in [14] that an estimator for particle velocity outputs is:
[
]
( )[
cos( )]
( ) ) ( ) ( ) ( ) ( ) ( , 2 , 2 0 , Θ ∝ ∆ Θ Θ Θ Θ Θ = Θ H B p Bp H v B P P P θ u u u u . (10)where ∆θ is the angle between the vector u(Θ)from the replica and the vector )
(Θ0
u from the data. Based on this equation, one can conclude that the particle velocity Bartlett estimator response is proportional to the pressure Bartlett estimator response by a directivity factor (gave by the inner productu (Θ)u(Θ0)
H
), which could provide an improved side lobe reduction or even suppression when compared with the pressure response.
For the data model (6), the VSA Bartlett estimator is given by [14]:
[
]
( )
( ) 2 cos 2 ) ( ) cos( 1 ) ( , 2 , 2 , Θ ∆ ∝ Θ ∆ + ∝ Θ Bp B p v B P P P θ θ . (11)One can conclude that when the acoustic pressure is included a wider main lobe is obtained (11), compared to the estimator with only particle velocity components (10). However, including the pressure on the estimator, can lead to reduce ambiguities when frequencies higher then the working frequency of the array are used.
5 Discussion of results
5.1 DOA estimation
One of the Bartlett estimator applications is the conventional beamformer for DOA estimation. The plane wave beamformer is applied to compare the performance of the VSA versus hydrophone arrays. In the case of plane wave DOA estimation, the search parameter Θ is the direction(θS,φS)and the replica vector is simple a combination of weights, which are direction cosines as weights for the particle velocity components and a unit weight for the pressure and is given by [4]:
[
1,cos sin ,sin sin ,cos]
exp( . ) ) , ( S S S S S S S T ikSrr r ⊗ = θ φ θ φ φ φ θ e , (12)where rr is the position vector of the VSA elements (in this work the VSA used has four elements equally spaced with 10cm and located in the z-axis being the first one at
the origin of the Cartesian coordinates system), kS
r
corresponding to the chosen steered, or look direction (θS,φS) of the array,θS∈
[
−π,π]
is the azimuth angle and φS∈[
−π2,π2]
is the elevation angle, Fig. 1.Fig. 1. The array coordinates and the geometry of acoustic plane wave propagation, with azimuth θSand elevation φSangles.
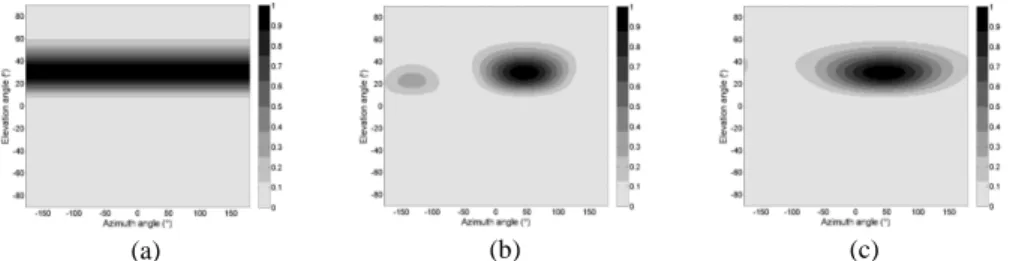
Fig. 2 presents the simulation results obtained for the working frequency of the array, 7500Hz, and for a DOA of (45º, 30º). Fig. 2 (a) shows that when the acoustic pressure sensors are considered (9), only the elevation angle is obtained due to omnidirectionality of the sensors. On the other hand, Fig. 2 (b) shows that when the particle velocity components are introduced, the DOA is perfectly resolved due to the directivity factor obtained with the inner product in (10). Finally, when acoustic pressure is included, a wider main lobe is obtained, Fig. 2 (c), however the ambiguities are eliminated. This can be observed even when frequencies higher then the working frequency of the array are used. The main advantage of the VSA in the DOA estimation is that it resolves both vertical and azimuthal direction when compared with traditional hydrophones arrays. The results of the real data DOA estimation can be seen in [4].
(a) (b) (c)
Fig. 2. DOA estimation simulation results at frequency 7500Hz with azimuth 45º and elevation 30º for Bartlett beamformer considering: only pressure sensors response (a), only particle velocity components response (b) and all elements of the VSA (p + v) (c).
5.2 Bottom parameters estimation
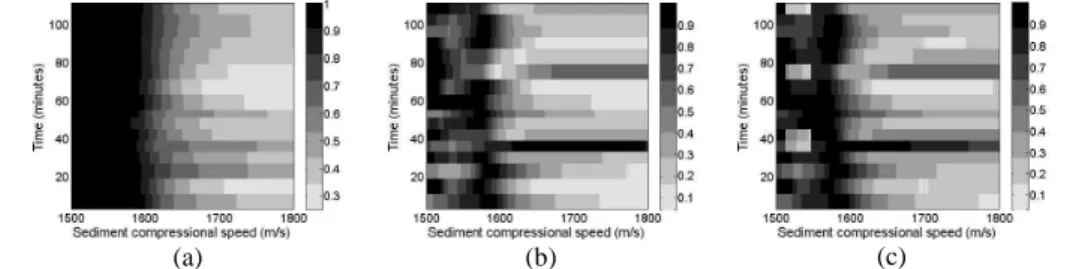
The ocean bottom parameters estimation is another subject where the VSA can be used with advantage. Fig. 3 shows the sediment compressional speed estimation
obtained with pressure data only (a), particle velocity only (b) and both pressure and particle velocity (c). The estimation results for density and compressional attenuation can be found in [10].
(a) (b) (c)
Fig. 3. Real data ambiguity surfaces for sediment compressional speed during the period of acquisition considering: pressure only (a), particle velocity only (b) and both pressure and particle velocity (c).
The ambiguity surfaces illustrated in Fig. 3 were obtained for the maximum values of estimator functions during almost 2 hours of data acquisition, showing the stability of the results. Fig. 3 (a) shows a wider main lobe obtained when only pressure data is considered (9), with poor resolution of the parameter estimation. Fig. 3 (b) and (c) were obtained considering the VSA Bartlett estimators (10) and (11), respectively without and with pressure. Comparing plots (b) and (c) clearly show that the estimate of sediment compressional speed is 1575±5 m/s, but when the estimate function without pressure is considered, a narrower main lobe appears as well as some ambiguities, like in DOA estimation. The results obtained with the function that included all the vector sensor components are stable during the period of acquisition and show an increased resolution of the bottom parameters estimation, not possible with hydrophone arrays of same number of sensors.
6 Conclusion
This work shows the advantage of using a VSA for DOA and bottom parameters estimation. It was seen that the VSA reduces ambiguities in DOA estimation, when compared with hydrophone arrays, providing information in both vertical and azimuthal directions. Also, the VSA improves the resolution of the bottom parameters estimation allowing to access parameters, usually with difficult estimation using traditional hydrophone arrays.
One can remark that reliable estimates are obtained even with a small aperture array (4 elements only) and high frequency signals (say 8-14 kHz band). Thus the usage of VSA with high-frequencies can provide an alternative for a compact and easy-to-deploy system in various underwater acoustical applications.
Acknowledgments
The authors would like to thank Michael Porter, chief scientist for the Makai Experiment, Jerry Tarasek at Naval Surface Weapons Center for the use of the vector sensor array used in this work. The authors also thank Bruce Abraham at Applied Physical Sciences for providing assistance with the data acquisition and the team at HLS Research for their help with the data used in this analysis. Research supported by FCT – IST/ISR Plurianual funding program (U101/13).
References
1. Porter, M. et al: The Makai experiment: High-frequency acoustic. In: 8th ECUA, Jesus, S. M., Rodríguez, O. C. (eds) vol. 1, pp 9--11. Carvoeiro, Portugal (2006)
2. Nehorai, A., Paldi E.: Acoustic vector-sensor array processing. IEEE Trans. Signal Processing 42, 2481--2491 (1994)
3. Cray, B. A., Nuttall, A. H.: Directivity factors for linear arrays of velocity sensors. J. Acoust. Soc. Am. 110, 324--331 (2001)
4. Santos, P., Felisberto, P., Hursky, P.: Source localization with vector sensor array during Makai experiment. In: 2nd International Conference and Exhibition on Underwater Acoustic Measurements, Technologies and Results, Heraklion, Greece (2007)
5. Shipps, J. C., Abraham, B. M.: The use of vector sensors for underwater port and waterway security. In: Sensors for Industry Conference, New Orleans, Louisiana, USA (2004) 6. Abdi, A., Guo, H., Sutthiwan, P.: A new vector sensor receiver for underwater acoustic
communication. In: Proceedings MTS/IEEE Oceans, Vancouver, BC, Canada (2007) 7. Peng, H., Li, F.: Geoacoustic inversion based on a vector hydrophone array. Chin. Phys.
Lett. 24, 1997--1980 (2007).
8. Lindwall, D.: Marine seismic surveys with vector acoustic sensors. In: Proceedings of Soc. Exploration Geophysicists annual meeting. New Orleans, USA (2006)
9. Santos, P., Felisberto, P., Jesus, S. M.: Estimating bottom properties with a vector sensor array during MakaiEx 2005. In: 2nd International workshop on Marine Technology, MARTECH 2007. Vilanova I LA Geltrú, Barcelona, Spain (2007)
10. Santos, P., Rodríguez, O. C., Felisberto, P., Jesus, S. M.: Geoacoustic Matched-field inversion using a vertical vector sensor array. In: 3rd International Conference and Exhibition on Underwater Acoustic Measurements, Technologies and Results, Nafplion, Greece (2009)
11. Miron, S., Le Bihan, N., Mars, J. I.: Quaternion-MUSIC for vector sensor array processing. IEEE Transactions on Signal Processing 54, (4), 1218--1229 (2006)
12. Wang, Y. H., Zhang, J. Q., Hu, B., He, J.: Hypercomplex model of acoustic vector sensor array with its application for the high resolution two dimensional direction of arrival estimation. In: I2MTC 2008 – IEEE International Instrumentation and Measurement Technology Conference, Victoria, Vancouver Island, Canada (2008)
13. Rodríguez, O. C.: The TRACE and TRACEO ray tracing programs. Physics Department, SiPLAB, FCT, University of Algarve (2008)
14. Santos, P., Rodríguez, O. C., Felisberto, P., Jesus, S. M.: Geoacoustic Inversion using a vertical vector sensor array. Submitted to J. Acoust. Soc. Am. (2009)
15. Krim, H., Viberg, M.: Two decades of array signal processing research. IEEE Signal processing magazine, pp 67--94 (1996)