Seagrass meadows improve inflowing water quality in aquaculture ponds
Carmen B. de los Santosa,*, Irene Olivéa,1, Márcio Moreiraa,b, André Silvaa, Cátia Freitasa, Ravi Araújo Lunab, Hugo Quental-Ferreirab, Márcio Martinsa, Monya M. Costaa, João Silvaa, Maria Emilia Cunhab, Florbela Soaresb, Pedro Pousão-Ferreirab, Rui Santosa.
a CCMAR – Centre of Marine Sciences of Algarve, University of Algarve, Campus de Gambelas, 8005-139, Faro, Portugal.
b IPMA – Portuguese Institute for the Sea and Atmosphere, EPPO – Aquaculture Research Station, Avenida Parque Natural da Ria Formosa, 8700-194, Olhão, Portugal.
* corresponding author. Email address: cbsantos@ualg.pt (C.B. de los Santos).
1 Present address: School of Geographical and Earth Sciences, University of Glasgow, Glasgow, United Kingdom.
https://doi.org/10.1016/j.aquaculture.2020.735502
Received 4 October 2019, Received in revised form 18 December 2019, Accepted 18 May 2020, Available online 29 May 2020.
Abstract
Water quality is critical for fish health in aquaculture production. In flow-through systems, the inflowing water normally requires quality controls and treatments for being supplied from coastal water bodies that can be polluted by nutrients, suspended solids, and microorganisms. Here we assess how seagrass meadows benefit aquaculture systems through the provision of ecosystem services (water filtration, biological control, and regulation of dissolved gasses) in the water reservoir that supplies earthen ponds in an aquaculture system in southern Portugal. In the 1.45-ha reservoir, seagrasses retained daily an estimate of 0.8–1.8 kg d-1 of nitrogen, 0.04–0.07 kg d-1 of phosphorus in their biomass, and 0.7–1.1 kg dw d-1 of suspended total particulate matter, bringing benefits in terms of nutrient and particle removal from the water column. Diel and spatial variation in faecal coliforms levels (Escherichia coli) in the reservoir suggested that seagrasses, in
combination with light exposure, may reduce the levels of this pathogen. Furthermore, the seagrass-dominated system oxygenated the water through photosynthesis at a faster rate than the respiratory oxygen consumption, maintaining the system above the aquaculture minimum oxygen. This study demonstrates that seagrasses can be used as a nature-based solution to overcome water quality challenges in flow-through aquaculture ponds.
Keywords
Water quality; Water purification; Seagrass; Biological control; Nature-based solutions.
Highlights
• Ecosystem services provided by seagrasses were assessed for the specific needs of an aquaculture activity.
• Seagrass-dominated reservoir maintained the system above the aquaculture minimum oxygen.
• Seagrass retained high quantities of particulate matter in their leaves and sediment, and nutrients in their biomass.
• Seagrasses, in combination with light exposure, may control the levels of pathogenic bacteria.
• Seagrasses in water reservoirs could help overcome water quality challenges in naturally water-fed aquaculture ponds.
1. Introduction
Water quality is the most important factor affecting fish health and performance in aquaculture production systems (Boyd and Tucker, 2012; Boyd, 2017; Plumb and Hanson, 2000). Poor water quality may lead to a low fish production by increasing the animals’ stress, leading to suboptimal growth, creating disease problems, and eventually causing mortality (Boyd, 2017; Plumb and Hanson, 2000) and consequently economical losses. Water quality can be defined by a series of physical, chemical and biological parameters that affect survival, reproduction, growth and welfare of the cultivated fish, being the most important ones: temperature, salinity, pH, dissolved oxygen, inorganic nutrient concentration (ammonium, nitrate, phosphate), suspended solids and organic matter concentrations, and presence and concentration of pathogens (Blancheton et al., 2013; Boyd and Tucker, 2012; Boyd, 2017; Plumb and Hanson, 2000). Aquaculture production seeks to maintain these parameters at the optimal level to get a high fish production at minimum costs. Yet, water quality control and maintenance may involve costly solutions that require high investments in water treatment processes such as solids removal through filtering, sterilisation by UV radiation, and oxygenation (Boyd and Tucker, 2012; Chiam and Sarbatly, 2011). For instance, in flow-through or open culture systems in coastal areas, where the inflowing water is used to renew the water in the culture ponds, quality controls and treatments are required, since the inflowing water may be polluted by inorganic nutrients, suspended solids, organic matter and microorganisms. To overcome water quality challenges, aquaculture research and development is constantly looking for new solutions to increase yield per unit of water consumption.
Nature-based solutions are gaining momentum to address environmental, societal and economic challenges through the services provided by ecosystems that are used in a smart “engineered” way (Albert et al., 2017; Cohen-Shacham et al., 2016). Coastal aquaculture systems could benefit from nature-based solutions to overcome the water quality challenges, for instance through the filtering services provided by coastal vegetated ecosystems (Costanza et al., 1997). Seagrasses, marine flowering plants form extensive meadows in coastal shallow waters and are widely recognised for their role in nutrient cycling (Costanza et al., 1997) and water purification by filtration (Lemmens et al., 1996; Moore, 2004; Short and Short, 1984), acting as natural biofilters in oyster farming (Sandoval-Gil et al., 2016). As such, seagrasses might be used to improve the quality of the inflowing water used in aquaculture pond systems, decreasing the costs of water treatments necessary to attain the water quality requirements for fish growth.
The seagrass services from which aquaculture could benefit in terms of regulation and maintenance of water quality are (codes in brackets correspond to classification following CICES V5.1,
Haines-Young and Potschin, 2018): 1) the mediation through filtering or storage of water pollutants (2.1.1.2) by fixing and storing nutrients and trapping suspended particles; 2) the regulation of the chemical composition of the seawater (2.2.6.1) by regulating the concentrations of dissolved gases such as oxygen; 3) and the control of diseases (2.2.3.2) by reducing, through biological interactions, the incidence of pathogenic bacteria. In brief, seagrasses remove dissolved inorganic (ammonium, nitrates, phosphates) and organic nutrients from the water column through nutrient uptake by their leaves and roots (e.g. Alexandre et al., 2011), which are fixed and stored in their tissues. They are very efficient in retaining suspended particulate matter, including fine sediments and associated nutrients and organic matter (Gacia et al., 1999; Terrados and Duarte, 2000), making water clearer (Lemmens et al., 1996). In addition, seagrass ecosystems are one of the most productive ecosystems on Earth (Duarte and Cebrián, 1996), releasing high quantities of oxygen through photosynthesis. They also reduce fish, human and invertebrate exposure to bacterial pathogens (Lamb et al., 2017) and produce phytochemicals that kill or inhibit human pathogens (Kannan et al., 2010).
Based on the ecological function and services of seagrass ecosystems, we hypothesised that the quality of the inflowing water to aquaculture ponds may be naturally improved if previously channelled through reservoirs colonised by seagrass meadows. This hypothesis was built upon an emergent research opportunity from the existence of a naturally seagrass-dominated water reservoir that provides water to a semi-intensive experimental aquaculture station with an open circulation system in the Ria Formosa, a coastal lagoon in South Portugal. To test our hypothesis, we investigated water quality parameters in the water reservoir regarding three ecosystem services: 1) water filtration (nutrient and particle retention), 2) regulation of the chemical composition of the seawater (dissolved oxygen), and 3) bacteria control. Additionally, we investigated the variation in some of the services over diel cycles in order to gain insight into the fine temporal scale of seagrass ecosystem services, which is still poorly evaluated (Nordlund et al., 2018).
2. Materials and methods
2.1. Study location, aquaculture system and sampling design
The study was conducted at the Aquaculture Research Station from the Institute for the Sea and Atmosphere (EPPO-IPMA) located at the Natural Park of the Ria Formosa, a meso-tidal coastal lagoon (Fig. 1A). The station extends over ca. 7 ha and encompasses a fish hatchery and 17 open earthen ponds, which are fed with natural seawater pumped from a reservoir with three sections (Fig. 1B-D): a receiving pond (0.94 ha) connected to the lagoon through a tidal gate, a channel (0.1 ha), and a donating pond (0.41 ha) from which the water is pumped into the culture ponds (Fig. 1B). The
water depth and capacity of the reservoir are variable with the tide, ranging from 0.7 m to 2.0 m and from ca. 15,300 m3 to 27,900 m3, respectively. The earthen ponds are used for the polyculture of fish species (mainly gilthead seabream Sparus aurata, sea bass Dicentrarchus labrax, meagre
Argyrosomus regius, and Senegalese sole Solea senegalensis) and bivalves (mainly Pacific cupped
oyster Crassostrea gigas) in a semi-intensive system. The water reservoir is fully covered by seagrasses, mostly by the species Cymodocea nodosa, but also with small patches of Zostera marina and Z. noltei. The aquaculture effluents are directed into a settling lagoon and the released clarified water flows away from the water reservoir entrance with the tidal currents (Fig. 1B). The study was carried out during two diel cycles in autumn 2016 (October-November), with similar tidal ranges (2.6 and 2.1 m). Two sampling stations for water parameters were located above seagrass meadows, at the receiving and at the donating ponds (Fig. 1B).
Fig. 1. Location of the Research Aquaculture Station (EPPO-IPMA) and the Ria Formosa lagoon (A);
and scheme of the water reservoir (B) showing the two sampling stations (marked as circled S) and the water circulation in the system, with seawater entering from the Ria Formosa (C) through the tide gate into the receiving pond (D), which is connected through a channel to the donating pond, from which water is pumped into the aquaculture ponds and filtering system to the hatchery.
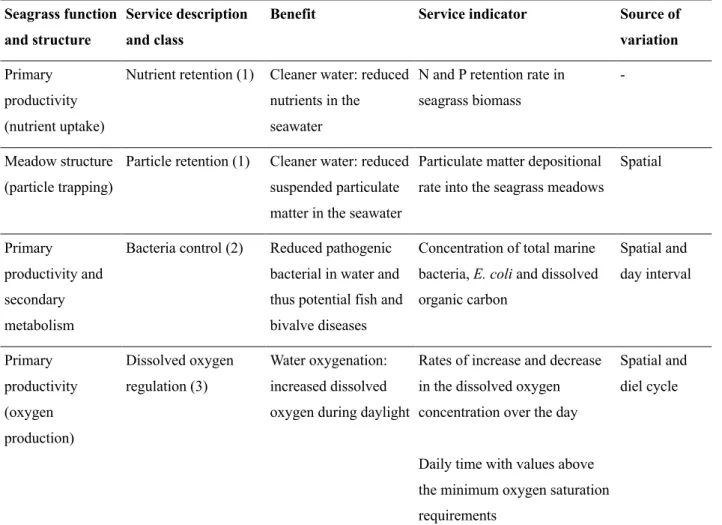
Table 1. Summary of the functions and the associated services and benefits provided by seagrasses
in relation to the water quality, along with the indicators used for their assessments in the water reservoir at the Aquaculture Research Station in Olhão (EPPO-IPMA, Portugal). Services were categorised in three classes: (1) filtering or storage of water pollutants, (2) biological or disease control, (3) regulation of chemical composition of the seawater. Sources of variation in the service indicators were spatial (receiving and donating ponds of the reservoir), day interval (daylight vs nigh-time), or over complete diel cycles.
Seagrass function and structure
Service description and class
Benefit Service indicator Source of variation Primary
productivity (nutrient uptake)
Nutrient retention (1) Cleaner water: reduced nutrients in the seawater
N and P retention rate in seagrass biomass
-
Meadow structure (particle trapping)
Particle retention (1) Cleaner water: reduced suspended particulate matter in the seawater
Particulate matter depositional rate into the seagrass meadows
Spatial
Primary
productivity and secondary metabolism
Bacteria control (2) Reduced pathogenic bacterial in water and thus potential fish and bivalve diseases
Concentration of total marine bacteria, E. coli and dissolved organic carbon Spatial and day interval Primary productivity (oxygen production) Dissolved oxygen regulation (3) Water oxygenation: increased dissolved oxygen during daylight
Rates of increase and decrease in the dissolved oxygen concentration over the day
Daily time with values above the minimum oxygen saturation requirements
Spatial and diel cycle
2.2 Seagrass assessment: density, morphometry and production
The shoot density (number of shoots m-2), above-ground (AG, leaves) and below-ground (BG, rhizomes and roots) biomass (g dry weight m-2, after drying at 60ºC for 48 h) of C. nodosa was assessed in samples taken at the donating pond (n = 4), channel (n = 2) and receiving pond (n = 4) with a metal core (20 cm diameter, 40 cm depth). Entire seagrass shoots of C. nodosa from each core (n = 3 to 9 shoots) were used to measure the number of leaves (leaves shoot-1), leaf dry weight (g dw), as well as length (cm) and weight (g dw) of vertical and horizontal rhizome fragments. Specific
leaf weight (SLW, g dw leaf-1) and specific rhizome weight (SRW, g dw cm-1) were obtained from those measurements.
The annual vertical and horizontal rhizome elongation rates (cm shoot-1 yr-1) of C. nodosa were estimated by lepidochronology (Cunha and Duarte 2005, Duarte et al. 1994), considering the plastochrone interval of 28.9 days for this species in the Ria Formosa (i.e. leaf production or appearance rate = 12.6 leaves shoot-1 yr-1). Annual rhizome and leaf production rates (Prod, g dw m -2 yr-1) were then estimated as:
(Eq. 1) Prodrhizome = [RER x SRW x (Density ± CI)]V + [RER x SRW x (Density ± CI)]H (Eq. 2) Prodleaf = LAR x SLW x (Density ± CI)
where RER is the mean rhizome elongation rate (cm yr-1 shoot-1) of vertical (V) or horizontal (H) shoots, SRW is the mean specific rhizome weight (g dw cm-1) of vertical (V) or horizontal (H) shoots,
LAR is the annual leaf appearance rate (leaves shoot-1 yr-1), SLR is the mean specific leaf weight (g dw leaf-1), and Density is the mean shoot density (shoots m-2) ± its 95% confident interval (CI). Production rates were given as ranges based on the lower and upper CI of the shoot density.
2.3. Indicators of nutrient and particle retention
The nutrient retention service was assessed indirectly using as indicator the nitrogen and phosphorus retained in the seagrass biomass per year (Table 1). In each section of the reservoir, total nitrogen (mg N g-1 dw or % dw) in tissue samples of C. nodosa (n = 3 in each cycle) was determined using a CHN analyser (Elementar, Vario EL III) and total phosphorus (mg P g-1 dw or % dw) was determined colourimetrically (Murphy and Riley 1962) after wet acid digestion (Wheeler and Bjornsater, 1992). The nutrient retention rates (g m-2 yr-1) for N and P were estimated as the sum of the nutrients retained per year in the leaves and rhizomes according to:
(Eq. 3) Nutrient retention rate = (Nut ± CI)rhizomes x Prodrhizomes + (Nut ± CI)leaves x Prodleaves
where Prod (g dw m-2 yr-1) is the range of the production of rhizomes (Eq. 1) or leaves (Eq. 2), Nut is the mean tissue nutrient content (g g-1 dw), either nitrogen or phosphorus, of rhizomes or leaves, ± its 95% confident interval (CI). Thus, nutrient retention rates were given as ranges, accounting with the variation observed in the shoot density (included in variable Prod) and tissue nutrient content. The daily rate of nutrients retention by seagrasses (kg d-1)for the whole reservoir was estimated as
the sum of the products of the nutrient retention rates (g m-2 yr-1) and the seagrass area of each section (m2), applying the corresponding time and mass unit conversions.
The particle retention service was directly quantified as the short-term particle deposition within the seagrass meadow bottom and onto their leaf surface. On three different days, sediment traps (50-mL Falcon® tubes, 30 mm diameter, n = 3) were positioned above the sediment bottom in each section for 2 days. The content of the traps was filtered (GF/F 47-mm), oven-dried (60ºC, 48 h), and combusted (450ºC, 4 h) to determine the mass of the total particulate matter (mg dw TPM) and the organic matter (mg dw POM), and to calculate the depositional rate (mg dw m-2 d-1). The rate of the sediment trapping onto the seagrass leaves was assessed in shoots previously cleaned with a soft sponge (n = 3 per station) which were carefully collected after 2 days (Pluntke and Kozerski, 2003). The particulate matter adhered to the leaves was carefully scrapped and filtered to obtain the total particulate matter and its organic fraction (g dw) using the same method as explained above. The leaf trapping rate (g dw m-2 leaf d-1) was calculated as the retained particulate matter (g dw) in the shoot per unit of leaf area (m2, measured on scanned leaves by image analysis using ImageJ, Schneider et al., 2012) and per unit of time (d). Losses in the deposited particulate matter due to resuspension were neglected because the bed shear stress in the meadow was expected to be high (high seagrass density) and the reservoir is not under the effects of strong currents or waves. The daily total particle retention on the reservoir bottom (kg dw d-1)was estimated as the sum of the product of the daily particle deposition retention rates (mg dw m-2 d-1) (± its 95% confident interval) and the seagrass area of each section (m2), applying the corresponding mass unit conversions.
2.4. Indicators of bacteria control
The service of bacteria control was assessed using as indicators the levels of total marine bacteria,
Escherichia coli, and dissolved organic carbon (DOC) in the donating and receiving ponds at low tide
and at two day-intervals (during daylight and night-time, Table 1). Low tide was chosen to simulate an “incubation” of the water in the reservoir after its entrance from the Ria Formosa as there is no water flow into the reservoir for about 10 h, when the tide level is lower than the tidal gate level. For microbiology, superficial water samples were taken using sterilized flasks (500 mL). Triplicate subsamples (100 μL) were incubated (24º C, 7 d) on plates with tryptic soy agar (TSA, OXOID®) supplemented with 1.5% NaCl to determine total marine bacteria concentration, which was expressed in colony forming units (CFU) mL-1. For determination of E. coli, 500 mL of water was filtered (0.45-µL nitrate cellulose filter) and transferred to a plate with tryptone-bile-X-Glucuronide agar (TBX agar, OXOID®; ISO 9308-1, ISO 2016). Plates were incubated (44º C, 24h) and then blue-green colonies were counted and expressed in units of CFU 100 mL-1. For DOC quantification, 10-mL water
aliquots were in situ filtered (GF/F 47 mm), fixed with 100 μL HCl 2N and frozen in Exetainers® vials for further determination in a total organic carbon analyser (TOC-V, Shimadzu Scientific Instruments).
2.5. Indicators of dissolved oxygen regulation
Dissolved oxygen (DO) regulation service was assessed based on its diel variation in response to the photosynthetic active radiation (PAR), at the receiving and donating ponds (Table 1). A floating platform was moored to continuously monitor temperature, DO concentration (mg L-1) and saturation (%), and PAR (μmol photons m-2 s-1) every 5 min at 30 cm depth from the water surface (above the seagrass canopy), using respectively small self-contained optical sensors (miniDOT, Precision Measurement Engineering; accuracy ± 0.01 mg O2 L-1 and ± 0.1 ºC; in-house certified calibration) and self-contained cylindrical PAR logger (400-700 nm) with a planar cosine-corrected sensor (Odyssey Integrating PAR sensor, Dataflow Systems PTY Limited; calibrated against a LI-192 underwater quantum sensor light meter connected to a logger unit LI-1400). Salinity to correct the OD measurements was determined with a salinometer (VWR CO310) in replicated water aliquots (n = 3) of manually collected water samples at each station every 2-3 h.
The diel cycles in DO were analysed to estimate the rate of DO variation in the water column concentration (mg O2 L-1 h-1) over day intervals with increasing or decreasing trends of DO concentration. The oxygen diffusion from the atmosphere and the subsequent dissolution into the water was neglected as an oxygen source since it is a slow process (Ferrell and Himmelblau, 1967). Thus, we assumed DO rates to be the balance between the photosynthesis and respiration of the seagrass-dominated community. To minimise the effect of the inflowing water from the lagoon, time intervals with the tidal gate open were excluded (about 2 h during each high tide). Water oxygenation service was also as the time during which the DO saturation was maintained above the minimum DO requirements for growth of fish species, which is 60% for autumn (EPPO-IPMA standard protocol).
2.6. Data and statistical analyses
Data is presented as mean ± 1 standard error of the mean (SE) if not otherwise stated. Normality and homoscedasticity of the data were confirmed using Shapiro-Wilk and Levene tests, respectively. When parametric assumptions were not satisfied even after log10-transformation, non-parametric tests were used. Differences in meadow properties (total, AG and BG biomass, shoot density), particle deposition rate, and seagrass nutrient content among the three sections of the water reservoir were analysed using 1-way ANOVA (F) or Kruskal-Wallis rank sum test (χ2) using section as fixed factor.
The tests were followed by Tukey’s or post-hoc Dunn’s comparison test, respectively, when differences among sections were observed. Differences in levels of total marine bacteria, E. coli and DOC were analysed using a negative binomial generalized linear model (z) with a log link function (glm.nb() function of the “MASS” package), with initial full model using station (donating vs receiving) and day interval (daylight vs night) as fixed factors. Final model selection was based on Akaike information criterion (the smaller the AIC, the better the fit) and pairwise comparisons were tested using estimated marginal means with a Bonferroni correction (“emmeans” R package, Lenth, 2019). The rates of increase and decrease of DO concentration in the water reservoir were calculated by fitting a linear mixed-effects models (“lme4” R package, Bates et al. 2015) on the DO concentration data, after visually selecting periods of time in between inflection points of the diel curves (i.e. increase during the day and decrease during the night). The model was constructed with
time (continuous variable), section of the pond (receiving and donating) and interval (increase and
decrease) as fixed factors, and cycle as random factor. In the obtained linear equations for each day interval and pond section, the slope is the estimated rate of DO variation over time (mg L-1 h-1) and the intercept is the initial DO concentration (mg L-1) for that time interval. The comparison of the indicators between the receiving and the donating ponds was used to evaluate the provision the DO regulation and bacteria control services. A critical a level of 0.05 was used for all hypothesis tested. Statistical analyses were done using R programming software (v 3.5.1. R Core Team, 2018). Data are available from authors upon request.
3. Results
3.1. Seagrass characterization
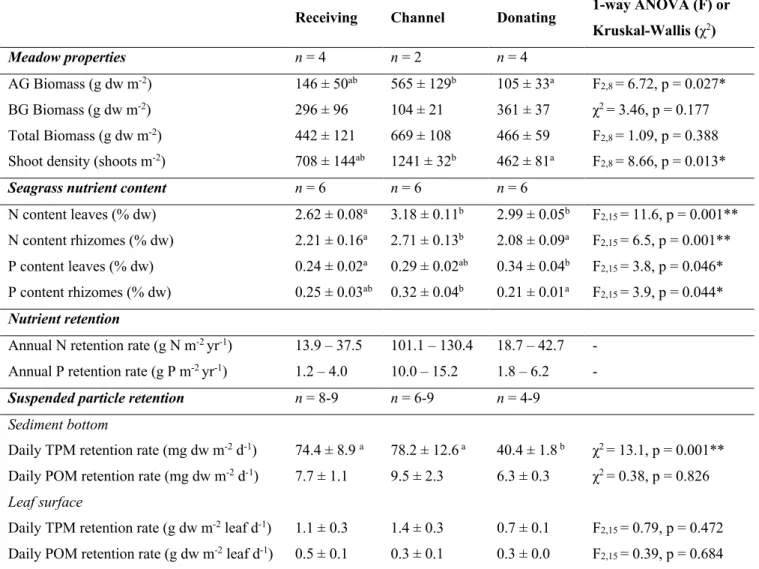
Cymodocea nodosa total biomass and shoot density in the reservoir were higher in the channel (669.0
± 108.3 g dw m-2, 1241 ± 32 shoots m-2) than in the receiving and donating ponds (average: 453.9 ± 62.7 g dw m-2, 585 ± 89 shoots m-2, respectively; Table 2). The vertical rhizome elongation rate varied among the sections: 1.50 ± 0.12 cm year-1 (n = 38 shoots, R2 = 0.81) at the donating pond, 1.70 ± 0.10 cm year-1 (n = 21 shoots, R2 = 0.94) at the receiving pond, and 2.86 ± 0.83 cm year-1 (n = 4 shoots, R2 = 0.86) at the channel. Horizontal rhizome elongation rate also varied among the sections: 28.4 ± 8.0 cm yr-1 (n = 16) in the donating pond, 8.3 ± 11.5 cm yr-1 in the receiving pond. In the channel section, the horizontal rhizome elongation rate was only possible to estimate in one sample, giving a very high value (61.8 cm yr-1).
3.3. Nutrient and particle retention
The nitrogen content of C. nodosa leaves was slightly higher in the channel (3.18 ± 0.11% dw) and donating pond (2.99 ± 0.05% dw) than in the receiving one (2.62 ± 0.08% dw), whereas for the rhizomes it was higher in the channel (2.71 ± 0.13% dw) than in the ponds (Table 2). The phosphorus content of C. nodosa tissues varied slightly among the reservoir sections, and it ranged from 0.24 to 0.34% dw for the leaves and 0.21 to 0.32% dw for the rhizomes (Table 2). The estimated nutrient retention rates ranged from 13.9 to 130.4 g N m-2 yr-1 for nitrogen and from 1.2 to 15.2 g P m-2 yr-1 for phosphorus (Table 2), yielding a daily retention in the whole reservoir of 0.8–1.8 kg N and 0.04– 0.07 kg P.
The total particle deposition rate within the C. nodosa meadows ranged from 40.4 ± 1.8 to 78.2 ± 12.6 mg dw m-2 d-1 and it was, on average, 1.8-time higher in the receiving pond and channel than at the donating pond (Table 2). This difference was driven by the deposition rate of the inorganic fraction, which was 61.9 ± 8.7% in the receiving pond, 68.8 ± 10.4% in the channel, and 34.1 ± 1.9% in the donating pond. The estimated daily total particle deposition in the reservoir bottom ranged from 0.7 to 1.1 kg dw d-1. The rate of particle trapping on the seagrass leaves did not varied along the reservoir sections and it was on average 1.12 ± 0.17 g dw m-2 leaf d-1 (n = 18), with similar fractions of organic (47.5 ± 3.9%) and inorganic (52.5 ± 3.9%) matter.
3.4. Biological control: bacteria and dissolved organic carbon
concentrations
Total marine bacteria concentration in the water reservoir ranged from 0 to 1,510 CFU mL-1.The best model explaining its variation included, as fixed factors, the station (glm: z = 7.3, p < 0.001), the day interval (glm: z = -6.9, p < 0.001), and their interactions (glm: z = -12.8, p < 0.001). Overall, total marine bacteria attained the lowest concentration at night, in particular in the receiving pond (average 816 ± 192 CFU mL-1), while concentrations were higher at daylight, again in the receiving pond (average 1281 ± 96 CFU mL-1; Fig. 2A). The best model explaining the variation of E. coli concentrations in the water reservoir included the day interval (glm: z = 2.02, p < 0.05) and station (glm: z = 3.98, p < 0.001), but not their interaction, as fixed factors. Overall, levels of E. coli ranged from 0 to 14.4 CFU 100 mL-1. On average, E. coli levels were two-fold higher during night than during the day, and it reached higher concentrations in the receiving pond than in the donating one (Fig. 2B). The best model explaining the DOC concentration in the water reservoir only included the day interval as factor, although the DOC did not vary significantly between the day and night (Fig.
2C). Overall, DOC ranged from 0.83 to 1.56 mg L-1, being the average concentration 1.08 ± 0.17 mgL-1 (n = 22).
Table 2. Seagrass (Cymodocea nodosa) meadow properties (total, below-ground BG and
above-ground AG biomass, shoot density), nutrient content (N nitrogen, P phosphorus), and indicators of nutrient and suspended particle retention (TPM total particulate matter, POM particulate organic matter) services in the three sections of the water reservoir. Data are shown as mean ± SE (n = sample size) or in a range. Results of the ANOVA (F) or Kruskal-Wallis (χ2) tests and its statistical significance (p, * < 0.05, ** < 0.01) are given to test differences in the parameters among the three sections. Lettering indicates homogenous groups following post-hoc comparisons.
Receiving Channel Donating 1-way ANOVA (F) or Kruskal-Wallis (χ2) Meadow properties n = 4 n = 2 n = 4 AG Biomass (g dw m-2) 146 ± 50ab 565 ± 129b 105 ± 33a F 2,8 = 6.72, p = 0.027* BG Biomass (g dw m-2) 296 ± 96 104 ± 21 361 ± 37 χ2= 3.46, p = 0.177 Total Biomass (g dw m-2) 442 ± 121 669 ± 108 466 ± 59 F2,8 = 1.09, p = 0.388 Shoot density (shoots m-2) 708 ± 144ab 1241 ± 32b 462 ± 81a F2,8 = 8.66, p = 0.013*
Seagrass nutrient content n = 6 n = 6 n = 6
N content leaves (% dw) 2.62 ± 0.08a 3.18 ± 0.11b 2.99 ± 0.05b F2,15 = 11.6, p = 0.001** N content rhizomes (% dw) 2.21 ± 0.16a 2.71 ± 0.13b 2.08 ± 0.09a F2,15 = 6.5, p = 0.001** P content leaves (% dw) 0.24 ± 0.02a 0.29 ± 0.02ab 0.34 ± 0.04b F2,15 = 3.8, p = 0.046* P content rhizomes (% dw) 0.25 ± 0.03ab 0.32 ± 0.04b 0.21 ± 0.01a F2,15 = 3.9, p = 0.044*
Nutrient retention
Annual N retention rate (g N m-2 yr-1) 13.9 – 37.5 101.1 – 130.4 18.7 – 42.7 - Annual P retention rate (g P m-2 yr-1) 1.2 – 4.0 10.0 – 15.2 1.8 – 6.2 -
Suspended particle retention n = 8-9 n = 6-9 n = 4-9 Sediment bottom
Daily TPM retention rate (mg dw m-2 d-1) 74.4 ± 8.9 a 78.2 ± 12.6 a 40.4 ± 1.8 b χ2= 13.1, p = 0.001** Daily POM retention rate (mg dw m-2 d-1) 7.7 ± 1.1 9.5 ± 2.3 6.3 ± 0.3 χ2= 0.38, p = 0.826 Leaf surface
Daily TPM retention rate (g dw m-2 leaf d-1) 1.1 ± 0.3 1.4 ± 0.3 0.7 ± 0.1 F2,15 = 0.79, p = 0.472 Daily POM retention rate (g dw m-2 leaf d-1) 0.5 ± 0.1 0.3 ± 0.1 0.3 ± 0.0 F2,15 = 0.39, p = 0.684
Fig. 2. Concentration of total marine bacteria (A), Escherichia coli (B) and dissolved organic carbon
(C) of the water reservoir at the receiving and donating pond stations during daylight and night intervals. Statistical summary of the model that best explained the sources of variation (day interval and stations) are shown (model construction with fixed factors included and p value for each of them).
Boxplot bar is median; box is interquartile (IQR) range; whiskers are maximum and minimum values within the 1.5 × IQR of the hinge, dots are outliers, and blue cross is the mean. For interpretation of the references to colour in this figure legend, the reader is referred to the web version of this article.
3.5. Dissolved oxygen regulation
Mean water temperature for the two cycles was 20.9 ± 0.01 ºC (n = 1156, range 19.9–22.2 ºC) and mean daylight PAR was 376.9 ± 13.1 μmol photons m-2 s-1 (n = 532) over a 10.8-h daylight length. The dissolved oxygen (DO) in the water column showed a typical diel cycle in response to the photosynthetically active radiation (PAR) (Fig. 3). The DO peak was reached before sunset (109.9%, 7.89 mg L-1) and started decreasing afterwards, reaching the lowest value before sunrise (70.5%, 5.16
B
Receiving
pond Donatingpond C A E. coli (C F U 1 00 m L -1 ) Dissolved or ganic carbon (mg L -1 ) 1.0 15 0 5 10 To ta l b ac te ri a (10 3 CFU mL -1 ) 0.5 1.5 1.0 0.0
model: day interval*station
Day interval < 0.001 Station < 0.001 Interaction < 0.001
model: day interval
Day interval = ns
model: day interval + station
Day interval < 0.05 Station < 0.01
Day Night
1.4
1.2
Water flow direction
0.8 1.6
mg L-1; Fig. 3). Based on the linear mixed-effects model of DO concentration over time, the rate of DO variation in the reservoir ponds was positive during the daylight and negative at night (Table 3), and the intercepts and slopes were significantly different between ponds and day intervals (Table 4). Within each pond, the rate of DO increase during the daylight was always higher (in absolute values) than at night, meaning that DO production during the daylight is faster than its consumption at night. The rate of variation, either for increase or decrease, was faster in the donating pond than in the receiving pond (0.214 vs 0.157 mg L-1 h-1 for increase; -0.150 vs -0.109 mg L-1 h-1 for decrease) (Tables 3 and 4). The DO saturation in the water reservoir was always above the minimum requirements for aquaculture of 60% (Fig. 3).
Fig. 3. Diel variation in the dissolved oxygen saturation (%) at the receiving and donating ponds of
the water reservoir, with time (hours) referenced to the sunrise. Shadow areas indicate night-time (defined as photosynthetically active radiation < 1 μmol photons m-2 s-1). Dashed line represents the minimum dissolved oxygen (Min OD) required for the optimal conditions of the fishponds (60% in autumn). D is so lv ed o xy ge n s at ur at io n ( % ) Receiving pond Donating pond (cycle 1) (cycle 2)
Time from first sunrise (h) 100 50 20 0 10 Min OD Min OD 100 50
Table 3. Rate of change of dissolved oxygen concentration (DO, mg O2 L-1) over time (t, hours since sunrise) at the receiving and donating ponds, during day and night intervals, based on the linear mixed-effects model. Equations show the estimated rate of DO variation (slope, mg O2 L-1 h-1) and the initial DO concentration (intercept, mg L-1) for each day interval and reservoir pond.
Receiving pond Donating pond Daylight DO = 5.71 + 0.157 t DO = 5.38 + 0.214 t Night DO = 8.22 – 0.109 t DO = 9.02 – 0.150 t
Table 4. Results of the linear mixed-effects model, in which rate of change of dissolved oxygen is
the response variable and time from sunrise, pond section (donating and receiving) and day interval (daylight and night) were included as fixed factors, and tidal cycle as random factor.
Factors Chi Squares Df p-value
Time 1227.1 1 < 0.001
Pond 13.8 1 <0.001
Day interval 3233.9 2 < 0.001
Time – Pond 30.2 1 < 0.001
Time – Day interval 3250.8 2 < 0.001
Pond – Day interval 202.7 2 < 0.001
Time – Pond – Day interval 78.9 2 < 0.001
4. Discussion
The ecosystem services provided by seagrasses in the water reservoir of an aquaculture system were assessed using indicators based on physical, chemical and biological parameters related to the seagrass functions and water quality (Table 1). We showed that a seagrass-dominated system contributed to improve the inflowing water quality of the aquaculture system by retaining particulate matter on their leaves and sediment, and nutrients in their tissues. The water reservoir also benefitted from the seagrass meadows as a natural solution to oxygenate the water during the day, keeping it above the minimum requirements for the optimal growth of cultured animals. This study also showed that diel cycles in seagrass functioning can influence the services they provide if fine temporal scale for the service provision is required.
In the water reservoir of the open aquaculture system, seagrasses removed high quantities of nitrogen and phosphorus. The daily nitrogen retention by seagrass in the water reservoir was estimated to be
0.8–1.8 kg for nitrogen and 0.04–0.07 kg for phosphorus; elements that were removed from the water column as dissolved inorganic and organic nutrients. This nutrient removal is beneficial for aquaculture because excess nutrients can boost algal bloom episodes inside fishponds that eventually create anoxia and lead to deleterious effects to the cultured organisms with severe economical losses to the producer (Shumway, 1990). Furthermore, the seagrasses in the water reservoir showed a great capacity to trap particulate matter, both at the leaf and sediment surface, contributing to reduce the concentration of solids in the water column, thus improving water transparency. The daily trapping of suspended solids, ranging from 0.7 to 1.1 kg dw d-1, is important for aquaculture because suspended solids may cause sub-lethal stress to fish in long exposure periods (Kjelland et al., 2015), and can be associated to parasites causing severe fish diseases (Soares et al., 2018).
Our results showed a clear diel variation in the total marine bacteria and E. coli levels, yet with opposite patterns: E. coli reached the highest levels at night, whereas total bacteria did so during the day (Fig. 2), and levels of DOC lacked a clear spatial or diel pattern. DOC was included as an indicator of biological control because it supports the growth of microorganisms (Zweifel et al., 1993). Diel variations observed in total marine bacteria are similar to those described in Zostera capricorni beds (Moriarty and Pollard, 1982) and for Ria Formosa (Barbosa, 2010). Yet, the increase of total marine bacteria during the day in our study cannot be explained by the DOC levels, unlike in other studies (Moriarty and Pollard, 1982). Indeed, the DOC levels measured in the water reservoir were similar to those usually found in Ria Formosa (Santos et al., 2004).
The diel patterns observed for E. coli concentration can be explained by the fact that these bacteria are sub-lethally injured when exposed to sunlight (Almeida and Soares, 2012; El-Sharkawi et al., 1989; Kapuscinski and Mitchell, 1981). In addition, E. coli growth is inhibited in well-oxygenated environments mainly due to the photodissociation of the oxygen (Gourmelon et al., 1994, 1997), which is the case in the water reservoir during the day due to the photosynthetically-released oxygen by the seagrass-dominated community. A clear spatial pattern was observed along the water reservoir for E. coli, with higher concentrations in the receiving pond where Ria Formosa water enters, and lower concentrations in the donating pond that delivers the water to the fishponds, both during daylight and at night. The probable reason behind this is the biological effect of the seagrasses along the way from the receiving to the donating ponds, because i) E. coli is usually associated with the suspended particulate organic matter (Crabill et al., 1999; Pachepsky and Shelton, 2011), which is removed from the water column by seagrasses; and because ii) seagrasses can release anti-bacteria compounds (Guan et al., 2019; Kannan et al., 2010; Lamb et al., 2017). The seagrass ecosystem service of reducing E. coli concentration along the water reservoir is a major benefit to the fish and
bivalve cultures in the aquaculture ponds by lowering their exposure to pathogenic agents and reducing the health risks of human consumers. This may create a safer area for bivalve production when compared with the E. coli levels in Ria Formosa lagoon. According to monthly analysis of E.
coli in oysters cultured in EPPO-IPMA for the past three years, the level of this bacteria in oysters
has been always under class A, which mean oysters were safe to be directly consumed by humans. This contrasts with the class B of bivalves cultured in the area adjacent to EPPO-IPMA, which demands a depuration period before going to market. From a bivalve farmer standpoint, this can be an economic opportunity since it will give an advantage over tidal culture in Ria Formosa. Further characterization of the marine bacterial community would be useful to explain the effect of seagrasses on fish bacterial pathogens present in the water.
Oxygen is the most important dissolved gas for aquaculture ponds, as it is essential for fish and bivalve respiration. We observed a strong biological effect in the water reservoir over the day. Respiration of the community caused oxygen levels to decrease over the night, with the lowest levels recorded immediately prior to sunrise. This night period is critical for the water quality of the EPPO-IPMA culture ponds, as the minimum oxygen saturation required for the optimal conditions of the fishponds is 60%. During the day the whole reservoir system was autotrophic as the consumption by the heterotrophic community was lower than the photosynthetic oxygen production in the system. Water oxygenation in the seagrass-dominated water reservoir brings benefits to the aquaculture ponds by increasing the DO concentration in the inflowing water during the daylight period, thus reducing the need for mechanical aeration system (paddle wheels). Similar results have been found for macroalgae Ulva species in recirculating systems, with estimates of a 12-fold oxygen production compared to respiration consumption (Guerrero and Cremades, 2012). This benefit will be particularly advantageous in summer, when oxygen solubility in the water decreases and the respiration increases due to high temperature, increasing the chances of anoxia.
5. Conclusions
Our results suggest that the presence of seagrasses in water reservoirs could help overcome water quality challenges in naturally water-fed aquaculture ponds. This study is innovative in the way that nature-based solutions for aquaculture are normally applied on the effluents, but not in the water inflow. We assessed the ecosystem services provided by seagrasses at a spatial and diel scales tailored for the specific needs of an aquaculture activity. In the particular case of these aquaculture systems, the seagrass biomass extraction does not arise as a side-benefit (as it is for macroalgae in integrated aquaculture) due to the absence of market value for seagrasses. However, the cultivation of seagrasses could create opportunity windows such as the offsetting the CO2 emissions of aquaculture systems,
contributing to the environmental sustainability of this industry. Overall, this is an example, yet at a local scale, on how ecosystem services delivered by seagrass meadows can eventually bring benefits to economical activities in coastal areas.
CRediT authorship contribution statement
Carmen B. de los Santos: Methodology, Formal analysis, Investigation, Data curation,
Visualisation, Writing - original draft. Irene Olivé: Conceptualization, Investigation, Methodology, Writing – review and edit. Márcio Moreira: Data curation, Investigation, Writing – review and edit.
André Silva, Cátia Freitas, Ravi Araújo Luna, Hugo Quental-Ferreira, Márcio Martins, Monya M. Costa: Investigation, Writing – review and edit. João Silva, Maria Emilia Cunha, Florbela Soares, Pedro Pousão-Ferreira: Conceptualization, Writing – review and editing, Resources. Rui Santos: Conceptualization, Supervision, Methodology, Funding acquisition, Resources, Writing –
review and editing.
Declaration of Competing Interest
None.
Acknowledgments
This work was supported by the Foundation of Science and Technology of Portugal through projects PTDC/MAR-EST/3223/2014 and UIDB/04326/2020 and through fellowships SFRH/BPD/119344/2016 and SFRH/BD/118601/2016, and was further funded by MAR2020 through project DIVERSIAQUA (MAR202016-02-01-FMP-0066). Authors are thankful to students J. Dupont, Y. Santana, T. Morim, and M. Basto for the help provided for sample collection and processing during their internships in the ALGAE research group of CCMAR. We thank the two anonymous reviewers for their constructive comments and suggestions.
References
Albert, C., Spangenberg, J.H., Schröter, B. (2017). Nature-based solutions: criteria. Nature,
543(7645), 315.
Alexandre, A., Silva, J., Bouma, T.J., Santos, R. (2011). Inorganic nitrogen uptake kinetics and whole-plant nitrogen budget in the seagrass Zostera noltii. Journal of Experimental Marine
Almeida, A.C., Soares, F. (2012). Microbiological monitoring of bivalves from the Ria Formosa lagoon (south coast of Portugal): a 20 years of sanitary survey. Marine Pollution Bulletin, 64, 252-262.
Barbosa, A.B. (2010). Seasonal and interannual variability of planktonic microbes in a mesotidal coastal lagoon (Ria Formosa, SE Portugal): impact of climatic changes and local-human influences. In: Coastal Lagoons: critical habitats of environmental change, Eds.: H. Paerl and M. Kennish, CRC Press, Taylor & Francis Group, Marine Science Book Series, Boca Raton, 335-366 pp. ISBN: 978-1-4200-8830-4.
Bates, D., Maechler, M., Bolker, B., Walker, S. (2015). Fitting linear mixed-effects models using lme4. Journal of Statistical Software, 67(1), 1-48.
Blancheton, J.P., Attramadal, K.J.K., Michaud, L., d’Orbcastel, E.R., Vadstein, O. (2013). Insight into bacterial population in aquaculture systems and its implication. Aquacultural
engineering, 53, 30-39.
Boyd, C.E., Tucker, C.S. (2012). Pond Aquaculture Water Quality Management. Springer Science & Business Media.
Boyd, C.E. (2017). General relationship between water quality and aquaculture performance in Ponds. In Fish Diseases (pp. 147-166). Academic Press.
Chiam, C.K., Sarbatly, R. (2011). Purification of aquacultural water: conventional and new membrane-based techniques. Separation & Purification Reviews, 40(2), 126-160.
Cohen-Shacham, E., Walters, G., Janzen, C., Maginnis, S. (2016). Nature-based solutions to address global societal challenges. IUCN, Gland, Switzerland, 97.
Costanza, R., d'Arge, R., De Groot, R., Farber, S., Grasso, M., Hannon, B., Limburg, K., Naeem, S., O’Neill, R.V., Paruelo, J., Raskin, R. G., Sutton, P., van den Belt, M. (1997). The value of the world's ecosystem services and natural capital. Nature, 387(6630), 253.
Crabill, C., Donald, R., Snelling, J., Foust, R., & Southam, G. (1999). The impact of sediment fecal coliform reservoirs on seasonal water quality in Oak Creek, Arizona. Water Research, 33(9), 2163-2171.
Cunha, A.H., Duarte, C.M. (2005). Population age structure and rhizome growth of Cymodocea
nodosa in the Ria Formosa (southern Portugal). Marine Biology, 146(5), 841-847.
Duarte, C.M., Marbá, N., Agawin, N., Cebrián, J., Enríquez, S., Fortes, M.D., Gallegos, M.E., Merino, M., Olesen, B., Sand-Jensen, K., Uri, J., Vermaat, J. (1994). Reconstruction of
seagrass dynamics: age determination and associated tools for the seagrass ecologist. Marine
Ecology Progress Series, 107, 195-209.
Duarte, C.M., Cebrián, J. (1996). The fate of marine autotrophic production. Limnology and
Oceanography, 41, 1758-1766.
El-Sharkawi, F., El-Attar, L., Abdel Gawad, A., Molazem S. (1989). Some environmental factors affecting survival of fecal pathogens and indicator organisms in seawater. Water Science and
Technology, 21(1), 115-120.
Ferrell, R.T., Himmelblau, D.M. (1967). Diffusion coefficients of nitrogen and oxygen in water.
Journal of Chemical & Engineering Data, 12(1), 111-115.
Gacia, E., Granata, T.C., Duarte, C.M. (1999). An approach to measurement of particle flux and sediment retention within seagrass (Posidonia oceanica) meadows. Aquatic Botany, 65(1), 255-268.
Gourmelon, M., Cillard, J., Pommepuy, M. (1994), Visible light damage to Escherichia coli in seawater: oxidative stress hypothesis. Journal of Applied Bacteriology, 77, 105-112.
Gourmelon, M., Pommepuy, M., Touati, D., Cormier, M. (1997). Survival of Escherichia coli exposed to visible light in seawater: analysis of rpoS-dependent effects. Canadian Journal
of Microbiology, 43(11), 1036-1043
Guan, C., Saha, M., Weinberger, F. (2019). Chemical defence of a seagrass against microfoulers and its seasonal dynamics. Applied Sciences, 9(6), 1258.
Guerrero, S., Cremades, J. (2012). Integrated Multi-Trophic Aquaculture (IMTA): A Sustainable, Pioneering Alternative for Marine Cultures in Galicia. Xunta de Galicia, Pontevedra. (58 pp.).
Haines-Young, R., Potschin, M.B. (2018). Common International Classification of Ecosystem Services (CICES) V5.1 and Guidance on the application of the revised structure. https://cices.eu
Kannan, R.R.R., Arumugam, R., Anantharaman, P. (2010). Antibacterial potential of three seagrasses against human pathogens. Asian Pacific Journal of Tropical Medicine, 2010, 3, 890-893. Kapuscinski, R.B., Mitchell, R. (1981). Solar radiation induces sublethal injury in Escherichia coli
in seawater. Applied and Environmental Microbiology, 41(3), 670-674.
Kjelland, M.E., Woodley, C.M., Swannack, T.M., & Smith, D.L. (2015). A review of the potential effects of suspended sediment on fishes: potential dredging-related physiological, behavioral, and transgenerational implications. Environment Systems and Decisions, 35(3), 334-350.
Lamb, J.B., van de Water, J.A., Bourne, D.G., Altier, C., Hein, M.Y., Fiorenza, E.A., Abu, N., Jompa, J., Harvell, C.D. (2017). Seagrass ecosystems reduce exposure to bacterial pathogens of humans, fishes, and invertebrates. Science, 355(6326), 731-733.
Lemmens, J.W.T.J., Clapin, G., Lavery, P., Cary, J. (1996). Filtering capacity of seagrass meadows and other habitats of Cockburn Sound, Western Australia. Marine Ecology Progress
Series, 143, 187-200.
Lenth, R. (2019). emmeans: Estimated Marginal Means, aka Least-Squares Means. R package version 1.3.3.
Moore, K.A. (2004). Influence of seagrasses on water quality in shallow regions of the lower Chesapeake Bay. Journal of Coastal Research, 162-178.
Moriarty, D.J.W., Pollard, P.C. (1982). Diel variation of bacterial productivity in seagrass (Zostera
capricorni) beds measured by rate of thymidine incorporation into DNA. Marine Biology, 72(2), 165-173.
Murphy, J., Riley, J.P. (1962). A modified single solution method for the determination of phosphate in natural waters. Analytica Chimica Acta, 27, 31-36.
Nordlund, L.M., Jackson, E.L., Nakaoka, M., Samper-Villarreal, J., Beca-Carretero, P., Creed, J.C. (2018). Seagrass ecosystem services–What's next? Marine Pollution Bulletin, 134, 145-151. Pachepsky, Y.A., Shelton, D.R. (2011). Escherichia coli and fecal coliforms in freshwater and estuarine sediments. Critical reviews in environmental science and technology, 41(12), 1067-1110.
Plumb, J.A., Hanson, L.A. (2010). Health Maintenance and Principal Microbial Diseases of Cultured Fishes. John Wiley & Sons.
Pluntke, T., Kozerski, H.P. (2003). Particle trapping on leaves and on the bottom in simulated submerged plant stands. Hydrobiologia, 506(1-3), 575-581.
R Core Team (2018). R: A language and environment for statistical computing. R Foundation for Statistical Computing, Vienna, Austria. URL https://www.R-project.org/
Santos, R., Silva, J., Alexandre, A., Navarro, N., Barrón, C., Duarte, C.M. (2004). Ecosystem metabolism and carbon fluxes of a tidally-dominated coastal lagoon. Estuaries, 27(6), 977-985.
Sandoval-Gil, J., Alexandre, A., Santos, R., Camacho-Ibar, V.F. (2016). Nitrogen uptake and internal recycling in Zostera marina exposed to oyster farming: eelgrass potential as a natural biofilter. Estuaries and Coasts, 39(6), 1694-1708.
Schneider, C.A., Rasband, W.S., Eliceiri, K.W. (2012), NIH Image to ImageJ: 25 years of image analysis, Nature Methods, 9(7), 671-675,
Short, F.T., Short, C.A. (1984). The seagrass filter: purification of estuarine and coastal waters. In The
estuary as a filter (pp. 395-413). Academic Press.
Shumway, S.E. (1990). A review of the effects of algal blooms on shellfish and aquaculture. Journal
of the World Aquaculture Society, 21, 65-104.
Soares, F., Roque, A., Gavaia, P. 2018. Review of principal diseases affecting cultured meagre (Argyrosomus regius). Journal of fish Diseases, 49(4), 1373-1382.
Terrados, J., Duarte, C.M. (2000). Experimental evidence of reduced particle resuspension within a seagrass (Posidonia oceanica L.) meadow. Journal of experimental marine biology and
ecology, 243(1), 45-53.
Wheeler, P.A., Björnsäter, B.R. (1992). Seasonal fluctuations in tissue nitrogen, phosphorus and N:P for five macroalgal species common to the Pacific Northwest coast. Journal of
Phycology, 28(1), 1-6.
Zweifel, U.L., Norrman, B., Hagstrom, A. (1993). Consumption of dissolved organic carbon by marine bacteria and demand for inorganic nutrients. Marine Ecology Progress Series, 101, 23-32.