UNIVERSIDADE TÉCNICA DE LISBOA
Faculdade de Medicina Veterinária
EQUINE CORPUS LUTEUM VASCULAR EVALUATION
BY POWER-DOPPLER ULTRASOUND
TIAGO JOÃO DA SILVA GOMES
CONSTITUIÇÃO DO JÚRI
ORIENTADOR
Presidente
Dr. Jan Govaere Professor Doutor Luís Lopes da Costa
CO-ORIENTADOR
Vogais
Professora Doutora Graça Ferreira-Dias Professora Doutora Graça Ferreira-Dias
Professora Doutora Luísa Leal Mateus Dr. Jan Govaere
2008 LISBOA
UNIVERSIDADE TÉCNICA DE LISBOA
Faculdade de Medicina Veterinária
EQUINE CORPUS LUTEUM VASCULAR EVALUATION
BY POWER-DOPPLER ULTRASOUND
TIAGO JOÃO DA SILVA GOMES
DISSERTAÇÃO DE MESTRADO EM MEDICINA VETERINÁRIA
CONSTITUIÇÃO DO JÚRI
ORIENTADOR
Presidente
Dr. Jan Govaere Professor Doutor Luís Lopes da Costa
CO-ORIENTADOR
Vogais
Professora Doutora Graça Ferreira-Dias Professora Doutora Graça Ferreira-Dias
Professora Doutora Luísa Leal Mateus Dr. Jan Govaere
2008 LISBOA
Acknowledgments
The author would like to thank his family, who always supported him throughout the academic career.
To Professora Doutora Graça Ferreira-Dias, for all the hours that she patiently spent.
To Dr. Jan Govaere, who proposed the subject for this thesis.
To Dr. Nuno Félix who helped correcting the literature review about ultrasonography.
To Professor Doutor Rubens Paes de Arruda from the Reproduction Department of the University of São Paulo for all the knowledge he shared with me.
To Master Maria João Fradinho who always supported me making some necessary contacts.
To my friends of faculty especially to Ana Sofia Dias, Lara Pires, Joana Soeiro, Pedro Frazão and Salvador Falcão.
Abstract
The Doppler ultrasound is an emerging technology that has the potential to increase diagnostic capabilities of equine veterinarians. This technology is based on Doppler-shift frequencies, wherein the ultrasound frequency depends on the movements of red cells inside the vessels.
Corpus luteum (CL) function is dependent on blood supply, which not only provides steroid precursors but also releases progesterone into the systemic circulation. A more sensitive Doppler technique, the Power Doppler mode, was applied to evaluate a possible relationship between CL characteristics and plasma progesterone (P4) concentration. For this purpose, nine (n=9) mares were followed during the early breeding season. Corpus luteum diameter, area, and volume were assessed with B-mode grey ultrasound and vascularisation was evaluated using power Doppler and plasma P4 determination was performed by radioimmunoassay (RIA).
In this study, in disagreement with some previous reports, no relationship was found between the CL cross sectional diameters, areas and volumes with plasma P4 concentrations. The relationship between CL vascularised areas and pixels in the power Doppler images was visually assessed by two trained veterinarians. No colour intensity differences among samples was observed. Therefore, it is unlikely that a relationship between plasma P4 concentration and vascularisation exists in the equine CL.
Resumo
A ecografia com recurso Doppler é uma tecnologia emergente que tem demonstrado ter potencial para melhorar as capacidades de diagnóstico dos veterinários de equinos. Esta tecnologia baseia-se nos príncipios do Doppler, onde as frequências de ultra-som estão dependentes do movimento dos eritrócitos dentro dos vasos sanguíneos.
A função do Corpo Lúteo (CL) está dependente do aporte sanguíneo, o qual fornece não só percursores esteroides mas também permite libertação de progesterona (P4) na circulação sistémica. Desta forma uma técnica Doppler mais sensível, o modo Power Doppler, foi utilizada para avaliar uma possível relação entre as características do Corpo lúteo e a concentração da progesterona plasmática. Para este estudo nove éguas (n=9) foram
seguidas durante o início da estação reprodutiva. O diâmetro, área e volume do Corpo Lúteo foram então obtidos através do modo B, bem como a sua vascularização através do modo Power Doppler.As análises da concentração plasmática de P4 foram feitas com recurso ao rádio-immuno-ensaio (RIA).
No presente estudo, e contrariamente a estudos prévios, nenhuma relação foi encontrada entre o diâmetro, área e volume dos CL avaliados e a concentração de P4 circulante. Uma possível relação entre as áreas vasculares dos CL e dos píxeis obtidos nas imagens power Doppler foi visualmente avaliada. Porem nenhuma diferença na intensidade nos padrões vasculares foi observada, o que poderá indicar que não existe uma relação directa entre a concentração de P4 e a vascularização do CL.
INDEX Acknowledgments ... I Previous note ... 1 Introduction... 2 Literature review ... 4 Ultrasound ... 4
Grey scale ultrasound ... 4
B Mode - Static and Real Time... 4
Doppler ... 5
Physical principles... 6
Transducer... 6
Frequency ... 7
Power... 7
Pulse Repetition Frequency ... 8
Doppler angle... 8 Sample volume ... 8 Pulsed-wave Doppler ... 9 Continuous-wave Doppler ... 9 Wall filters ... 9 Doppler gain... 10 Velocity scale ... 10 Doppler artifacts... 11
Edge and Twinkle artifacts ... 11
Aliasing ... 11
Blooming artifact ... 12
Directional ambiguity ... 12
Partial volume artifact... 12
Pseudo flow ... 13
Flash artifact ... 13
Power Doppler ... 14
Clinical Applications – Human Medicine... 15
Depiction of vessel morphology... 15
Tissue perfusion... 15
Doppler Ultrasound in Equine Reproduction... 17
Colour Doppler ultrasound evaluation of testicular blood flow in stallions ... 17
Colour Doppler evaluation of the Arteria uterina in mares ... 18
The Uterine Index... 19
Colour Doppler for follicular development and ovulation predicting... 19
Power Doppler quantification ... 20
Estrous cycle in mares ... 22
Corpus haemorragicum... 23
Corpus albicans ... 23
Corpus luteum functions... 24
Luteal insufficiency... 24
Corpus luteum formation ... 25
CL Morphology... 25
Local control mechanisms ... 26
Corpus luteum evaluation and imaging ... 35
Assessing corpus luteum vascularisation ... 38
Materials and methods ... 39
Animals ... 39 Ultrasonography... 39 Progesterone assay ... 39 Statistical analyses... 40 Results... 41 Discussion... 43
Conclusion ... 44
Bibliography... 45
Annexes... 57
Figure index Fig 1- Pseudoflow in liver... 13
Fig 2 - Flash artifact ... 14
Fig 3- Images of 2 CL from a 48-day pregnant mare shown in color-flow mode ... 17
Fig 4 - Power Doppler ultrasound image of central vein and small intratesticular vessels .... 18
Fig 5 - Ultrasound color power Doppler images21 Fig 6 - Ultrasound of a CH few hours after ovulation; ... 36
Fig 7 -Corpus luteum in gray-scale ultrasound (Aloka500) ... 36
Fig 8 -- Formation of two CL after double ovulation;... 37
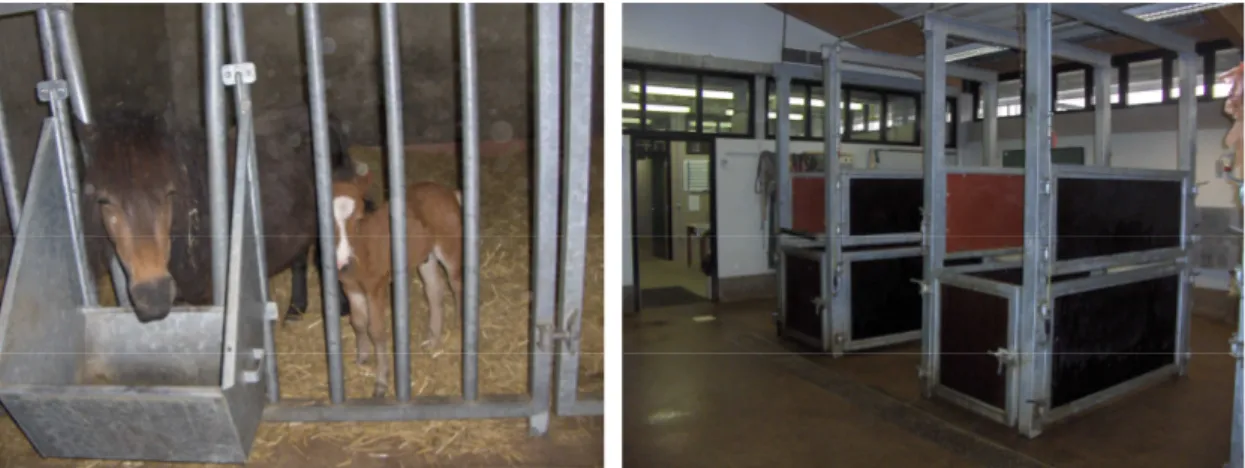
Fig 9 and 10- Stables and examination room at Ghent faculty; ... 40
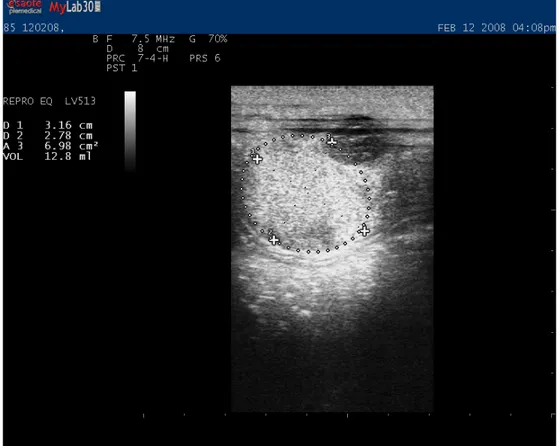
Fig 11 – CL measurements;... 57
Graph index Graph 1 - Relationship between the cross diameters (D1, D2) (cm) and P4 (ng/ml) production... 41
Graph 2 - Relationship between the area of CL (cm2) and P4 (ng/mL) production... 42
Previous note
During the last year in the Integrated Masters Degree of the Veterinary Medicine Faculty, it has been required to do a thesis based on the students final practical training. This practical period is of extreme importance, since the students acquire more practical experience and contacts with the extramural reality.
In this case, the author joined an Erasmus student program for 4 months (September-December 2007), which took place at the Large Animals Clinic Hospital from the faculty of Ghent- Belgium. Upon students arrival they are integrated in a scheme of rotation among departments of that hospital. Thus, the training included two weeks at the Reception department, two weeks at the Surgery department, two weeks at Internal Medicine, two weeks in Reproduction and Obstetrics, and four weeks in the Ambulatory clinic department. At the Reception department, in most cases, lameness evaluations were performed and some neurological disorders were also diagnosed. Usually, the lameness cases were of difficult diagnosis and other veterinarians working outside the faculty referred them. The imagiology department functioned as a support of this department. In the Surgery department several surgeries were followed, which comprised, arthroscopies, orthopaedic surgeries, colic surgeries and others. At the Internal Medicine department the most of the cases followed were colics, but other gastrointestinal, respiratory and disorders of other systems were observed. There was a close relationship between that department and Surgery, since some of the colic cases were conducted at the surgery room. At the ambulatory clinic the most frequent cases were cattle clinic, where the caesarean sections were very prevalent. At the Reproduction department the students performed daily practices of rectal palpation and ultrasound scanning on cows and mares. Some cases of gemelar pregnancy reduction were followed. During the stay at the Reproduction and Obstetrics department it had been proposed to the author the subject of this thesis. Therefore, the practical part of this work was carried out at that department with the supervision of the assistants of the department.
Another part of the training was performed for five months (February-July 2008) at the Reproduction Department of the University of São Paulo, Brazil. During this period, stallion reproductive assessment was done, which included semen collection and evaluation. Other laboratory routines were followed such as the use of fluorescent probes for semen evaluation. Outside the faculty, the routine of two private reproduction centers was also followed. At those centers semen collection, mare breeding management, artificial insemination, embryo transfer and some neonatology cares were performed by the author.
Introduction
In the last decades the interest in horse breeding has increased. With the raise in the economical value of some horses, which are used for sport shows or only for amateur purposes, the assistance on their reproduction has become very important in the equine practice. Most of the reproduction interventions in horses are reserved to veterinary practice, and in the most of the cases they work with high quality animals, which represent an important genetical patrimony that has to be preserved. Some owners are willing to invest large amounts of money to get progenies from those animals, increasing the responsibility of the veterinary, which needs to apply the most recent technologies to answer the demands of the market.
During the last years we have witnessed an explosion in new reproductive technologies. Some of those technologies have already become routine of the breeding industry, while others will be used more slowly in the breeding industry and some may never be used.
Nowadays, assisted reproduction techniques of potential clinical use in the horse include embryo transfer (ET), oocyte transfer (OT), gamete intrafallopian transfer (GIFT), in vitro fertilization (IVF), intracytoplasmatic sperm injection (ICSI) and nuclear transfer (NT). However, only the embryo transfer is currently performed in the horse practice (Hinrich & Choi, 2005).
How quickly these technologies are accepted and utilized in the equine breeding industry depends upon the success of the technology, the attitude of the breeders and veterinarians, and the cost compared with the benefit of the technology.
Since the introduction of ultrasonography to the equine veterinary field in the early 1980’s, its use as a diagnostic tool has expanded dramatically. Initially it was strictly used for pregnancy detection. However, nowadays, other applications in reproduction include: monitoring follicular changes and predicting ovulation; confirmation of ovulation and evaluation of the corpus luteum morphology, estimating the stage of the oestrous cycle, diagnosing ovarian irregularities and pathology; detection of twins and embryo reduction, determining embryonic death, evaluation of uterine pathology and evaluation of the testes and accessory glands in stallions (Squires, McKinnon, Shideler, 1988).
Doppler ultrasound technique revolutionized the ultrasound diagnosis and it is commonly used on echocardiography, abdominal exam, and depiction of some neoplasia based on characteristic vascular patterns. This technique is frequently used on assisted reproduction programs since ultrasound parameters of the endometrium and the evaluation of uterine and endometrial blood flow has long been considered as implantation markers in in vitro fertilization (IVF) and embryo transfer protocols in women (Borini et al., 2004; Miyazaki et al.,
1998). In the equine reproduction some applications of these mode are already available (Ginther & Utt, 2004).
The Corpus luteum (CL) is a transient endocrine gland, which develops from the follicular cells that remain after ovulation. This gland is required for the establishment and maintenance of pregnancy, since it is the major source of progesterone during the early pregnancy (Webb, Woad, Armstrong, 2002). Luteal insuffiency has been pointed as a cause in embryonic loss in other species as cows, nevertheless, in the mare it is not clear if a deficiency in luteal development or progesterone production can result in reduced fertility (Allen, 2001).
It has been shown, in studies on ewes, that blood flow to the luteal ovary increased during diestrus and then decreased dramatically at the end of the luteal phase; the decrease in the volume of luteal capillaries coincided with the decrease in blood flow to the CL
(Knickerbocker, Wiltbank, Niswender, 1988).
A correlation between cyclic changes of the luteal blood flow and progesterone levels on plasma, have been found, using invasive methods, in other species (Brown, Emery, Mattner, 1980). Relationships between the morphoechogenicity and progesterone concentrations have already been made with conventional gray-scale ultrasound in heifers (Kastelic, Bergfelt, Ginther, 1990) and in mares (Bergfelt & Ginther, 1996; Arruda et al., 2001).
The power Doppler is a more sensitive display to evaluate the small vessel perfusion (Rubin
et al., 1994), which characterises the CL vasculature. For several years, colour and power
Doppler sonography have been used in human medicine to examine blood circulation of the CL, establishing a possible relationship between an insufficient blood perfusion of the CL and luteal phase impairment in women (Miyazaki et al., 1998). Recently the power Doppler display has been applied for the CL evaluation in the mare (Bollwein, Mayer, Weber, Stolla, 2001) and its relationship with progesterone production has already been evaluated (Ginther, Gastal, Gastal, Utt, Beg, 2007).
The aims of this study were to evaluate a possible relation between: a) the measurements of luteal tissue: diameter, area and volume; b) the power Doppler ultrasound characteristics of luteal tissue in mares and the progesterone production of that luteal tissue.
Literature review
1.1 Ultrasound
Ultrasonography was introduced in the equine veterinary field in the early 1980’s (Squires, McKinnon, Shideler, 1988). Some authors consider that gray-scale diagnostic ultrasonography is the most profound technological advance in the field of large-animal research and clinical reproduction since the introduction of the transrectal palpation and radioimmunoassay of circulating hormones (Ginther, 1986).
1.1.1 Grey scale ultrasound
In grey-scale ultrasound the amplitude of the returning echoes is displayed in form of grey images of variable brightness, which are determined by the manufacturer and cannot be changed by the operator (Reef, 1998). A lower grey scale occurs when penetration depth is increased. If available, a larger grey scale to assign the reflected ultrasound waves, it will conduce to a better tissue characterization of the image (Kremkau, 1993).
1.1.2 B Mode - Static and Real Time
The brightness mode, B-mode, is a two-dimension (2D) display of the returning echoes. The amplitude of the returning echo is converted into a dot with a characteristic brightness representing that returning echo (Reef, 1998), the brighter the dot, the stronger the corresponding echo. In this mode the location of the dot corresponds to the location of the echo reflector within the tissue cross-section (Reef, 1998). The B mode ultrasonography produces an image that corresponds to a cross section of the tissue within the plane scanned. This cross-section may be formed in the form of a single frozen image (static B mode), or be formed by the sum of numerous acquired frames to be displayed within one second (real time B mode).
Some post-producing methods may enhance the quality of the information that is obtained by ultrasound (US). For example, frame averaging, is a method that can improve ultrasound image resolution, performing by temporary storage of a part of the previous image, and to which is added a new image. For static structures, frame averaging can add additional echoes and increase the line density, thus improving image resolution. Other post- image producing processes can change the image brightness since the image is stored in memory (Reef, 1998).
Write magnification is a pre-processing function in which the image is magnified. However in this method the pixel size remains small. In contrast in read magnification, the image is magnified only after it has been frozen or stored in memory. The latter will result in a magnification of the pixels (Reef, 1998).
The frame rate is the number of frames displayed per second. The density of the obtained image is highest when a low frame rate is used, thus producing a higher-quality image. However, high frame rates are needed to visualize motion in real time, with the highest frame rates being used for structures that are moving very rapidly. For example in ultrasound of highly moving structures, such as echocardiography, frame rates must be high. Unfortunately to obtain this high frame rate some detail in image resolution will be lost (Reef, 1991). In contrast for scanning static structures, a low frame rate will be ideal to obtain the highest possible - image resolution. Frame rate can also decrease in other structures such as when tissue penetration increases, when wide angles for image visualization are used, or when the number of focus points increases (Kremkau, 1993).
1.1.3 Doppler
Thirty years ago, the use of Doppler ultrasound was limited to the vascular laboratory and mainly to evaluate the carotid arteries (Rubens, Bhatt, Nedelka, Cullinan, 2006). The basic physical principles that made Doppler blood flow measurement possible have been understood since World War II. Since then physicists and engineers have continued to improve Doppler ultrasound instrumentation, allowing clinicians to make accurate diagnoses of cardiovascular diseases (Taylor & Holland, 1990).
Nowadays, Doppler US is used in all areas of diagnostic US imaging, and extensively in abdominal, pelvic and obstetric imaging (Rubens et al., 2006). Although Doppler is commonly used to measure blood flow, any tissue or fluid motion may generate a Doppler signal (Rubens et al., 2006).
The Doppler-shift frequency, or Doppler frequency, is defined as the difference between the frequency of the transmitted ultrasound waves and the frequency of the received echoes (Ginther & Utt, 2004). The greatest difference or strongest signal is achieved when the motion is parallel to the US beam. In opposite, no signal is generated when the motion is perpendicular to it (Rubens at al, 2006).
1.1.4 Physical principles
In 1842, Christian Doppler published the theory that the frequency of a wave changes between a moving wave source and target. Based on the shift of the sound frequency of a moving train, a stationary listener can decide whether a train is approaching or receding. With an approaching train the sound becomes louder as it approaches (positive Doppler shift) (Lang, 2006).
The shift frequency, that characterises the Doppler effect, can be obtained by the following equation 1:
where fD is the Doppler frequency shift, f0 is the incident frequency, υ is the flow velocity, c is the speed of sound in tissue, and θ is the angle between the ultrasound beam and the flow direction. The equation can only be applied when the frequency of an ultrasound echo from a moving reflector or scattered differs from the frequency of the original sound wave. The Doppler shift frequency (fD) will depend on the velocity of the reflector and its direction, if and only we assume that the frequency and sound velocity are constant for that specific measurement (Taylor & Holland, 1990).
In Doppler ultrasound we can distinguish the spectral mode, which comprises the pulsed and continuous wave mode, and the colour mode, which includes the Power mode. For medical imaging two types of Doppler ultrasound are commonly used: pulsed-wave and continuous-wave Doppler. However Colour-flow Doppler is now extensively used for echocardiography and abdominal imaging. Power Doppler consists in a more recent development and is used mainly in abdominal or small-part imaging where low blood velocities are encountered (Lang, 2006).
1.1.5 Transducer
The appropriate selection of a transducer depends on the structure that will be evaluated, the depth of the area to be scanned to the transducer surface and on the acoustic tissue characteristics (Reef, 1998).
Transrectal transducers were one of the first US transducers to be used on Veterinary Medicine, to scan the female reproductive tract from the rectum. These transducers are, normally characterized by having a cigar shape and a beam originating at a 90 degrees angle from the long axis of the transducer (Reef, 1998).
Linear-array or convex-array transducers are most commonly used for transrectal Doppler imaging in horses. The linear-array transducer displays a rectangular image and is particularly useful for visualizing a large structure close to the transducer in one single image (Ginther & Utt, 2004). These transducers allow for the evaluation of the female and male inner reproductive tract, but also of the aorta, iliac arteries, bladder, urethra, cranial mesenteric artery, peri-rectal masses, and portions of the gastrointestinal tract (Reef, 1998). The most important disadvantage of these transducers is the fact that they have to be placed directly over the evaluated area, since the penetration depth is normally limited (Reef, 1998). The convex-array transducer produces a pie-shaped image (narrowest at the transducer) and may be smaller (finger-grip probe) and easier to manipulate and orientate within the confines of the rectum (Ginther & Utt, 2004).
1.1.6 Frequency
The frequency is the number of cycles or complete variations of the US beam per unit of time. It is expressed in mega-hertz (Reef, 1998). The frequency of ultrasound waves can be fixed (for single-frequency transducers) or controlled by the operator (in multi frequency transducers).
To a higher frequency corresponds a shorter wavelength. This represents the distance travelled by US during one cycle. A shorter wavelength also corresponds to an image with higher resolution (Reef, 1998).
Higher frequencies are much more sensitive to flow but cannot penetrate deep enough without suffering attenuation. As a consequence in superficial structures such as the testes, a frequency of 7 to 10 MHz will be ideal, whereas for deep abdominal structures, such as the hepatic arteries or portal vein, a 3 MHz or even a lower frequency will be needed (Rubens, 2006). A high frequency is more attenuated than the low-frequency sound wave, which limits the depth of tissue that US beam can penetrate (Kremkau, 1993).
1.1.7 Power
The acoustic power, output power, or drive voltage amplitude in some models, is the power or energy of US waves emitted from the transducer. This is a variable that can be controlled by the operator. Increasing the power will enable that weaker signals can be detected (Ginther & Utt, 2004). Increasing the power also increases the intensity of US energy delivered to tissues. However an optimal image quality is obtained when the lowest power
setting is used for the exam area, as the high-power settings result in more artifacts. (Reef, 1998)
1.1.8 Pulse Repetition Frequency
The interval between pulses is called pulse repetition frequency (PRF). This can be controlled by the operator, which can select the range of velocities to be sampled (Reef, 1998). A high PRF setting is used when the targeted vessels are near the transducer or when there is high blood flow. Conversely a low PRF setting is used when vessels are situated far from the transducer or the blood flow is slow (Ginther & Utt, 2004).
1.1.9 Doppler angle
Unlike grey scale US imaging, whereby the best image is obtained perpendicular to the US beam, in Doppler the strongest signals result when the motion is parallel to the beam. A Doppler angle of 90º will not display flow because no frequency shift is directed back towards the transducer (Rubens et al., 2006). In fact as is depicted in the equation 1, when the ultrasound beam is at right angles to the vessel (cos90º=0), the Doppler shift frequency is theoretically zero and no signal will be obtained (Taylor & Holland, 1990).
The larger the Doppler angle, the greater the correction that needs to be done and the greater the possibility of error. Therefore, Doppler beam angle must always be kept as low as possible. Ideally, it should be less than 60º and always less than 70º because the percentage of errors obtained by poor angle correlation can increase up to 20% to 30% with higher Doppler angles (Zweibel & Pellerito, 2005). When the transducer is aligned with vessel (cos 0º=1), the largest Doppler shift will be obtained and angle uncertainty has its least effect. However, there may be technical difficulties in obtaining signals at such low angles because of total reflection of sound waves at the vessel walls (Taylor and Holland, 1990).
1.1.10 Sample volume
The sample volume is the three-dimensional space from which the Doppler frequency shifts are measured. In colour or power Doppler it is the colour box, and in pulsed wave Doppler it is indicated by the cursor, which is placed within the vessel (Rubens et al., 2006). In most systems, its dimensions are adjustable and depend on the focusing characteristics of the transducer and the number of cycles within the pulse, which determines the axial resolution (Taylor and Holland, 1990). Signals can be sampled and displayed from unwanted areas of a vessel or even from unwanted vessels such as adjacent arteries or veins. The ideal sample volume size for performing a routine survey of a vessel consists in about two thirds of the vessel width, if positioned in the center of the vessel width (Zweibel & Pellerito, 2005) and
excluding the unwanted clutter from near the vessel walls as much as possible (Merrit, 2004).
1.1.11 Pulsed-wave Doppler
The principles of pulsed-wave Doppler are similar to B-mode imaging, where sound is transmitted in short pulses and received by the same crystal during the time interval between emissions of pulses (Lang, 2006). By setting the sample volume in a vessel at a specific depth, the returning echoes from this vessel will arrive at a specific time interval. This time interval corresponds to the depth of the vessel (range gating), allowing the blood flow of a specific vessel to be measured. In this method, the location of a flow pattern can be precisely determined. The size of the gate is usually called the sample volume and can be adapted accordingly to vessel size. In this technique only one crystal is used to transmit and receive sound and so the depth of pulsed-wave Doppler, as the measurable obtained velocities, are limited. In order to measure blood flow velocity correctly, the pulse repetition frequency must be twice the highest frequency of returned echoes (which is known as the Nyquist limit). When the Nyquist limit is exceeded, an artifact known as aliasing occurs, making accurate interpretation of the flow velocity impossible. Simply stating aliasing occurs when the pulse repetition frequency is too low, when there is high flow velocity (e.g.: large vessels) or when the sample depth is too great. In these cases it will be necessary to change to continuous-wave Doppler ultrasound to obtain accurate measurements.
1.1.12 Continuous-wave Doppler
In this technique, the ultrasound is transmitted and received continuously. The transducer contains two different types of crystals, one that transmits and one that receives sound. The sound waves can therefore be received continuously and so continuous-wave Doppler can be used for evaluation of very high velocities (Lang, 2006).
1.1.13 Wall filters
Unwanted Doppler signals from large moving structures can often be avoided by consulting the US image obtained with duplex and colour Doppler systems, and by cutting-of the low frequency noises (Reef, 1998). However, Doppler shifted ultrasound echoes from vessel walls are more problematic, since they typically lie in the region of interest (Taylor and Holland, 1990).
The Doppler frequency shift can be detected from moving blood vessel walls and from the blood itself. The wall echoes have large amplitude, which causes a loud “wall thump” on the
audio Doppler output (Taylor and Holland, 1990). These signals have low frequency and can be cutted by using a higher threshold, obtaining a cleaner high-velocity blood-flow signal. However if the wall filter threshold is set too high, true blood flow can also be discarded from the display. Low velocity venous flow and the filter for venous Doppler should be kept at the lowest practical level, usually 50 to 100 Hz or less (Merrit; 2004)
1.1.14 Doppler gain
This setting controls the amplitude of the colour display in colour or power Doppler and spectral display in pulse Doppler mode (Rubens et al., 2006). To adjust Doppler gain for colour imaging, the former should be turned up until the image of scattered isolated colour pixels can be seen overlying the grey-scale background. At this moment the gain should then be decreased until it disappears.
If the colour gain settings are set too low, flow will be present but not detected. If settings are set too high, colour or power signals may overwrite grey-scale clot. A machine setting related with the gain for colour and power Doppler is the colour-write priority, which determines whether a given pixel is written as a grey-scale value or as colour (Zweibel & Pellerito, 2005). If the grey-scale signal is above some threshold, the pixel remains grey. If the signal is below the threshold, the pixel is displayed as coloured. If the grey-scale gain is too high or the colour-write priority too low, some colour pixels may not be displayed as well (Rubens et al., 2006)
1.1.15 Velocity scale
The velocity scale controls the range of frequencies that is displayed and it is a critical setting in colour and spectral Doppler imaging. If the scale is set too high, the dynamic range is too large and low velocity signals will be missed, particularly those obtained from low flow vessels. If the velocity scale is set too low, the dynamic range is too small to display the high-velocity signals accurately and the artefact of aliasing will occult (Rubens et al., 2006). So this setting should be adjusted to the structure characteristics that have to be evaluated.
1.2 Doppler artifacts
Artifacts are common on colour Doppler images as well as in B-mode images (Ginther& Utt, 2004; Rubens et al., 2006). The Doppler instrument is sensitive not only to the movement of red cells but also to extraneous movements or clutter as well, such as the case of tissues or animal movements. This will lead to colour or flash artifacts, which can be extensive and obscure the colour displays in the colour mode.
These artifacts can be grouped into three broad categories:
1. artifacts caused by technical limitations, including aliasing, improper angle with no flow, indeterminate Doppler angle, blooming, and partial volume artifacts; 2. artifacts caused by patient anatomy, including mirror image artifact, flash
artifact, an pseudo flow;
3. artifacts caused by machine factors, including edge artifact and twinkle artifact.
1.2.1 Edge and Twinkle artifacts
The edge artifact may be generated by any echogenic surface, and it refers to the Doppler signal generated at the margin of a strong, smooth, specular reflector (Reef, 1998). This artifact is more commonly seen with Power Doppler US since a large dynamic range is used (Reef, 1998).
The twinkle artifact is defined as a colour Doppler signal that imitates flow behind a stationary reflecting interface such as a renal calculi or bladder calcification (Reef, 1998).
1.2.2 Aliasing
Aliasing is a common artifact of the Doppler spectrum. Basically, aliasing occurs when the velocity range of the scanned sample exceeds the scale available to display it. The maximum velocity scale is limited by the number of US pulses per second that can be transmitted and received by the transducer and depends on the transducer used. The PRF setting requires a scale that must be, at least, twice the frequency of the Doppler signal (Zagszebski, 2000). In practical, the display “wraps around” the scale and overwrites the existing data.
There are several solutions to avoid spectral aliasing. The first one includes to drop the baseline or to increase the velocity scale (PRF) and/ or to increase the available velocity range. If the scale is still inadequate, the Doppler frequency shift can be decreased by using a lower frequency or by increasing the Doppler angle (Taylor and Holland; 1990). Although increasing the PRF decreases aliasing, this will imply less ability to detect a slow flow. The opposite is also true: a low PRF results in better detection of slow-moving flow but also
increases the likelihood of aliasing (Ginther & Utt; 2004). Power Doppler, on the contrary, has no aliasing because it has no directional or velocity component (Rubens et al., 2006).
1.2.3 Blooming artifact
This artifact is also known as “colour bleed”, because the colour spreads out from the vessel and “bleeds” beyond the wall into adjacent areas. This artifact is created because colour US image is actually constructed from two images superimposed, the colour and the grey-scale. Thus, depending on how the parameters are set, the colour portion of the image can extend beyond the grey-scale vessel margin (Nilsson, 2001). The unwanted result is that the subject to be scanned within the vessel can be “ written over” and obscured (Forsberg, Liu & Burns 1994).
B-flow, an alternative US-based blood flow detection method, can be useful when colour imaging is problematic (Weskott, 2000).
1.2.4 Directional ambiguity
Directional ambiguity, or indeterminate flow direction, is a term that refers to an artifact that occurs with spectral Doppler tracing where its waveform is displayed with nearly equal amplitude above and below the baseline, creating a mirror image pattern. This pattern results when the interrogating beam intercepts the vessel at a 90º angle (Pozniak, Zagzebski & Scanlan; 1992). This artifact is most commonly seen in small vessels, especially in those travelling in and out of the imaging plane (Rubens et al., 2006), and it may be corrected by changing the angle of the interrogating beam.
1.2.5 Partial volume artifact
Partial volume artifact results from a slice thickness, which is not thin enough to be entirely included on the plane that has to be scanned. Echoes and Doppler signals can be obtained from objects, partly from within the slice and partly from outside of it (Goldstein & Madrazo; 1981). So, this artifact creates echoes that on the display appear like curved, fluid-filled structures such as anechoic vessels or ducts, which in reality are not existent (Kremkau & Taylor; 1986). These echoes can also mimic dependent particulate material, which in turn can be misinterpreted as thrombus, debris, or sludge. These echoes can appear within anechoic structures and Doppler signals are acquired in an area in which no vessels are perceived on grey-scale.
1.2.6 Pseudo flow
Pseudo flow is defined as presence of movement of fluid other than blood (Campbell, 2004). Pseudo flow can mimic real blood flow with colour and Power Doppler. The difference is that there are not any true existing vessels. Examples of pseudo flow include ascites, amniotic fluid and urine (Rubens et al., 2006).
Fig 1- Pseudo flow in liver.
1.2.7 Flash artifact
Flash artifact is a sudden burst of random colour that fills the frame, obscuring the grey-scale image. This artifact can be caused by object motion or transducer motion (Campbell, 2004). Power Doppler is more susceptible to flash artifacts than colour flow Doppler because of the longer time required to build the image. This occurs because more frames are averaged together to create the image in power Doppler compared to standard colour Doppler (Zagzebski, 2000).
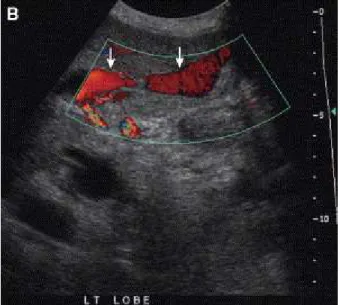
Fig 2 - Flash artifact. (A) Longitudinal CDUS through the left lobe of the liver with flash artifact, produced by respiratory motion. Longitudinal CDSU with no motion shows normal vascular flow with no artifact. (Adapted from Rubens et al., 2006)
1.3 Power Doppler
Power Doppler is a colour Doppler mode in which an estimate of the total integrated Doppler power spectrum rather than just a single estimate of the mean frequency is displayed on the frame. This will give power Doppler an increased sensivity to low-flow states (Rubin, Bude, Carson, Bree & Adler, 1994; Reef, 1998). In this mode the shade and brightness of the colour signal represent the total energy of the Doppler signal (Rubin et al., 1994).
The main advantage that power Doppler ultrasound has over normal colour Doppler is that increased gain settings can be employed (Rubin et al., 1994).
In colour Doppler, noise appears in the form of white images and can result from a flow of any frequency shift. If the gain is set too high, the random background of noise quickly obscures the flow signal, and will then itself be displayed as flow. In power Doppler, because the noise consists in echoes of uniformly low power, it will be displayed as a background of uniform appearance. Consequently it is much easier to perceive the real flow in Power Doppler (Bude & Rubin, 1996).
Power Doppler Ultrasound is also less angle dependent than the colour Doppler US (Rubin
et al., 1994; Bude & Rubin, 1996). As the Power Doppler technique does not imply the need
of any frequency, velocity or directional information, the aliasing artifact will not affect it (Bude & Rubin, 1996).
The Power Doppler technique increase the sensitivity for displaying blood flow in soft tissue, 3 to 5 times than conventional colour display for Doppler sonography (Rubin et al., 1994; Amso, Watermeyer, O’Brien & D’Angelo 2001). This greater sensitivity also allows for the
evaluation of vessels with smaller diameters or slower flow than what is currently possible with conventional colour-flow images. It can also provide a better definition of tortuous vessels (Martinoli et al., 1998)
However, power Doppler does have some disadvantages compared to colour Doppler. One disadvantage is the increased susceptibility of Power Doppler to display flash artifacts, which if excessive might preclude its use (Bude and Rubin, 1996; Rubens et al., 2006). Another disadvantage is its lack of directional or velocity flow information (Bude and Rubin, 1996).
1.4 Clinical Applications – Human Medicine
Due to the increased sensitivity to depict the continuity of blood flow and the improved definition of intravascular edge, Power Doppler technique shows significant advantages over Colour Doppler (Martinolli et al., 1998).
1.4.1 Depiction of vessel morphology
In large arteries, PD was shown to enhance luminal measurements accuracy in high-grade stenosis due to complex plaque composition and calcification, and to contain the ability to differentiate plaque surface morphology (Steinke, Meairs, Ries & Hennerici, 1996). In this area of investigation, intrinsic limitations of CD consist in its inability to visualize the residual lumen in high-grade stenosis, as well as the tendency to the noise to overwhelm the flow signal, which may result in an over or underestimation of stenosis (Steinke et al., 1996).
Also, in venous system, the ability of PD in differentiating a slow versus an absent flow can improve diagnostic accuracy in detecting blood clots (Babcock, Patriquin, LaFortune & Dauzat, 1996). In abdominal veins, PD has also been shown to provide a better description of the cavernous transformation of the portal vein and to increases the delineation of floating thrombus (Martinoli et al., 1998).
1.4.2 Tissue perfusion
The improved detection of tissue vasculature has some potential benefits especially in the fields where CD is not sensitive enough to detect clinically important, slow, low-volume flows in small vessels (Martinoli et al., 1998). For most cases, PD will make the intraparenchymal vasculature visible as a subtle network of small discrete vessels.
Power Doppler has also been proposed as a mean to evaluate conditions that will alter blood flow distribution on the renal cortex, such as focal inflammatory regions, abscesses and
tumours. It can also be used in conditions, which result in a markedly decreased or absent renal cortical vascularity, and to detect small renal tumours (Bude, Rubin & Adler; 1994).
PD has also been used to evaluate testicular perfusion. The most important clinical condition where imaging testicular flow can be beneficial is to differentiate testicular torsion from epididymiditis-orchitis. It was shown that Colour Doppler is an efficient method in the evaluation of the acute inflamed scrotum. However, some investigators reported that intratesticular flow can be detected more sensitively with Power Doppler (Bader, Kammerhuber & Herneth; 1997).
Colour Doppler ultrasound studies have yielded new information on uterine blood circulation during the menstrual cycle in women (Kurjak et al., 1995). Uterine arterial blood flow can now be used to predict a hostile uterine environment prior to embryo transfer (Steer et al., 1992).
Avascular necrosis of the femoral head still remains a possible complication from treatment to hip dysplasia and specially when positional abduction restrains are used. Power Doppler enabled to depict vessels within the cartilaginous femoral head in some studies (Bearcrof, Berman, Robinson & Butler; 1996).
Although there is susceptibility of Power Doppler to display artifacts caused by some physiological movements, such as intestinal peristaltic contractions, it has been used with success to distinguish viable from non-viable bowels, in patients with focal thickening of the gut wall (Clautice-Engle, Jeffrey, Li, & Barth, 1996).
With its enhanced sensitivity, Power Doppler is also valuable for detecting increased blood flow in vessels that are dilated as a consequence of an inflammatory response. In fact, some studies reported that in these situations PD often shows a diffuse blush in acutely inflamed tissues (Stavros, Rapp & Thickman, 1995). In the literature, advantages in using Power Doppler have also been reported in acute cholecystitis (Uggowitzer et al., 1997) and in inflammatory states of musculoskeletal tissues (Newman et al., 1994).
The enhanced sensitivity to the detect low velocity blood flow vessels and to display with accuracy the delineation of tortuous and irregular vessels, makes Power Doppler a promising technique to image intratumoural vessels. If properly used PD can thereby, ameliorate Colour Doppler accuracy for predicting the likelihood of benign versus malignant nodules. In fact, by studying the nodular vascular pattern, many authors have shown that the resistive index (RI) (RI=[PSV-EDV]/PSV; PSV, peak systolic velocity; EDV, end diastolic velocity), values in malignant nodules were significantly higher than in benign nodules (Tamsel et al., 2007).
1.5 Doppler Ultrasound in Equine Reproduction
Transrectal B-mode (grey scale) ultrasonography has revolutionized diagnosing and monitoring of biologic and pathologic reproductive events in horses and cattle, for both clinical and research areas (Ginther, 1995). In these species, B-mode is not only used to identify and measure structures, but also to assess physiologic status (Ginther & Utt, 2004).
Nowadays, Doppler ultrasound seems to be able to provide a major positive impact on the diagnosis and predictive capabilities of equine reproductive theriogenologists and research scientists. The extent of vascular perfusion of a structure can not only indicate the current status of the structure, but it also can provide indications for its future viability (Ginther & Utt, 2004).
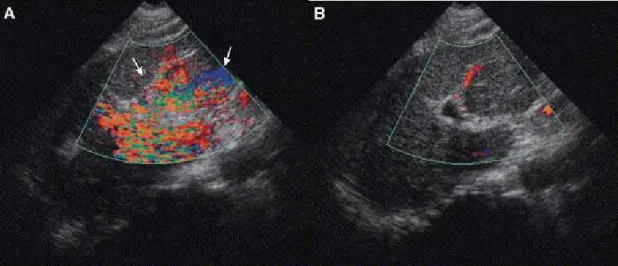
Fig 3- Images of 2 CL from a 48-day pregnant mare shown in colour-flow mode (A) and power-flow mode (B) from similar sections. (Adapted from Ginther & Utt; 2004)
1.5.1 Colour Doppler ultrasound evaluation of testicular blood flow in stallions
Colour Doppler ultrasound has become a method of choice to evaluate vasculature of various organs, including testes. In Human Medicine, this technique has been used to evaluate blood flow in the testicular artery and has also been applied for the diagnosis of testicular pathologies associated with altered blood flow, including spermatic cord torsion, testicular infarction or varicocoele (Aydos et al., 1993; Pavlica & Barozzi, 2001; Sidhu, 1999; Sriprasad et al., 2001).
Colour Doppler ultrasound appears to be useful in identifying early inflammatory or neoplastic changes of the testes and epididymes, as well as in evaluating other scrotal disorders in people (Herbener; 1996, Gorecka-Szyld; 1999).
In stallions, the resistive index (RI) of testicular arteries seems to be the most useful clinical measure of blood flow to and within the testis and epididymis. This parameter can suffer variation in inflammatory processes but also caused by aging (Jee et al., 1997; Wielgos et
significant factor, older stallions had lower values of EDV- end diastolic velocity and greater values of RI than the middle age stallions (Pozor & McDonnell, 2004).
Colour Doppler ultrasound characterization of blood flow of the stallion testis is possible, and is becoming an useful tool for objective evaluation of the stallion testis, particularly in cases of scrotal disorders with different etiologies (Pozor & McDonnell, 2004). The presence of a turbulent blood flow was demonstrated in some severe cases of hydrocoele (Pozor & McDonnell, 2004). A characteristic vascularisation of testicular tumour in the stallion and abnormal course of large blood vessels within the testicular parenchyma after a trauma was also seen (Pozor & McDonnell; 2004).
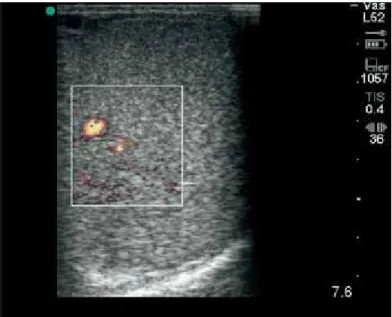
Fig 4 - Power Doppler ultrasound image of central vein and small intratesticular vessels
1.5.2 Colour Doppler evaluation of the uterine artery in mares
In the early luteal phase, mares present a low Resistive Index (RI), indicating a decreased impedance to blood flow in distal vasculature and consequent increased uterine perfusion. It seems logical that uterine blood supply would be higher in the early luteal phase, which corresponds to the time of entry of the embryo into the uterus. In fact uterine blood supply is important for embryo nutrition and maternal recognition and its changes can influence early embryonic loss in mares (Bollwein, Mayer, Stolla; 2003).
A high vascular resistance of the uterus in older multiparous mares was shown to occur in result of fibrosis, and can be a cause of infertility in these animals (Bollwein, Maierl, Mayer & Stolla, 1998)
1.5.3 The Uterine Index
The Uterine Index (UI) can be calculated by the difference between the RI values (resistance index) of the uterine arteries from the non-pregnant (RInp) and the pregnant (Rp) uterine horn multiplied by 100.
In gestation the RI value of uterine artery at the non-pregnant horn is higher from week 4 onward. The UI is positive and becomes higher as pregnancy proceeds. This results from the fact that the uterine horn in which the embryo implants will have a greater blood supply than the horn from the opposite side. The increase in uterine blood flow at the pregnant side can help to develop an optimal endometrial environment and to transport essential nutrients directly to the embryo.
Using the UI, Chen and Stolla (2006) could predict embryonic death as early as 32h before the embryo died, a diagnosis that cannot be currently done by using conventional B-mode ultrasound where measurement of the diminishing embryo size is used. They also established that, if UI value is greater than 10, the pregnancy can be diagnosed as physiologically normal and no embryonic death or interruption of gestation is expected to occur. If the UI value filled between 5 to 10 UI, the same authors recommended a re-examination pre-scheduled time intervals, every 1 to 3 days. If the obtained UI value was lower than 5, it clearly indicated that embryonic mortality was ongoing. This study demonstrates that this method allows the clinician to early detect the condition through and than be able to treat the animal in order to prevent embryonic death (Chen & Stolla, 2006).
1.5.4 Colour Doppler for follicular development and ovulation predicting
In a study about follicle deviation and selection it was shown, by using colour Doppler US, that the peak systolic velocity (PSV) and the time-averaged maximum velocity began to decrease in the future largest subordinate follicle and continued to increase in the future dominant follicle. This difference started 2 days before the beginning of the most evident difference between the subordinate and the dominant follicle (Acosta et al., 2004). These findings allow the veterinarians to identify the dominant follicle before diameter deviation.
Other work, based on a B-mode US, describes an anechoic band progressively, which increases in the area between the theca layers during the 3 days before ovulation (Gastal et
al., 2006). During the last 4h before ovulation the same authors showed, with colour-Doppler
displays, that a progressive decrease in the percentage of the follicle wall with decrease on colour signals happen. In another study (Carnevale et al., 2002), several mean pixel values
increased in an approximately linear fashion during the 14h before ovulation in hCG –treated mares. These may allow the practitioners to predict with some degree of assurance the time of ovulation and the best time for insemination.
1.6 Power Doppler quantification
Quantification of Power Doppler Energy (PDE) in two-dimensional ultrasound machines has been a subject of interest in recent years and has ranged from subjective methods to semi quantitative techniques (Amso et al., 2001).
Some software are able to capture and make an objective quantification of the PDE image by converting pixel information, in a previous storage image, into linear measurements, allowing true comparisons between regions and permitting calculation of the relative perfusion (Blomley et al., 1997; Yang et al., 1999).
With this software some indices can be calculated and evaluated. Some of these indices include: the region of interest (ROI) area, the area within the ROI occupied with color pixels – colour Doppler area (CDA), the mean colour energy (MCE), the peak colour energy (PCE), and the integrated colour energy per square millimetre. All these parameters represent a true reflection of the vascular density or vascularity within a tissue being analysed at any given point in time (Amso et al., 2001).
Power Doppler ultrasonography for the evaluation of vasculature of CL in women (Miyazaki
et al., 1998) and in mares (Bollwein et al., 2002; Hendriks et al., 2006) has been previously
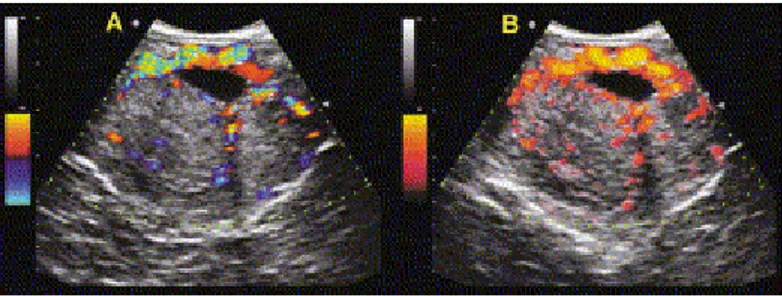
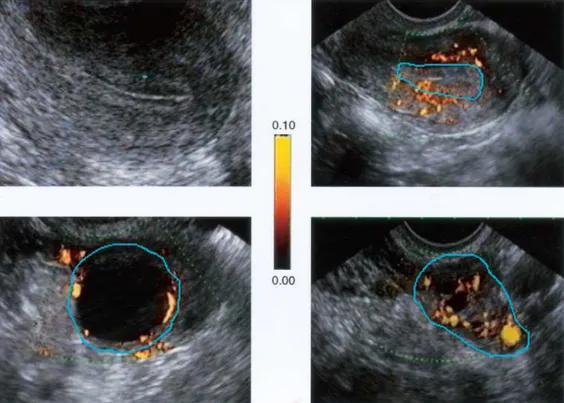
Fig 5 - Ultrasound colour power Doppler images. Top left: transvaginal gray-scale image of endometrium. Top right: ROI drawn around (adapted from Nazar et al., 2001)
Estrous cycle in mares
The mare is a seasonally polyestrous species that normally ovulates during the months of Spring and Summer (Nagy, Guillaume, Daels; 2000). One of the most important aspects on the regulation of its reproductive patterns is the photoperiod (Ginther, 1992). Melatonin secretion increases at the beginning of the dark phase and decreases rapidly at the end of the night (Guillaume and Palmer, 1991; Palmer and Guillaume, 1992). During the dark phase melatonin secretion is stimulated by norepinephrine (Sharp, Grubaugh, Berglund, Seamans, 1980). During Fall and Winter the decrease on day length, which occurs in high latitude located regions, causes an increase in daily duration of melatonin secretion, which results in the decrease of GnRH and cessation of ovulation (Nagy et al., 2000).
It is known that, in addition to photoperiod, factors such as nutrition, body condition and environmental temperature have an effect on seasonal reproductive activity. In fact, more recent studies revealed a complex neuro-endocrine system regulating seasonal changes in hypothalamic and pituitary activity that involves not only melatonin but also neurotransmitters such as opioids and catecholamines (Nagy et al., 2000)
The gonadotropin releasing hormone (GnRH) secretion that occurs on the hypothalamus, results on the releasing of the gonadotrophins as luteinizing hormone (LH) and follicle stimulating hormone (FSH) (Ginther, 1992).
Ovulation is dependent on LH as it is in other species and it reaches its maximum concentration on circulation one or two days prior to ovulation (Ginther, 1992).
Follicle stimulating hormone (FSH) concentrations, which remains low during estrus, increase during diestrus and start to decrease approximately 8 days before ovulation. It is a potent follicular stimulant, which acts by stimulating estradiol production by granulosa cells from the preantral follicle (Ginther, 1992).
Folliculogenesis in mares is characterized by one or two follicular waves (Ginther, 1992). Follicular waves refer to a several follicles that emerge and initially grow in synchrony. In a major wave, the largest follicle of the wave attains the diameter of a dominant follicle (larger than 28mm). In minor waves the largest follicle does not become dominant (Ginther, Beg, Gastal, Gastal; 2004). The follicles that result from major waves may eventually dissociate or deviate. A preferential growth of one, or occasionally two, members of the wave characterize this deviation. This follicle is then termed the dominant follicle (Ginther, 1992). This selected follicle grows to a large diameter (>28mm) and may then either regress (anovolatory major wave) or ovulate (ovulatory wave). The remaining follicles, termed subordinate follicles, undergo atresia (Ginther et al., 2004).
A cascade of intrafollicular biochemical events precedes the beginning of diameter deviation. The mechanism which switches this functional cascade involves reduced circulating FSH concentrations and the attainment of a critical developmental stage by the future dominant
follicle, which includes the acquisition of granulosa cell LH receptors and enhanced responsiveness to gonadotrophins (Ginther et al., 2004). The role of FSH, after the peak of the surge involves the continued growth and development of all follicles before deviation and the developing dominant follicle after deviation (Ginther et al., 2004).
At the time of ovulation, the preovulatory follicle grows up to a maximum diameter, reaching the ovulatory fossa, becoming softer and more sensitive to palpation as ovulation approaches (Ginther, 1992). All ovulations in mares occur through the ovulation fossa. The ovulatory follicle develops, increasing not only in width but also in depth as they extend through the ovarian stroma and encroach on the ovulation fossa (Youngquist, 1997).
1.6.1 Corpus haemorragicum
Immediately after ovulation, the distinct cavity of an ovulation depression can be palpated transrectaly. However it may not be evaluated in some mares even shortly after ovulation. As in most of the cases, blood fills this ovulatory space quickly forming the corpora haemorragica (CH). This structure appears on the ultrasonography as echogenic particle containing which results from blood filling the former follicular space. The CH feels softer and more fluctuant than the surrounding ovarian stroma during the first one to two days after ovulation. As the blood organizes, its ultrasonography appearance becomes more hyperechoic and, over the span of 2 to 4 days more uniform (Youngquist, 1997).
The hypothesis that formation of a CH is necessary in the development of a CL was not supported in some studies (Pierson and Ginther, 1985). It appears that the CH is not functionally important, since it developed in only an half of the luteal glands and its presence did not alter the length of the time that the luteal gland was observed by ultrasonography neither the length of the interovulatory interval (Pierson and Ginther, 1985).
1.6.2 Corpus albicans
As regression begins, the luteal structure undergoes to a lighter appearance because of decreasing vascularisation and increasing connective tissue organization (Ginther, 1992). During the subsequent diestrus the corpus albicans continued to regress, decreasing its size and the pigments residues are condensed. The structure becomes darker with hues of orange, red, or brown. As the involution continues the luteal structure loses its weight and its colour changes from pale yellow to light brown as the cycle progresses (Ginther, 1992).
2.2 Corpus luteum functions
The corpus luteum (CL) is a transient endocrine gland, whose primary secretory product, progesterone (P4) is required for the establishment and maintenance of pregnancy (Webb et
al., 2002). The importance of P4 concentration during the first weeks of pregnancy has been
demonstrated in cattle (Mann & Lamming, 1999). In agreement with some reports, the presence of an early peak of P4, within 5 days after mating or AI facilitates the elongation of the conceptus and, consequently, the secretion of interferon-tau (Plante et al., 1989), which extends the lifespan of the CL by suppressing estradiol receptor and oxytocin receptor genes (Spencer & Bazer, 1996), and by attenuating the endometrial secretion of PGF2α (Helmer et
al., 1989).
Large luteal cells are known to be the source of luteal oxytocin (Sawyer et al., 1986) and relaxin (Fields et al., 1980) in ruminants. Watson and Sertich (1990) demonstrated the production of prostaglandin (PGF2α), PGE2, and 6-keto-PGF1α, by equine luteal cells. However the role of these compounds in controlling production of progesterone has not been elucidated for the mare. They suggested that the ratio PGF: PGE2 throughout the cycle may be of significance in luteolysis.
2.3 Luteal insufficiency
The importance of the ovaries and progesterone for the survival of the embryo, including its early stages, has been studied by ovariectomy and by administration of PGF2α to induce luteolysis. This study indicated that progesterone is essential to the survival of the embryo, including the early stages (Ginther, 1985).
Even though, luteal progesterone is essential for various mechanisms associated with early pregnancy, it is not clear whether a deficiency in luteal development or progesterone production can result in a natural reduced pregnancy rate. Results of a study show that, while the progesterone concentration may have contributed to pregnancy or has been a consequence of it, it was not a limiting factor (Sevinga et al., 1999). Contradictory results on primary luteal insufficiency as a cause of failure of pregnancy establishment have been obtained in horses. An effect of defective vascularisation of the corpus luteum on reduced pregnancy rate apparently has not been considered in any species (Silva et al., 2006).
Some authors pointed that failure to maintain a CL and an inadequate progesterone production (≤ 2ng/ml) are the major causes of infertility and early embryonic loss since progesterone is a necessary requirement for both endometrium development and embryo survival (Ginther, 1985; Martin and Laurence, 1994; Webb et al., 2002). As in so many aspects of reproductive physiology, the mare is an exception to the majority rule. Its primary
corpus luteum of pregnancy begins to decline in secretory activity as early as day 14 –16 after ovulation and thus at about the same time that complete luteolysis would normally occur in the cycling animal. This causes a slow fall in peripheral plasma progesterone concentrations during the next 20-25 days until a secondary rise commences, usually at around day 35-45 coincidentally with the onset of secretion of equine Chorionic Gonadotrophin (eCG) (Allen, 1984). This second rise on progesterone concentration attributed to the development of secondary corpora lutea that develops in mare’s ovaries between days 40 to 150, and to the horse placenta that secretes sufficient of progesterone to maintain pregnancy from about day 100 (Allen, 1984).
2.4 Corpus luteum formation
In most species the CL develops from the granulosa and theca interna and externa cells after the ovulation. However, in the mare, the cells from the theca interna do not contribute to luteal tissue as seen in other farm species (Ginther, 1992).
2.5 Corpus luteum morphology
In the equine corpus luteum the morphology is unlike that of ruminants, in that there is marked trabeculation of tissue that results from the collapse of the preovulatory follicle at ovulation (Lawler, Hopkins, Watson; 1999). These trabeculae consist of extracellular matrix, fibroblasts and small cells (Harrison, 1946), and contain much of the vasculature of the corpus luteum. The steroidogenic large cells of the equine corpus luteum are thought to have origin only from the granulosa layer of the follicle (Van Niekerk, Morgenthal, Gerneke, 1975)
After ovulation, in cows, granulosa cells differentiate into large luteal cells (LLC), which comprise 30% of steroidogenic cells, and secrete 70% of progesterone, even though LH does not stimulate them for the progesterone secretion. In ruminants, the theca interna differentiates into small luteal cells (SLC), which includes 70% of steroidogenic cells. Small luteal cells require LH stimulation for maximal progesterone secretion, but only secrete 30% of all progesterone (Farin et al., 1989; Niswender et al., 1994). In the mare CL it has been shown that it is composed mainly of three types of cells: large luteal cells, small luteal cells, and endothelial cells. It has been shown, in the same species, that the proportion of LLC decreased between mid and late diestrus, and the proportion of SLC increased as age of CL advanced (Watson and Sertich, 1990). Nevertheless, contradictory results indicated no changes in SLC number with CL development and lysis, while LLC increased from early to mid luteal phase (Roberto da Costa et al., 2005)
In contrast with other species, in the mare, small luteal cells are not of thecal origin (Van Niekerk et al., 1975; Ginther, 1992), since thecal cells undergo regression within 24h after ovulation (Van Niekerk et al., 1975).
The repeated mitoses of steroidogenic cells, in the developing CL, are accompanied by a highly intense angiogenic process, which reaches a peak 2-3 days after ovulation (Reynolds, Grazul-Bilska, Redmer; 2000). Thus, the majority of steroidogenic cells of the mature CL are in contact with one or more capillaries (Reynolds, Killilea, Redmer, 1992).
In another study on equine CL, there was an increase in proliferating cell nuclear antigen expression (PCNA) in large luteal cells from the corpus haemorrhagicum to the mid luteal phase, followed by a decrease towards the late luteal stage (Roberto da Costa et al., 2005). The normal development of the CL and its capacity to produce progesterone, growth factors and angiogenic factors depend on its vascularisation (Acosta & Miyamoto, 2004). This neovascularisation is important to provide the circulating substrate, such as low-density lipoprotein, that is used by the luteal cells for progesterone biosynthesis (Carr et al., 1982). The sprout of new blood capillaries supports the development of luteal cells and appears to be locally potentiated by Angiotensin II (Ang II) and growth factors that induce angiogenesis and support the synthesis of progesterone in luteal cells (Kobayashi et al., 2001).
2.6 Local control mechanisms 2.6.1 Luteal angiogenesis
The rapid cyclical changes in luteal growth and regression demands corresponding rapid changes within its vasculature. It is well known that regulation of angiogenesis is a critical factor regulating luteal function (Webb et al., 2002).
Angiogenesis consists of at least three steps; break-down of the basement membrane of existing blood vessels; migration of endothelial cells towards an angiogenic stimulus and proliferation of endothelial cells to establish a new blood vessel sprout (Redmer et al., 2001). Studies in ruminant’s CL showed that the main angiogenic factors are the basic fibroblast growth factor (FGFs) and vascular endothelial growth factor (VEGF). These factors stimulate Ang-II, PGF2α, and progesterone secretion (Reynolds et al., 1999)
2.6.1.2 Vascular Endothelial Growth Factor
There are some evidences that VEGF is the main angiogenic factor in the corpus luteum (Reynolds and Redmer, 1998). In the mare, luteal cells express VEGF until the late luteal phase, when its expression decreases (Tamanini and Ambrogi, 2004). VEGF has been