PAYBACK PERIOD ANALYSIS of USING GREEN ENERGY
Within the Scope of SMART URBAN REGENERATION and
SELECTION of GREEN VEHICLES in TURKEY
Baturay Yenilmez
Dissertation submitted as partial requirement for the conferral of
Master of Science in Business Administration
Supervisor:
Assoc. Prof. Dr. Joao Carlos Rosmaninho de Menezes, ISCTE Business School, Department of Marketing, Operation and Management
In today’s world, number of people who live in cities allocate almost 50% of the world population and it is expected to be reached 80% in the following years. Therefore, smart urban regeneration pursuant to use of green energy and green mobility gain critical role for sustainable environment.
The study documented in this paper has been carried out in order to change people’s perception on expensiveness and immaturity of using green energy and green vehicles by giving quantitative results for Turkey case. Importance and benefits of using green energy and green vehicles within the scope of urban regeneration will be highlighted.
Consumption comparison between current and energy efficiently retrofitted house is analyzed with the help of software such as Hourly Analyze Program by Carrier. In addition, electric generation via photovoltaics is observed with PV*Sol.
Greening the vehicles offer wide range of benefits including reduction of fuel consumption that plays very important role on both household economy and environment. In order to highlight economic benefits, diesel-gasoline vs. hybrid-electrical vehicle comparison is made.
After benefits are shown and consumption analysis are done, initial aim has been achieved through the payback period analysis of retrofitting the building that designed as elementary family house and greening the personal vehicles regarding to initial investments and savings in Turkey.
Keywords: Smart Urban Regeneration, Green Energy, Green Vehicles, Payback Period
O número de pessoas que vivem em cidades aproxima-se dos 50% da população mundial, sendo que é esperado que se alcance os 80% nos próximos anos. Desta forma, uma regeneração urbana inteligente baseada na utilização de energia e mobilidade verde têm vindo a ganhar destaque para a criação de um ambiente sustentável.
Este estudo foi realizado com o objetivo de mudar a perceção das pessoas sobre o custo e a maturidade do uso de energia verde e de veículos mais sustentáveis, disponibilizando um conjunto de resultados no contexto da Turquia. A importância e os benefícios do uso de energia verde e veículos ecológicos no âmbito da regeneração urbana será destacado.
A comparação entre consumos gerados pelo uso de eletricidade gerada tradicionalmente e aquele que deriva do uso de eletricidade proveniente de uma casa reequipada de forma eficiente e sustentável é analisado com a ajuda de softwares como o Hourly Analyze Program da Carrier. A geração elétrica através de células fotovoltaicas é analisada com o programa PV * Sol.
A utilização de veículos sustentáveis oferece inúmeros benefícios, incluindo a redução do consumo de combustível que desempenha um papel muito importante quer para a economia familiar, quer para o meio ambiente. A fim de destacar os benefícios económicos, a comparação veículo diesel-gasolina vs. híbrido- elétrico é feita.
Após a identificação dos benefícios suportada pela análise de consumo, desenvolveu-se uma análise ao payback period relativa à adaptação ecológica quer do edifício concebido como casa de família elementar, quer dos veículos pessoais considerados, tendo em conta os investimentos iniciais e a realidade económica na Turquia.
Palavras-chave: Smart Regeneração Urbana, Energia Verde, Veículos Verdes, Período de Retorno
1.1 Definition of the Problem Context ... 1
1.2 Research Problem Addressed ... 1
1.3 Brief Statement About the Research Methodology Used ... 2
1.4 Value of the Thesis ... 3
1.5 Thesis Structure ... 3 2 Literature Review ... 4 2.1 Building Retrofitting ... 5 2.1.1 Insulation ... 6 2.1.2 Glazing ... 7 2.1.3 LED Lighting ... 7 2.1.4 Photovoltaics ... 7 2.2 Mobility ... 8 3 Methodology ... 10
3.1 Green Building Design ... 10
3.1.1 Demo House Audit ... 10
3.1.1.1 Current Status of the Demo House ... 10
3.1.1.2 Energy Consumption Analysis of the Current House ... 16
3.1.1.3 Energy Expense of the Current House ... 18
3.1.2 Retrofitted House Audit ... 20
3.1.2.1 Insulation ... 20
3.1.2.2 Glazing ... 23
3.1.2.3 Lighting ... 25
3.1.2.4 Photo-Voltaic ... 26
3.2.2 Mobility Expenses ... 35
4 Findings ... 37
4.1 Building Retrofitting ... 37
4.2 Mobility ... 39
4.2.1 Payback Period Analysis of Mobility Decisions ... 39
4.2.1.1 Base Case ... 41
4.2.1.2 Best Case ... 42
4.2.1.3 Worst Case ... 43
5 Conclusions ... 45
5.1 Implications ... 45
5.2 Limitations and Barriers in front of Smart Urban Regeneration ... 45
6 Bibliography ... 49
APPENDIX A: Simulation Results of Building Retrofitting ... 52
APPENDIX B: Simulation Results of Electric Generation from PVs ... 60
Figure 1: Demo House Overview ... 11
Figure 2: Floor Plans ... 11
Figure 3: Thermal Bridges ... 14
Figure 4: Heat Losses at Openings ... 14
Figure 5: Blower Door Test ... 15
Figure 6: Gas fired boiler and radiator within dwelling ... 16
Figure 7: External Thermal Insulation Layers ... 20
Figure 8: Rockwool insulation material ... 21
Figure 9: Glasswool insulation material ... 22
Figure 10: Triple glazing sections ... 23
Figure 11: Lighting Retrofitting Plan ... 25
Figure 12: LED lights ... 26
Figure 13: BIPV and Carport System ... 27
Figure 14: Yaris Hybrid and Yaris Style Multi-drive S ... 34
Table 1: Demo House Element Description ... 12
Table 2: Performance Evaluation of Current Window System ... 13
Table 3: Energy Consumption Analysis of the Current House ... 17
Table 4: Detailed Monthly Energy Consumption of the Current House ... 17
Table 5: Energy Expense Analysis of the Current House ... 18
Table 6: Energy Expense of the Current House (Monthly-Detailed) ... 19
Table 7: Thermal Insulation description ... 21
Table 8: Roof insulation Layers ... 22
Table 9: Cost of the Insulation Retrofitting ... 22
Table 10: Comparison of two different triple glazing unit ... 24
Table 11: Cost of Glazing Retrofitting ... 25
Table 12: Cost of LED Lighting Retrofitting ... 26
Table 13: Solar Energy Contribution ... 28
Table 14: Cost of the Photo-Voltaic Application ... 28
Table 15: Energy Consumption Analysis of the Retrofitted House ... 29
Table 16: Monthly Consumption Analysis of the Retrofitted House ... 30
Table 17: Energy Expense Analysis of the Retrofitted House ... 31
Table 18: Energy Expense of the Retrofitted House ... 32
Table 19: Technical Specifications of Hybrid and Gasoline Yaris ... 33
Table 20: Technical Specification of BMW i3 and 2.16d ... 34
Table 21: Consumption Assumptions of Vehicles ... 35
Table 22: Tax and Maintenance Assumptions ... 36
Table 23: Cost of Building Retrofitting ... 37
Table 24: Annual Retrofitting Savings ... 38
Table 25: Economic Analysis of Building Retrofitting ... 38
Table 26: Summary of the U-Value of building elements ... 39
Table 27: Price of Vehicles ... 39
Table 28: Initial Investment ... 40
Table 29: Oil Prices ... 40
Table 30: Energy Prices Considered ... 41
Table 35: Savings Assumption (Worst Case) ... 43 Table 36: Payback Period (Worst Case) ... 44
HAP Hourly Analyze Program
m2 Square Meter
XPS Extruded Polystyrene
cm Centimeter
U Thermal Transmittance Coefficient
PVC Polyvinyl Chloride
DHW Domestic Hot Water
HVAC Heating, Ventilating, & Air Conditioning
€ Euro
m3 Cubic Meter
EPS Expanded Polystyrene
LED Lighting Emitting Diode
W Watt
PV Photovoltaic
BIPV Building Integrated Photovoltaic
kW Kilowatt kWh Kilowatt Hour EV Electric Vehicle EU European Union EC European Commission CO2 Carbon Dioxide lt Liter gr Gram km Kilometer
BEC Building Energy Certificate
e.g. Exempli Gratia (Latin)
PC Personal Computer
After a very tough and intensive period of twelve months, today is the day: writing this note of thanks is the finishing touch on my thesis. It has been a period of being strong in the face of what happened in Turkey and intense learning in the scientific area for me at the same time. Writing this thesis has had a numerous positive impact on me. I would like to reflect on the people who have supported and helped me so much throughout this period. For that I want to start thanking with ISCTE Business School Business Administration Committee who made it possible for student like us.
I must offer my profoundest gratitude to my master thesis advisor Dr. Joao Carlos Rosmaninho de Menezes. From finding an appropriate starting point in the begging of the project, Mr. Menezes offers his unreserved helped and guidance and lead me to finish my thesis step by step. Without his kind and patient instruction at the troublesome period that I had, it is impossible for me to finish my master thesis on time. I am highly indebted to my mentor Mr. Murat Aksu. His words not only inspire me but also bring me to higher level of thinking. What I learnt from him is not just how to manage and solve the problems in business life, but how to view this business world from a new perspective. I am very thankful to him for giving the right advice at the right time and for being a source of motivation to me.
Last and foremost I am thoroughly grateful to my parents for providing me with unfailing support and continuous encouragement throughout my years of study and through the process of researching and writing this thesis. This accomplishment would not have been possible without them. Thank you.
1 Introduction
This paper has been prepared in order to communicate the master dissertation thesis that has been undertaken within the scope of the Instituto Superior de Ciências do Trabalho e da Empresa 2nd year Business Administration course.
1.1 Definition of the Problem Context
According to Environment Protection Agency (2012), atmosphere is overloaded with carbon dioxide and other hazardous emissions by human activities. As a result, those gases trap the heat at the atmosphere and causes steady temperature increase on the planet that create harmful and significant impact on climate, environment and health. Furthermore, fossil fuels are spent in a non-sustainable manner although fossil fuels are finite and reserves cannot be replenished naturally. In addition, concentration of fossil fuels is getting more technically challenging and expensive since it is available only in a certain region
As the world population increased, the number of buildings to live in and vehicles to travel is increased. Even tough and environmental and economic benefits of using green energy is started to prove by authorities, citizens still have prejudice on green energy systems due to small number of accomplished examples and objective quantitative results. (Aksu & Yenilmez, 2016)
In addition, Erdal (2008) states that Turkey is a country whose energy resources rely heavily on outside. Therefore, cost of energy is highly expensive (Demirbaş, 2001). Also, environment policies are one of the essential titles pursuant to cohesion policy of EU that Turkey should fallow to meet the membership requirement as a candidate country.
1.2 Research Problem Addressed
Increasing environmental problems on earth, excessive population growth and industrialization are the basis of the problems faced in the new century of environmental planners and designers (Kırzıoğlu, 2000). Özbalta (2003) claimed that it is necessary to develop an energy system that is disturbing the ecological balance in urban
regeneration. Thus, people must be more aware about importance of using green energy and green vehicles due to global warming effects in the last decade.
Research problem will address the following question: How long is the payback period for green energy systems? Is it match with people’s negative thoughts and discouragement about green energy systems or is it just the opposite.
1.3 Brief Statement About the Research Methodology Used
Cost/Benefit or Cost/Saving analysis provides simple and very useful set of tools for citizens to make rational investment decisions about which green energy actions are the most cost-effective to implement. From simple to complex there are many levels of this type of analysis (Sitarz, 2008).
According to Mear (2011), simple cost payback method is used in order to ensure readers to make rational decisions on building retrofitting within the scope of urban regeneration. In this method, total investment cost of the retrofitting is divided by the annual energy cost saving occurred by the retrofitting. The result of the division gives the number of years that is required to pay retrofitting’s initial cost.
Reliable simulation programs such as Hourly Analyze Program (HAP) for current and retrofitted building energy consumption and PV*Sol for electric generation by photovoltaic, have been used for analyzing the savings and contributions.
Cost is calculated from price offers from corporate firms for building interventions and price lists from official websites of vehicle companies. It should be noted that current prices are considered to have objective results.
Payback period methodology including three different cases which are best, worse and base, is used to enlighten the reader about purchase decision of green vehicles instead of conventional vehicles.
1.4 Value of the Thesis
This paper is intended as a resource for any citizen who seeks to participate green energy system users. Its mission is to enlighten citizens against their prejudice and change their perception on expensiveness and immaturity of green energy and green vehicle usage within the scope of urban regeneration. In addition, savings and benefits of these systems will be highlighted during this paper.
1.5 Thesis Structure
The dissertation is structured into 5 main sections, namely:
Chapter 1 of the report, successively define the content and format of the thesis. Chapter 2 express previous studies on smart building interventions and green mobility.
Chapter 3 summarizes the demo house audit and simulation result of the current situation versus the expected results as a function of boundary conditions, which then serve as a basis to evaluate feasibility of the suggested retrofitting actions. Additionally, it indicates comparison between environment friendly green vehicles and conventional vehicles.
Chapter 4 summarizes the results of building retrofitting action in terms of economical and thermal transmittance (U Value). In addition, economic analysis of mobility interventions including base, best and worst case can be found in this section.
Chapter 5 briefly explains the barriers in front of smart urban regeneration model that create prejudice on people to put into practice. Also, it remarks the outcomes of the smart urban regeneration model and economic analysis of interventions.
2 Literature Review
In field of existence, brain power of human race trumps over any physical strength of animals so far. Creatively modifying the environment and building stable houses allowed humans to secure safety goals thanks to this ability. In fact, without safe and comfortable living zone crafting of dishes and weapons, which are vital elements for early humankind, would not be possible to done. More than for paintings and writings, most of the civilizations are mentioned and known for the buildings they left behind (Smart Cities and Communities, 2013).
According to Mega’s (2005) study, buildings are responsible for 45% of the total energy consumption in the European Union that is caused by heating, cooling, ventilation, lighting, appliances and equipment’s demand. Higher levels of indoor comfort, growing use of complex electronic systems and equipment at homes and offices and increasing living space per capita cause more energy consumption. It is estimated that European people spend their 90% of time indoors, thus the impact of energy consumption in buildings is pervasive.
As the population of the World increase, the number of construction on the planet increase. Due to recent atmospheric & environment pollution reports building design gain vital importance. Thankfully, potential new house buyers looking for not only a comfortable but also smart and environment friendly houses nowadays. Therefore, new buildings are started to be registered to third-party green building certification institutions by construction companies. This trend can be seen as sale and marketing strategy; however, it is also effective way of increasing the number of smart houses (Kibert, 2016). In addition, people should have been showing same sensitivity when it comes to urban regeneration and renovation of houses.
In addition, a directive has published by the European Union that indicates all Member States shall ensure not only all new buildings are nearly zero-energy buildings by 31 December 2020 but also new buildings occupied and owned by public authorities are nearly zero-energy buildings after 31 December 2018. (European Parliament and the Council of the European Union, 19 May 2010) Therefore, building retrofitting
interventions are very essential to reduce not only energy demand but also carbon emission.
Green energy and transportation technologies are key to obtain societal and economic benefits and improve citizens’ quality of life. Majority of the interrelations between technology and people can be represented by green technologies. When energy production, distribution and use, mobility and transportation are related and go hand in hand, a big task offering new interdisciplinary opportunities to turn cities smarter. Is already open in the common area (REMOURBAN, 2015).
Furthermore, internal combustion engines have been dominating personal transportation since approximately last century. In fact, in urban areas almost half of the total pollution occurred by the use of fossil fuels in transportation which generates harmful emissions (Kikuchi, 2009). In order to achieve cleaner urban mobility, specific efforts on new fuels and technological innovations are started to dedicated by local authorities. Pyke & Brown (2010) stated that electric vehicles are about to experience rapid growth in both developed and developing vehicle markets. If broad adaption of the electric vehicle satisfied, environmental footprint of transportation and dependency on the petroleum will be decreased dramatically.
2.1 Building Retrofitting
The use of renewable energy sources and ecological planning in urban regeneration is quite a new issue. After the major earthquake occurred in 1999, this issue become even more important. Thanks to urban regeneration, renewable energy usage has been increased in smart buildings. Renewable energy sources are geothermal, solar, wind, sea-based, biomass and hydraulic energy (Duygu, 2002).
Researches and articles about urban transformation and renewable energy sources are available in literature. One of them was made by Şenlier in 1994. He defined the definition of ecological restrictions, content and method in cities.
In the first case, it should be noted that citizens have no problem to resort to the financing for televisions, mobile phones, PC and appliances, that is, equipment that
often have costs in the order of magnitude of the investments related to smart cities and energy efficiency, but possess the advantage of generating cash flows and have returns comparable or better than typical investment opportunities available in the bank for the same subjects (Aksu & Yenilmez, 2016).
According to US General Services Administration (2009), numerical analysis of the green buildings are the followings: green buildings have 7.5% higher value, 8.5% lower operational cost and 3.5% greater occupancy ratio than traditional buildings. Additionally, they provide a 6.6% total return on investment according to the 2008 McGraw-Hill Construction Smart Market Report. Consequently, green buildings on average generate greater investment returns than those that are not. In other words, life cycle cost of green buildings is lower than newly built conventional buildings.
In addition, Re-use of existing structures enables the preservation of resources as well as the cultural and architectural characteristics pertaining to one’s country. Attention to detail regarding the siting of buildings can also contribute to occupants’ quality of life. Thus adopting a holistic approach to construction is critical in deciding to build green.
2.1.1 Insulation
In low-energy buildings, where heating demand is high, the whole building envelope should be insulated very well. Building elements which distinguish outside from the inside accepted as building envelope. Objective of the thermal insulation is ensuring comfortable indoor climate irrespective of outside climate and temperature that is determined by the weather (Yenilmez, 2015).
The passive house resource (2016) has stated if the insulation is insufficient to prevent heat transfer, heat is lost through the building envelope and vis-à-vis for hot periods. Therefore, heat flow is needed to be restricted regardless of the climate.
2.1.2 Glazing
Windows are one of the most essential components of buildings as they provide natural daylighting, ventilation and visual interface between interior and exterior spaces. Window types may have a direct effect on energy efficiency for buildings both in positive and negative ways in accordance with its properties. Double or triple glazing, inert gas filling or low-e coating applications for windows are the main solutions that increase window efficiency (Strong, 2012)
2.1.3 LED Lighting
Fluorescent lamps are replaced with LED panels due to their low energy consumption and high hour of lifespan while comparing to the others. Also, there is no need any maintenance for LED panels. In addition, LEDs retain their luminous flux and color temperature until the end of their life cycle. Besides, LEDs offer decorative solutions (U.S. Department of Energy, n.d). In addition to LED panel retrofitting, applique lamps are used in bedroom, bathrooms and at the stairs in order to offer comfort zone.
2.1.4 Photovoltaics
The studies on how to benefit from solar energy has gained momentum especially after 1970s. Later on, thanks to technological advances in solar energy, the cost of using solar energy has decreased. In addition, after some analysis and tests conducted by experts, solar energy has been classified as a clean energy source (Administration, General Directorate of Electrical Power Resources Survey and Development, n.d). Türe (2011) stated that countries who have limited fossil fuels should adopt solar energy as one of their primary energy sources. Since Turkey doesn’t have enough fossil fuel reserves, it is wise to adopt solar energy.
Integration of the photovoltaic (PV) into the building envelope is called Building Integrated Photovoltaic (BIPV). According to Oliver & Jackson (2001), BIPV can serve dual function which are building skin replacing conventional building envelope materials and power generator. Since BIPV serving as building envelope material and power generator, it can not only provide savings in electricity costs and
materials, reduce use of fossil fuels and emission of ozone depleting gases but also add architectural value to the construction.
In today’s market, a wide variety of BIPV systems are available. Façade systems and roofing systems are main categories of them. Façade system includes glazing, curtain wall products and spandrel panels whereas roofing system includes tiles, shingles, standing seam products, and skylights (Strong, 2011)
2.2 Mobility
Nowadays, hybrid and fully-electric vehicles are becoming a mainstream reality. Hybrid vehicle has gasoline engine and electric motor at the same time. Hybrid vehicle uses electric motor at low speed, for short distance and while waiting at the red light (Graham,2001). On the other hand, hybrid vehicle uses gasoline engine for performance drive, high speeds and long drive. Differently, fully-electric vehicle only consumes stored electric at the batteries. According to Simpson (2006), Gallagher (2011) and Erjavec & Arias (2007), green vehicles offer many benefits as following;
Fuel cost: As World population increase, the number of vehicle and therefore the
amount of oil consumption increase. As a result, the number of oil reserves decrease, the number of oil price increase according to supply-demand relation. Fuel cost benefits of the green vehicles probably the most obvious benefit. Hybrid vehicle saves approximately 40% fuel in the urban and 20% on the highway. The only fuel cost for electric vehicle is electric consumption while charging the battery.
Energy security: Oil is a finite energy source, in other words oil reserves will be
finished one day. Electric on the other hand, can be generated from renewables such as solar and wind energy. Therefore, electric as a source of energy is much more secure and available comparing to oil.
Tax benefits: Government implies tax deduction incentive on green vehicles in order to
encourage more people while buying their next vehicle. Electric vehicle owners do not pay motor vehicle tax while hybrid owners pay lower than gasoline or diesel engine vehicle owners due to tax benefits of green vehicles. Not only tax benefit, but also grant is given by some governments.
Lower greenhouse gas emissions: Clean air and healthy environment is possible with
reducing toxic emissions. Using hybrid vehicle reduce carbon and sulfur emissions significantly whereas electric vehicle eliminates greenhouse gas emission at all. For example, hybrid vehicle can reduce toxic emission 97% by using ethanol or biodiesel in place of gasoline.
Faster commuting times: In order to encourage more people for purchasing green
vehicles, major highways are starting to add lanes that can be only used by these vehicles. In addition, free parking spaces are available for green vehicles at some carpark, parking garage and roadside park.
Power efficiency: Since, weight of the materials that are used in green vehicles are less
than traditional vehicles, they can not only maneuver and handle easier but also consume less energy. Furthermore, EVs do not need transmission at any speed and any type of road. In reality, frictions are occurred while transmitting generated power from engine to the tires. Thus, green vehicles use power more efficiently than traditional vehicles.
Furthermore, European Commission set their mobility aims as green mobility and release directives often. For instance, commission announce comprehensive new strategy to reduce CO2 emissions from new cars and vans sold in EU. According to new
strategy, average emission is limited to 120 grams per kilometer for passenger cars. All manufacturer’s newly registered vehicles must comply emission target by 2015. EC take this step forward and aims 95 grams of emission per kilometer for 2020. In addition, EC released proposal stating that information relating to fuel economy and CO2 emission of new passenger cars must be available for consumer in order to enable
them to make an informed choice. Additionally, commission offers super credit to the carmakers whose vehicles emit less than 50 grams of CO2 gas per kilometer.
European Commission Research & Innovation (2012) declared another important milestone that address the needs to green vehicles are Energy for a changing world package which signed by EU leaders to cut greenhouse gas emission of their countries by 20% until 2020.
3 Methodology
3.1 Green Building Design
3.1.1 Demo House Audit
Demo House was built before the Turkish National Energy Efficiency Regulation was published in 2008. Therefore, the comfort conditions are extremely low and heating costs are quite high. There are other problems in practice regarding the aesthetic and improper practices during construction.
Building audit is aiming to analyze current situation of the buildings in terms of energy use and comfort. Below information was included for the buildings;
- Building Envelope
- Openings and shading elements - Thermal bridges and airtightness
To determine the baseline energy, use of the district, below methodology have been used:
- Occupancy schedules, heating/cooling systems and equipment were collected from demo house,
- Thermal inspection conducted to determine heat loss/gains, bridges, air-tightness.
- Blower door test conducted to determine airtightness of the demo house. - HAP (Carrier) energy simulation software used for energy modeling.
3.1.1.1 Current Status of the Demo House
Demo house has general architecture of two-story family house with 148 m2 conditioned area that consists of 3 bedrooms, living room, 2 bathrooms and WC, kitchen and 2 verandas.
Figure 1 and 2, which are given below, represent overview and floor plans of the demo house respectively. Note that, figure 1 created via 3DS Max software while figure 2 created via AutoCAD software.
Figure 1: Demo House Overview
3.1.1.1.1
Building Envelope
Demo House was built with carcass system. Load-bearing system is composed of reinforced concrete columns and beams that are sitting on a concrete foundation. In addition, Demo House has 19 cm brick wall, 3 cm Extrude Polistren (XPS) insulation and American siding coating.
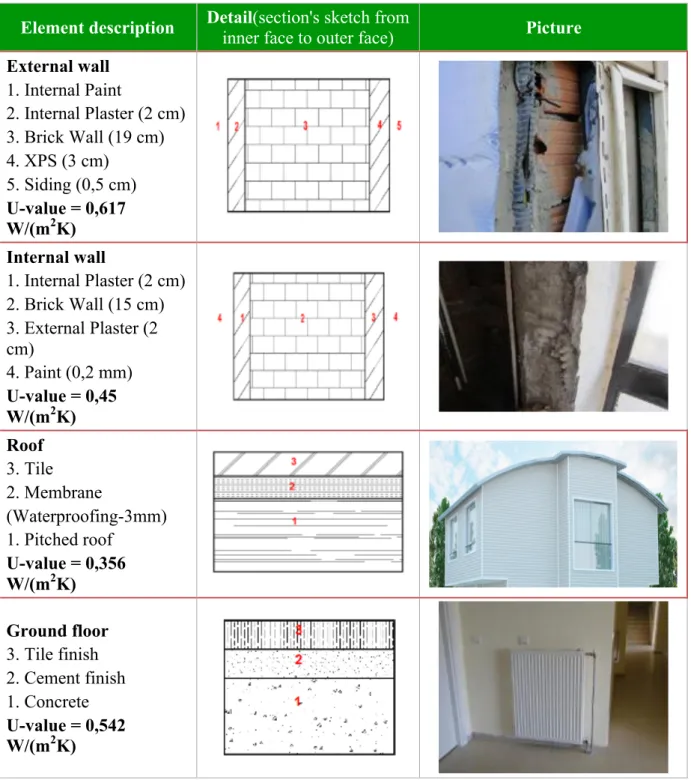
Table 1: Demo House Element Description
Element description Detail(section's sketch from inner face to outer face) Picture External wall 1. Internal Paint 2. Internal Plaster (2 cm) 3. Brick Wall (19 cm) 4. XPS (3 cm) 5. Siding (0,5 cm) U-value = 0,617 W/(m2K) Internal wall 1. Internal Plaster (2 cm) 2. Brick Wall (15 cm) 3. External Plaster (2 cm) 4. Paint (0,2 mm) U-value = 0,45 W/(m2K) Roof 3. Tile 2. Membrane (Waterproofing-3mm) 1. Pitched roof U-value = 0,356 W/(m2K) Ground floor 3. Tile finish 2. Cement finish 1. Concrete U-value = 0,542 W/(m2K)
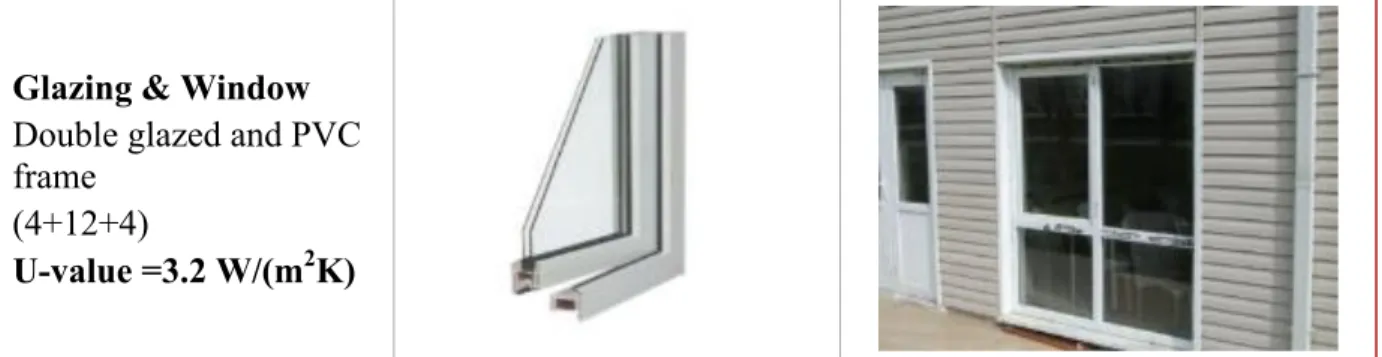
Glazing & Window
Double glazed and PVC frame
(4+12+4)
U-value =3.2 W/(m2K)
Table 1 prepared according to Turkish Standards 825 and it indicates detailed description of the demo house elements such as internal and external wall, glazing and window, ground floor and roof. For instance, external wall has 5 layers including internal paint, 2 cm internal plaster, 19 cm brick wall, 3 cm XPS insulation and 0,5 cm siding. In addition to layers of the building elements, thermal transmittance value of the building elements is given in the table. For example, by looking at the first row it can be understood that external wall has 0,617 thermal transmittance value regarding to layers and thickness it has.
3.1.1.1.2
Openings & Shading Elements
Demo House’s window units have polyvinyl chloride (PVC) frame with double-glazing. High infiltration heat losses are occurred due to poor condition of the PVC frame units. Blower test with rate of 4 air changes per hour confirms the heat losses through openings. (Kuban, 2015)
Table 2: Performance Evaluation of Current Window System
Type of Window (W/m K) U-Value
Daylight Permeability % Solar Energy Transmission % Shading Coefficient Double Glazed (4+12+4) 3,2 80 75 0,86 (Retrieved from: http://www.trakyacam.com.tr/Content/Pdf/Upload/isicam_performans.pdf)
Table 2 represents performance values of current window system. Current window system has high thermal transmittance with 3,2 (W/m K) that explains the reason of low performance. Furthermore, high daylight permeability and solar energy
especially in summer. In addition, there are no shading elements in any of the windows. Demo House only have curtains and stores in order to prevent brightness of the sunlight, therefore shading coefficient of the window gains important role.
3.1.1.1.3
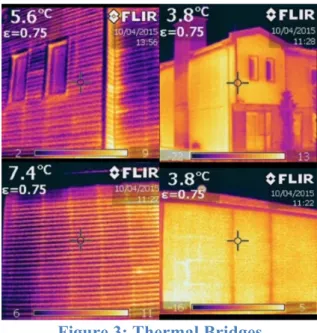
Thermal Bridges
Exterior parts of the reinforced concrete structure are insulated with 3cm XPS. However, insulation does not meet the required level of building code. Below, thermal bridges, heat losses and condensation on façade and interior wall are shown by thermal camera. Besides, heat losses have also been identified on roof cladding.
Figure 3: Thermal Bridges
Figure 3 is taken via thermal camera and express thermal bridges of the external wall. Colors indicates the amount of the heat loss, brighter the color more the heat loss.
Figure 4 states heat losses at openings. It can be interpreted that edges of the window cause heat losses since they are shown in reddish color. It explains that outside temperature is about 4 whereas window edges are 18, thus window edges causes heat losses and act as thermal bridge.
3.1.1.1.4
Airtightness
Blower door test was conducted on demo house in order to evaluate airtightness of the building. Test result calculated according to EN 13829, Method A. The result, which is 4.2 1/h, proves that demo house has very high infiltration losses through window units, doors and frames (Kuban, 2015). Sherman (1995) stated that high rate of air change per hour results significant energy losses at the building. Thus, conditions of the demo house are far from the global standards.
Figure 5: Blower Door Test
3.1.1.1.5
HVAC Systems and Domestic Hot Water
Demo House has individual gas fired boiler with 24 kW capacity to provide heating and DHW for the users. The heating distribution system consists of several horizontal pipes connected to a radiator in each room in each floor. Usually radiators are not equipped with thermostat to adjust individual room to desired comfort conditions; this results discomfort and inefficient energy use in the buildings.
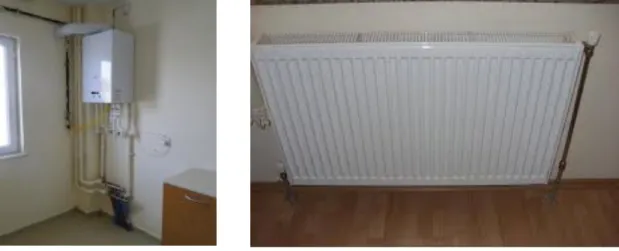
Figure 6: Gas fired boiler and radiator within dwelling
Since there is not proper HVAC system available, fresh air is provided by opening windows and doors most of the time. Air leaks are also a way of natural ventilation but causing significant energy losses. The domestic hot water is supplied by individual boiler equipment which is also provides hot water for heating as described above.
3.1.1.2 Energy Consumption Analysis of the Current House
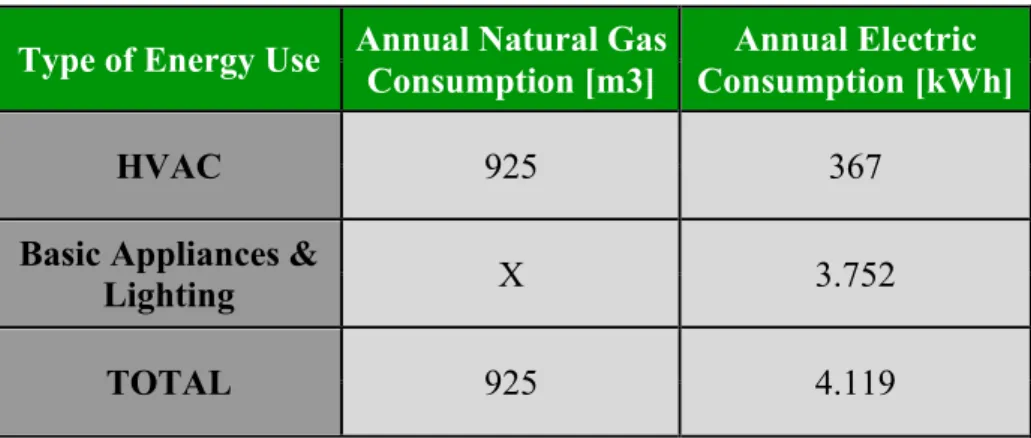
In this section, energy consumption of the demo house will be analyzed via HAP software. Significant percent of the electric consumption is made by lighting and appliances in the kitchen, living room, bedrooms and bathrooms. In fact, basic appliances’ and lighting’s electric consumption corresponds to 91% of the total electric consumption. HVAC only consumes electric in order to supply energy for the pumps that enables hot water circulation inside the dwelling. On the other hand, natural gas only consumed in order to heat the dwelling and domestic water. Therefore, HVAC is the only responsible action that consumes natural gas.
In total, 925 m3 natural gas and 4.119 kWh electric is consumed annually to meet the house energy demand in the current situation, in other words before retrofitting.
Table 3: Energy Consumption Analysis of the Current House
Type of Energy Use Annual Natural Gas Consumption [m3]
Annual Electric Consumption [kWh]
HVAC 925 367
Basic Appliances &
Lighting X 3.752
TOTAL 925 4.119
Table 4: Detailed Monthly Energy Consumption of the Current House
HVAC Monthly Energy Use Natural Gas (m3) Electric (kWh) Basic Appliances & Lighting Monthly Energy Use Natural Gas (m3) Electric (kWh) January 266 62 January X 296 February 190 55 February X 268 March 106 60 March X 296 April 22 53 April X 330 May X X May X 341 June X X June X 330 July X X July X 341 August X X August X 341 September X X September X 330 October 4 17 October X 296 November 109 58 November X 287 December 229 61 December X 296
Table 4 indicates monthly electric and natural gas consumption with purpose of use. The results are taken from HAP energy simulation software that calculate the energy consumption of the buildings regarding to schedule scenarios. Predictably, natural gas consumption increase in winter and reach the maximum in January. The top three months are January, December and February in terms of gas consumption. In March and November, which are known as mid-session months, gas consumption is at medium level. There isn’t any gas consumption from May until September. On the other hand, electric consumption shows more stable behavior and it’s change range is very small when compared to natural gas consumption.
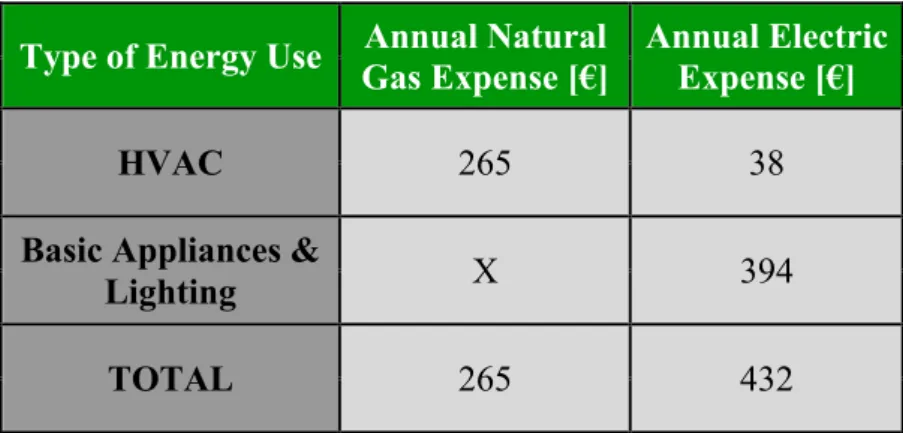
3.1.1.3 Energy Expense of the Current House
In the previous section, energy consumption analysis of the current house was investigated. By using section 3.1.1.2 consumption values, this section will help us to understand energy expenses of the current house. It should be noted that expenses are calculated according to energy prices in Turkey. Heating the dwelling cost 265€ of natural gas and 38€ of electric consumption. One could query why electric is used while natural gas is the energy source of heating. Electric is needed to run the boiler pump which enables hot water circulation inside the radiator. On the other side, basic appliances and lighting costs 394€ annually. In total 265€ of natural gas and 432€ of electric is consumed annually to meet the current house energy demand for a comfortable living zone.
Table 5: Energy Expense Analysis of the Current House
Type of Energy Use Annual Natural Gas Expense [€]
Annual Electric Expense [€]
HVAC 265 38
Basic Appliances &
Lighting X 394
Table 6: Energy Expense of the Current House (Monthly-Detailed)
HVAC Monthly
Energy Use Natural Gas [€] Electric [€]
Basic Appliances & Lighting Monthly Energy Use Natural Gas [€] Electric [€] January 76 7 January X 31 February 54 6 February X 28 March 30 6 March X 31 April 6 6 April X 35 May X X May X 36 June X X June X 35 July X X July X 36 August X X August X 36 September X X September X 35 October 1 2 October X 31 November 31 6 November X 30 December 65 6 December X 31
Table 6 states natural gas and electric expense with purpose of use. As it is expected, natural gas bill is higher in winter than in summer and mid-session. Highest bill costs 76€ in January. On the other part, electric expenses are much more stable but in total slightly higher than natural gas expense. In other words, electric consumption does not show difference between seasons as natural gas consumption shows. Current house electric expense is around 30€ per month.
3.1.2 Retrofitted House Audit
3.1.2.1 Insulation
3.1.2.1.1
Insulation of the Façade
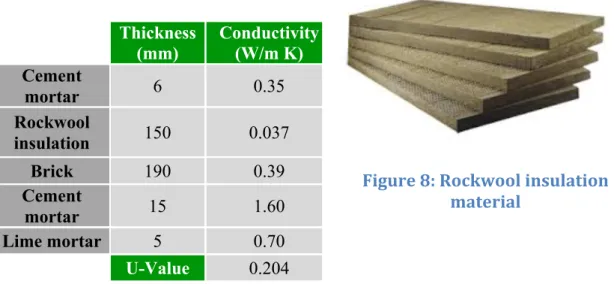
The objective of thermal insulation in buildings is to sustain a comfortable and hygienic indoor climate throughout the year, decreasing the heating and cooling demands (Thermal Insulation, n.d). Strategies to reach these targets are the use of innovative or standard low cost techniques or a combination of them. In this case, EPS, XPS and Rockwool and options, which are widely available at the market, are evaluated.
These solutions include the use of standard thermo-hygrometric materials, innovative high-performance products (thermal insulating paint or/and panel, or/and waterproofing membrane) and colors to optimize the solar absorption and reflection of the external envelope (Yenilmez, 2015). It is decided to implement Rockwool to reach the desired U value for the external wall which is 0.2 W/m2K. Rock wool has many advantages, such as high thermal resistance, fire and sound-proofing, availability as a local and natural material; widely available implementation, capability. Facades at demo house will be coated with 150 mm rockwool.
A Rockwool material is based on basalt as the main raw material. Through melting at high temperature, the material becomes a bio-fiber and is manufactured using high-speed centrifugal equipment. After additions of special adhibitor and dust-prevention oil it is formed. (Dahl, Clausen & Hansen, 2011)
Table 7: Thermal Insulation description Thickness (mm) Conductivity (W/m K) Cement mortar 6 0.35 Rockwool insulation 150 0.037 Brick 190 0.39 Cement mortar 15 1.60 Lime mortar 5 0.70 U-Value 0.204 Figure 8: Rockwool insulation material
Table 7 states outside wall layers and corresponding conductivity of materials. Values are calculated from TS - 825. According to above table, after insulation is implemented to the outside wall, the U value changes from 0.617 to 0.204 W/m2K.
3.1.2.1.2
Insulation of the Attics
Easiest and cost effective way of roof insulation is to use mineral wool materials which also show high thermal performance and fire resistance (Energy Saving Trust, n.d). Glass wool, locally produced and installed is well-known insulation material which can be easily installed on existing insulation material, in this case 8-10 cm glass wool.
Isover (n.d) expressed the glass wool production as following: “Glasswool is made from natural sand to which recycled glass (cullet) and fluxing agents are added. The material is melted at 1100°C in an electric furnace, and then forced through precision drilled holes in high speed spinning disks, to form fibers. Binding products and other additives required to give specific characteristics to different products are then added as fibers that fall onto moving collection belts. The glasswool mat is then polymerized, heated and passed through compression rollers where it is cured to provide a product of the required thickness and density”. In total 300 mm glass wool will be implemented as a blanket application at the garret of the building.
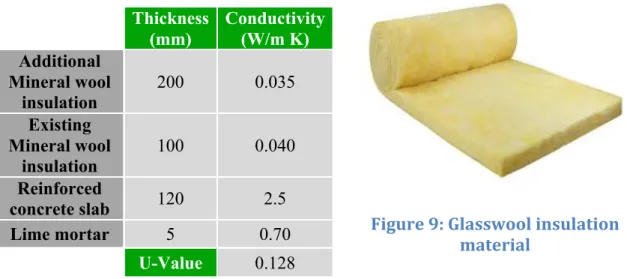
Table 8: Roof insulation Layers Thickness (mm) Conductivity (W/m K) Additional Mineral wool insulation 200 0.035 Existing Mineral wool insulation 100 0.040 Reinforced concrete slab 120 2.5 Lime mortar 5 0.70 U-Value 0.128 Figure 9: Glasswool insulation material
Table 8 indicate roof layers property and corresponding conductivity of the layer materials. By applying roof insulation, U value of the attic changes from 0.350 to 0.128 W/m2K according to Turkish Standard 825.
3.1.2.1.3 Cost of the Insulation Retrofitting
Table 9: Cost of the Insulation Retrofitting
Insulation Retrofitting Price [€/m2] Application Area [m2] Total Cost [€] Façade Insulation 35 145 5.075 Attic Insulation 10 80 800
Table 9 express façade (outside wall) and attic (roof) insulation cost details. Labor cost is taken into consideration while preparing above table. Before starting to analyze insulation costs, it should be noted that labor costs are cheaper in Turkey when comparing to European countries. Table express that unit price of façade insulation is higher than attic insulation. It is simply because, cost of materials and application to insulate outside wall is more expensive than attic insulation. Even tough application area of the façade insulation is less than attic, cost of insulating outside wall is more expensive than attic due to difference at unit price cost. According to price offer that is received from world-wide known insulation company, cost of façade insulation is
3.1.2.2
Glazing
Comparison of properties for the two different triple glazing are provided under Table 10 below. Triple glazing insulating glass units designed to improve the thermal efficiency of residential properties; reduce the amount of heat loss through the windows and can also allow more heat/energy from the sun through the glass. Cross section of a triple glazing window is shown in figure 10 which is given below.
Table 10: Comparison of two different triple glazing unit Heat Retaining Glazing Non – Heat Retaining Glazing Thickness &Air Space Information (mm) 4*+9+4+9+*4 4*+9+4+9+*4 4*+12+4+12+*4 4*12+4+12+*4 4*+16+4+16+*4 4*+16+4+16+*4 Nominal Thickness (mm) 30 30 36 36 44 44 Daylight (EN 410) Transmittance % 69 63 Reflectance Outdoor % 14 13 Solar Energy (EN 410) Reflectance Outdoor % 28 30 Absorption % 34 38 Direct Transmittance % 39 32 Solar Factor 0,48 0,39 Shading Coefficient 0,55 0,45 Thermal conductivity (U value) W/m²K (EN 673) Dry Air 1,2 0,9 0,9 0,7 0,7 0,6 **Argon 1,2 0,9 0,9 0,7 0,6 0,6
(Retrieved from: www.sisecamduzcam.com.tr)
After careful inspection of above table, it is decided that existing conventional window units will be replaced with PVC framed triple glazed windows (heat retaining) with a U-value of 1,2 W/m2K in order to minimize heat losses and increase thermal efficiency.
3.1.2.2.1 Cost of Glazing Retrofitting
Table 11: Cost of Glazing Retrofitting
Glazing Retrofitting [€/m2] Price Application Area [m2] Total Cost [€] Triple Glazing 120 45 5.400
Table 11 shows triple glazing retrofitting cost details. First of all, cost of glazing retrofitting table prepared in accordance with received price offer from from one of the best national producer that is given in APPENDIX C. Total cost is calculated as turnkey price; therefore, unit price includes labor cost as well. Cost of replacing standard double glazing windows with argon filled triple glazing is 5.400€.
3.1.2.3
Lighting
Below figure 11 represents lighting retrofitting plan for each floor and figure 12 shows LED panels configuration after implementation.
Figure 12: LED lights
3.1.2.3.1 Cost of Lighting Retrofitting
Table 12: Cost of LED Lighting Retrofitting
Lighting Retrofitting Price [€/Unit]
Application Quantity [Unit] Total Cost [€] 30x60 cm 18/20W LED Panel 35 25 875 12W Downlight LED Armature 15 5 75 12W Surface Mounted
Etange LED Armature 15 8 120
5W Surface Mounted
Applique 30 12 360
Table 12 indicates cost details of LED lighting retrofitting. Current bulbs are replaced with twenty-five 30x60 cm 18/20W LED panels, five 12W downlight LED armatures, eight 12W surface mounted etange LED armatures and twelve 5W surface mounted appliques. In total, lighting retrofitting costs 1.430€.
3.1.2.4
Photo-Voltaic
Solar energy is tried to use at the maximum level. 8 kW power is to be integrated on the roof of demo house as Building Integrated Photovoltaic (BIPV) system. Six strings and five arrays configuration will be implemented (6x5). In this
weight of panels and tiles are almost equal, static of the building will not be affected. Therefore, BIPV systems not only produce electricity but also act as a roof element.
Figure 13: BIPV and Carport System
Additionally, a 7 kW solar energy system will be established on the carport canopy. Six strings and four arrays configuration will be implemented (6x4). Carport canopy system will satisfy two different benefits, which are production of electricity and preserve car from the direct sunlight. In total these two on-grid systems will provide 15 kW.
Table 13 prepared by using PV*Sol simulation program. Location is selected as Anadolu University Airport, which is 4 km far from demo house, since it was the nearest location that is available at simulation program in Eskisehir. Furthermore, panels are selected from AXITEC Gmbh and inverter is selected from SMA for both systems. (See APPENDIX B)
Table 13: Solar Energy Contribution
Intervention Annual Electricity Generation (kWh) Building Integrated Photo-Voltaic (8kWp) 10.129,20 Carport Application (7kWp) 7.959,40
Table 13, indicates the annual electricity generation by PV systems, in other words annual solar energy contribution on demo house electricity demand. 8 kW BIPV generates 10.129,20 kWh while 7kW carport application does 7.959,40 kWh annually. In total, 18.088,6 kWh electricity generated by implemented Photo Voltaic systems.
If the systems are improved, more solar contribution can be gained. With today’s technology only 13-14% of the available irradiation can be transferred into electricity generation with mass produced cells (Honsberg & Bowden, n.d).
3.1.2.4.1 Cost of Photo-Voltaic Retrofitting
Table 14: Cost of the Photo-Voltaic Application
Photo- Voltaic Retrofitting Price [€/kW] Application Power [kW] Total Cost [€] BIPV 1.150 8 9.200 Carport PV Application 1.250 7 8.750
Table 14 represents photo-voltaic application cost. Carport PV application unit cost is more expensive than BIPV because it contains cost of the carport construction. All unit costs include labor cost, therefore total cost is calculated as turnkey price. BIPV system costs 9.200€ for 8 kW installed power while Carport PV system costs 8.750€ for 7 kW installed power. In total PV systems cost 17.950€ for 15 kW installed power.
3.1.2.5
Energy Consumption Analysis of the Retrofitted House
In this section, energy consumption of the retrofitted house is analyzed. (See
APPENDIX A) According to table 15, lighting and appliances in the kitchen, living
room, bedrooms and bathrooms are main responsible of the electric consumption. Indeed, lighting’s and basic appliances’ electric consumption account for 95% of the total electric consumption. HVAC action consumes electric in order to supply energy for the pumps that enables hot water circulation inside the dwelling. On the other side, natural gas only consumed in order to heat the dwelling and hot domestic water. Thus, HVAC is the only responsible action that consumes natural gas.
In total, 235 m3 natural gas and 2.908 kWh electric is consumed annually to meet the house energy demand after retrofitting.
Table 15: Energy Consumption Analysis of the Retrofitted House
Type of Energy Use Annual Natural Gas Consumption [m3] Consumption [kWh] Annual Electric
HVAC 235 146
Basic Appliances &
Lighting X 2.762
Table 16: Monthly Consumption Analysis of the Retrofitted House HVAC Monthly Energy Use Natural Gas (m3) Electric (kWh) Basic Appliances & Lighting Monthly Energy Use Natural Gas (m3) Electric (kWh) January 77 24 January X 226 February 50 22 February X 204 March 18 24 March X 226 April X 17 April X 236 May X X May X 244 June X X June X 236 July X X July X 244 August X X August X 244 September X X September X 236 October X 4 October X 226 November 24 23 November X 218 December 65 24 December X 226
Table 16 states monthly electric and natural gas consumption with intended use. As mentioned before, results of HAP energy simulation software, which calculates the energy consumption of the buildings regarding to schedule scenarios, is used to prepare above table. As expected in the northern hemisphere, natural gas consumption increase in winter reach the maximum in January and decrease in spring and reach zero in April until November. January, December and February are the three months that has highest natural gas consumption. Natural gas is consumed at medium level in March and November, which are known as mid-session months. From May until September natural
behavior and it’s change range is very small when compared to natural gas consumption.
3.1.2.6
Energy Expense of the Retrofitted House
In section 3.1.2.5, energy consumption analysis after retrofitting was
investigated. Using consumption values expenses are calculated. (See APPENDIX A) Note that expenses are calculated according to energy prices in Turkey and converted into Euro. This section will help us to see how much energy is used for each action. According to table 17, in order to heat the dwelling 67€ of natural gas and 15€ of electric is consumed. On the other hand, basic appliances and lighting costs 288€ annually. In total 67€ of natural gas and 303€ of electric is consumed annually to meet the retrofitted house energy demand for a comfortable living zone.
Table 17: Energy Expense Analysis of the Retrofitted House
Type of Energy Use Annual Natural Gas Expense [€]
Annual Electric Expense [€]
HVAC 67 15
Basic Appliances &
Lighting X 288
Table 18: Energy Expense of the Retrofitted House HVAC Monthly Energy Use Natural Gas [€] Electric [€]
Basic Appliances & Lighting Monthly Energy Use Natural Gas [€] Electric [€] January 22 7 January X 24 February 14 6 February X 21 March 5 6 March X 24 April 6 6 April X 25 May X X May X 26 June X X June X 25 July X X July X 26 August X X August X 26 September X X September X 24 October X 2 October X 23 November 7 6 November X 24 December 19 6 December X 31
Table 18 tells us monthly electric and natural gas consumption with intended use. Above table created via HAP energy simulation software regarding to determined schedule scenario inputs. Most expensive natural gas bill come out in January as it is expected. Not only January but also December and February has high natural gas consumption. Mid-sessions have medium consumption therefore medium expense. After retrofitting natural gas is not consumed from May until September. It can be seen that natural gas is consumed more in winter. On the contrary, electric expense shows more stable behavior when compared to natural gas expense. Also its expense change
3.2 Mobility
3.2.1 Technical Specifications of Vehicles
Diesel, Gasoline, Hybrid and Electrical Vehicle comparison is shown below. It should be noted that Turkish citizens are paying one of the most expensive taxes on vehicles ranging from %60 to %200, depending on engine volume (İstanbul Vergi Dairesi Başkanlığı, 2016).
Assume that household decide to change vehicles that they have. He or she have a tendency to buy environment friendly vehicle since people are talking about latest developments on hybrid and electrical vehicles. Therefore, one of the household is oscillating between diesel and electrical vehicle while other person is thinking to purchase whether gasoline small segment vehicle or a hybrid one. However, he or she is uncertain whether this investment worth or not. In order to solve this uncertainty, comparison between vehicles’ consumption and payback period analysis of the investment have been made in the section 4.2.1.
Table 19: Technical Specifications of Hybrid and Gasoline Yaris
Vehicle Fuel Consumption (lt/100km) C02 Emission (gr/100km) 1.5 Yaris Hybrid Cool 3,3 82 1.33 Yaris Style Multidrive S (Gasoline) 5,1 119
(Retrieved from:
https://www.toyota.com.tr/new-cars/yaris/index.json#/publish/compare_engines/selection=1NZ-FXE-15H--77ECVT) Table 19 states fuel consumption and CO2 emission of the hybrid and gasoline
vehicles. Hybrid vehicle not only has lower fuel consumption but also lower CO2
emission. In fact, most of the time catalog consumption values don’t meet the real cases mostly because urban traffic. However, one can trust hybrid vehicle consumption and emission catalog values since electrical engine covers all the demand between 0 and 40 km/h, which causes main consumption and emission at start. Therefore, in real life it is
expected hybrid vehicle consumes approximately 2 liters of fuel and 40 gr of emission less than gasoline vehicle per 100 km.
Figure 14: Yaris Hybrid and Yaris Style Multi-drive S
Above figure represents hybrid Yaris (electric-gasoline engine) and Yaris style multi-drive S (gasoline engine) vehicles.
Table 20: Technical Specification of BMW i3 and 2.16d
Vehicle Fuel Consumption (lt/100km) Fuel Consumption (kWh/100km) C02 Emission (gr/100km) BMW i3 X 12,9 0 BMW 2.16d Active Tourer 4,0 X 10⁵
(Retrieved from:
http://www.bmw.com.tr/tr/all-models/bmw-i/i3/2013/technicaldata.html#tab-0)
Table 20 states fuel consumption for diesel and electricity for electrical vehicles and CO2 emission for both vehicles. Diesel vehicle consumes around 4 liters while
electrical vehicle consumes 12.9 kWh per 100 km. It should be noted that, electrical vehicle doesn’t have any CO2 emission.
Figure 15: BMW 2.16d Active Tourer and BMW i3
Above figure shows BMW 2.16d Active Tourer (diesel engine) and BMW i3 (electric engine) vehicles.
3.2.2 Mobility Expenses
Table 21: Consumption Assumptions of Vehicles
Vehicle Fuel Consumption (lt/100Km) Energy Consumption (kWh/100Km) Annual Diesel Consumption (€/15.000Km) Annual Gasoline Consumption (€/15.000Km) Annual Electricity Consumption (€/15.000Km) BMW i3 x 12,9 x x 193,5 BMW 2.16d Active Tourer 4,0 x 675 x x 1.5 Yaris Hybrid Cool 3,3 x x 673,2 x 1.33 Gasoline Style Multidrive S 5,1 x x 1040,4 x
Table 21 indicates, annual energy consumption and its monetary equivalent for 15.000 Km annual driven distance. As expected, electrical vehicle has the lowest fee by far for charging the vehicle for specified distance. Moreover, Hybrid and diesel vehicle have almost the same fee for filling the tank to cover specified distance. Hybrid and diesel vehicle’s oil consumption fee is lower than gasoline vehicle but higher than electrical vehicle. Furthermore, gasoline vehicle has the highest oil consumption fee to
cover specified distance even though it has small engine volume comparing to the others.
Table 22: Tax and Maintenance Assumptions
Vehicle Annual Motor Vehicle Taxes (€) Annual Maintenance Cost(€) Total operating expenditures BMW i3 x 50 50 BMW 2.16d Active Tourer 550 300 850 1.5 Yaris Hybrid Cool 312 140 452 1.33 Gasoline Style Multidrive S 312 140 452
Table 22, indicates annual motor vehicle taxes in Turkey in 2016 and annual maintenance cost which are taken from Toyota and BMW service. Turkish government is collecting annual motor vehicle tax related to engine volume and age of the vehicle. Therefore, the newer car and higher engine volume, the higher tax. In terms of maintenance cost, Diesel BMW has the highest expense due to expensive spare parts and heavy maintenance of diesel vehicles. Toyota models maintenance costs are slightly lower than diesel BMW, however higher than BMW’s electrical vehicle. According to Toyota authorized service, there is no maintenance cost difference between hybrid and gasoline model. On the other hand, electrical vehicle has the lowest maintenance cost due to EV working principle’s simplicity.
Insurance cost is neglected since decision will be made depending on the engine of the vehicle and comparison is made between same brand.
4 Findings
4.1 Building Retrofitting
This section will inform us about the results of building retrofitting. In addition, by looking carefully at this chapter one can make decision to invest on green energy system easier than before. Cost of building retrofitting, annual retrofitting saving and payback period analysis of the intervention is investigated respectively.
Table 23: Cost of Building Retrofitting
Building Retrofitting Unit Price [€/Unit] Quantity [Unit] Cost [€] Façade Insulation 35 145 5075 Attic Insulation 10 80 800 Triple Glazing 120 45 5400 30x60 cm 18/20W LED Panel 35 25 875 12W Downlight LED Armature 15 5 75 12W Surface Mounted Etange LED Armature 15 8 120 5W Surface Mounted Applique 30 12 360 BIPV 1150 8 9200 Carport PV Application 1250 7 8750
Cost of building retrofitting summary is given in Table 23 with type of retrofitting action. It also shows unit price and applied quantity of regarding retrofitting action. Photo-voltaic retrofitting is more expensive than other building retrofitting since their unit prices are the highest. Lighting retrofitting cost 1.430€ while new insulation cost 5.875€ in total. Due to façade insulation’s high unit price and quantity façade
insulation cost much than attic insulation. Replacing double glazing with triple glazing cost 5.400€. All in all, building retrofitting actions cost 30.655€.
Table 24: Annual Retrofitting Savings
Type of Energy Building Envelope Saving [€]
Photo-Voltaic Implementation Saving [€]
Natural Gas 198 X
Electric 129 2171
Table 24 express result of retrofitting actions in terms of savings annually. Note that in Turkey government guarantee to buy electric generation which derives from renewable energy for 10 years with price of 0.12 Euro cent. In this case it is assumed that all generated electricity is sold to the national grid since system was installed as on-grid system. Therefore, biggest contribution comes from photo-voltaic implementation which saves 2.171€ annually. Photo-Voltaic does not have any effects on natural gas saving. On the other hand, building envelope contributes 198 of natural gas and 129€ of electric savings annually. In total, building envelope retrofitting saves 327 of energy annually. All in all, as a result of building retrofitting actions 2.498€ can be saved annually.
Table 25: Economic Analysis of Building Retrofitting
Total Retrofitting Cost [€] Annual Retrofitting Saving [€/yr] Payback Period [yr] 30.655 2.498 12,3
Table 25 states economic analysis of building retrofitting including total cost, annual saving and payback period. In previous sections total retrofitting cost and annual retrofitting savings are analyzed. In this section as the main objective of the thesis payback period is calculated. Payback period can be calculated as total retrofitting cost divided by annual retrofitting saving. As a result, all building interventions amortize itself in 12 years and 4 months.
Table 26: Summary of the U-Value of building elements Building Elements Before Retrofitting (W/m2K) After Retrofitting (W/m2K) External Wall 0,617 0,204 Internal Wall 0,45 0,45 Roof 0,356 0,128 Ground Floor 0,542 0,542 Internal Floor 1,83 1,83 Window 3,2 1,2
Table 26 indicates thermal transmittance rate of building elements in case of before and after retrofitting condition. According to table that is calculated via Turkish
Standards 825, biggest thermal transmittance decrease seen for glazing alteration. 15 cm
rock wool insulation also has significant effect on external wall thermal transmittance that decrease from 0,617 to 0,204. Also, rate of attic thermal transmittance decreased after intervention. Since there is not applied interventions on internal wall, ground floor and internal floor, thermal transmittance rate of this elements remain same.
4.2 Mobility
4.2.1 Payback Period Analysis of Mobility Decisions
Table 27: Price of Vehicles
Vehicle Price (€) BMW i3 48.000 BMW 2.16d Active Tourer 39.920 1.5 Yaris Hybrid Cool 20.560 1.33 Gasoline Style Multidrive S 19.220