*TRS
Technology, Networks and Society
e-planning
| networks | e-learning | e-government
Internal Report TRS 06/2019
Títle
Adding Energy Star rating Schema to Android
Applications on Google Play Store: An example of
a Preventive Power Saving Model
Author(s)
Abdullah Mahmoud Almasri, Prince Sultan U.
Luís Borges Gouveia, UFP
Month, year
October, 2019
Local de presença Web http://tecnologiaredesesociedade.wordpress.com Repositório de trabalho científico *trs http://bdigital.ufp.pt/handle/10284/3787
Universidade Fernando Pessoa Praça 9 de Abril, 349
2
A
DDINGE
NERGYS
TARR
ATINGS
CHEMA TOA
NDROIDA
PPLICATIONS ONG
OOGLEP
LAYS
TORE:
ANE
XAMPLE OF AP
REVENTIVEP
OWERS
AVINGM
ODELAbdullah Mahmoud Almasri1 and Luis Borges Gouveia2
1 Prince Sultan University, Riyadh, Saudi Arabia, [email protected]
2 University Fernando Pessoa, Porto, Portugal, [email protected]
Abstract.
A common issue that is shared among android smartphones users was and still related to saving their batteries power and to avoid the need of using any recharging resources. A big number of researches were conducted in the general field of "Saving Energy in Android Smartphones". Another big number of researches were also conducted in the subfield of "Saving Energy in Android Smartphones at the Application Layer". Both fields did generate a good amount of proposed methodologies, models, frameworks and algorithms that were provided as market products or approaches. However, here we propose a solution in the form of an addition to Google Play Store this addition will guide the end user to find and choose the best application in terms of power consumption based on his/her smartphone model. A review of the relevant existing literature is provided herein specifically covering various energy-saving techniques and tools proposed by various authors for Android smartphones.
Keywords: Android smartphones, Android applications, Power-saving, energy star rating,
preventive power saving model
1. Introduction
Smartphones have grown to become constant companions to humans as they are considered to offer indispensable help in easing the daily life of individuals. They are largely supported by numerous and diverse applications which help in for instance, directing us to our destinations, storing tickets when we travel, facilitate communications with friends and family, and entertain with videos or music.
3
Due to the underlying importance of these mobile smart devices, there have been increasing concerns, particularly from users, regarding battery-drain which puts limitations on their usage. Based on the existing literature, a significant share of power consumption in these smart devices is largely caused by applications that are installed on the devices (Taleb et al, 2013; Li, Tran & Halfond, 2014).
Depending on the applications’ functionality, they entail activities such as data downloading, content display, and use of built-in-sensors such as GPS (Global Positioning System) related sensors. There are various components of mobile smart devices that facilitate the above activities including; GPS sensors, device’ display, the CPU, and network interfaces among others.
Consequently, activities/functions of different Android smartphone applications increase the energy consumption of any of the above-mentioned components. As a result, there has been a lot of effort in the existing literature geared towards identifying and investigating the underlying potential for energy savings in relation to these smartphone applications at applications layer and OS layer levels (Moamen & Jamali, 2015; Zhang, et.al., 2010).
2. State of the Art
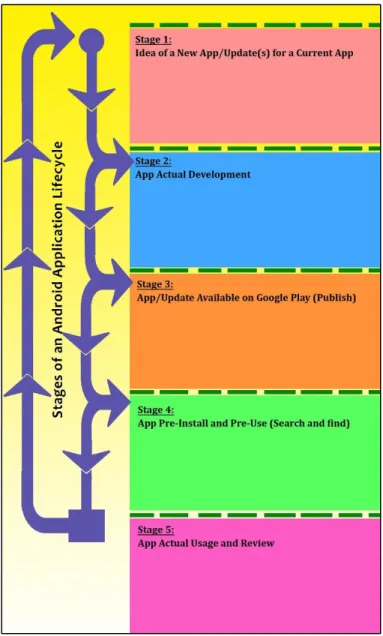
2.1Identify the Average Android-Application Lifecycle
In order to demonstrate the main issues with current power-saving approaches, first we proposed creating a lifecycle that shows the main average stages of an average android application. The proposed cycle is shown in Figure.1:
4 Figure 1: Average Android-Application Lifecycle
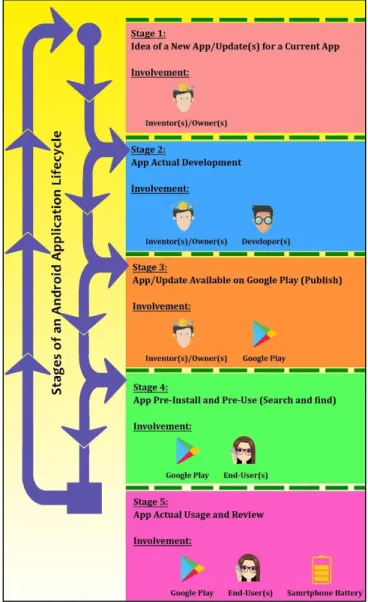
2.2List the Concerned Parties and Identify their Involvement
Following the previous step In order to demonstrate the main issues with current power-saving approaches, we list the parties which are involved in our android application lifecycle as shown in figure.2:
5
The next item to demonstrate is the involvement of the parties among the different stages of our android application lifecycle. The involvement is described in figure.3:
Figure 3: Involvement of Parties among the Different Stages of an Android Application Lifecycle.
2.3Identify the Status of an Android Application Among Different Stages of an Android Application Lifecycle
Following the above, we need to List the main statuses of an android application in terms of its presence in an android smartphone also among the different stages of our android application lifecycle, the two main statuses were Outside the End-User’s Phone (Under development or
6
Available on Google Play) or Inside the End-User’s Phone (Installed & Running). Figure.4 will map the above statuses to the different stages of our android application lifecycle:
Figure 4: Status of an Android Application among Different Stages of an Android Application Lifecycle
2.4Identify the Main Current Power-Saving Approaches
In order To summarize the current power saving approaches that are used in today’s smartphones the following classification were made: Approach 1, follows the philosophy of “Simulate and estimate” the power consumption of and android application before making it available for
end-7
user(s) by using techniques that may include but not limited to green coding, energy-aware designs, smartphone batteries simulators, historical analytical data, etc..
Approach 2, follows the “Monitor, detect and control” philosophy, so it applies this on the behavior of an android application while it is running on an end-users phone and optimizing the power consumption. Approach 3, is more about Sacrifice smartphones technology or performance by switching off a number of features for the sake of saving power philosophy.
2.5 Show the usage of current power-saving approaches among the stages of the android application lifecycle
The next stage is to show the usage of the above approaches among the stages of the android application lifecycle and from the above, Approach 1 is used in stage 2 of our android application lifecycle and involves the app inventor(s), the app developer(s) and the Android Development Platform(s), while Approaches 2 and 3 are used in stage 5 of our android application lifecycle and involve Google Play, The End-user(s) and The End-user's phone(s). The usage is shown more clearly in Figure .5
8 Figure 5: Usage of Current Power-Saving Approaches among the Stages of the android application lifecycle
3. Reviewing the Efficiency of Current Power-Saving Approaches Used Among Different Stages of an Android-Application Lifecycle
3.1Estimate and simulate power consumption approach
Westfield & Gopalan (2016) contribute towards finding a solution towards power saving techniques in smartphones through proposing an approach called Orka. According to Westfield & Gopalan (2016), the Orka approach works by providing feedback to developers of software used
Approach 1: “Simulate and estimate” the power consumption of and android application before making it available for end-user(s) by using techniques that may include but not limited to green coding, energy-aware designs, smartphone batteries simulators, historical analytical data..etc.
Approaches 2: Monitor, detect and control the behavior of an android application while it is running on an end-users phone and optimizing the power consumption.
Approach 3: Sacrifice smartphones technology or performance by switching off a number of features for the sake of saving power
9
in smartphones. The proposed approach is designed to provide feedback on the basis of API usage by an application as well as providing feedback on the usage of energy of the application, down to the level of the method used (Westfield & Gopalan, 2016).
The authors of the study believe that it is relatively important that energy usage of software is not disassociated from energy usage of the hardware, hence Orka is designed to generally provide feedback on the consumption of energy as a result of usage of hardware (Westfield & Gopalan, 2016). Orka carries out tests on the app through using an execution trace that is dynamically created and generated through a test script that is provided by the developer of the application. In addition, the authors suggest that the proposed Orka performs the analysis on the hardware running on emulators instead of running on physical devises (Westfield & Gopalan, 2016).
Orka pulls estimations of internal energy from the emulator, after running the application, in order to provide feedback on the basis of the different components utilised. Using the energy consumption data/metrics provided by the Orka approach, the developer of the application can make adjustments to their code in order improve the energy efficiency of their application.
According to Westfield & Gopalan (2016), Orka was designed specifically for applications installed on the Android Operating System (OS). Despite the fact that Orka appears to operate in a similar manner as energy profiling solutions presented in the existing literature, Westfield & Gopalan (2016) suggest that Orka’s independence from the hardware makes it different from other energy profiling systems/solutions. However, it is worth noting that, the approach used in the study does not necessarily make readings on the basis of battery discharge and it does not attempt to estimate accurately an application’s energy usage.
10 Figure 6: Follow and implement Energy-Efficient Development Best Practices
Wang, et al., (2017) are concerned with the energy testing stage of the app development as they believe that applications developers ought to understand both, the rate of energy consumption of their applications and the underlying reason why energy is consumed by the application. In their paper, Wang, et.al., (2017) propose E-Spector as a potential online based tool/method the inspects energy usage, visualises the application’s energy consumption online in a manner that is instant, and it can also inform the developer what happened behind each hotspot of energy on an energy curve. According to Wang, et al., (2017), E-Spector mainly relies on static analysis and the instrumentation of the application to collect the underlying activities in real time from the execution of an application.
11
These activities are then presented on an instant energy curve in such a way that the user is able to recognise what actually took place behind each spike in energy usage (Wang, et al., 2017). The authors believe that their proposed solution is particularly more beneficial because it does not require hardware meters like many other solutions in order to calculate instant the power figures for each application at runtime since it is an online-based software solution/power model (Wang, et al., 2017).
Furthermore, Wang, et.al., (2017) suggest that E-Spector provides detailed breakdowns of energy for each running process on the device, including applications running both background and foreground services. In their study, Wang, et.al., (2017) evaluated and tested the overhead and accuracy of E-Spector and the results indicate that using E-Spector has the ability of providing an estimation of energy within a less than 10% error, as well as providing an estimation of energy overhead within a less than 4% error. However, tests energy model used by the authors only considers three hardware consumers of energy including; network (both cellular and WiFi network), the screen and the CPU, instead of considering all energy consumers thus presenting a key limitation to the study.
12 Figure 7: Approach B: Thin Client Design (Cloud based)
Moamen & Jamali (2015) are concerned with finding a solution that to sensor dependent applications that demand a lot of the phone’s energy in order to continuously use sensor feed to provide services. The authors of the study believe applications that simultaneously monitor multiple sensors tend to amplify the problem as they consume significant amounts of the phone’s battery (Moamen & Jamali, 2015). In their paper, Moamen & Jamali (2015) propose ShareSens as a potential solution to the above problem. ShareSens is an approach to merge applications’ independent sensing requirements.
According to the authors of the report, this is achieved through utilising sensing schedulers for the sensors that would essentially determine the underlying lowest sensing rate which would mainly satisfy all the existing requests (Moamen & Jamali, 2015). Custom filters are then used to only send out the required data to each application on the device. Based on the report, any sensing requests that are made through the authors’ proposed ShareSens API are generally sent to the
13
respective schedulers that determine the overall optimum rates for sensing in order to satisfy all the prevailing requests. Based on the experimental tests carried out on the ShareSens’ capabilities, the authors found that there is significant power savings that can be attained when the ShareSens solution is used particularly when overlapping sensing requests exist (Moamen & Jamali, 2015). However, the current form of the ShareSens approach does not allow programmers to opportunistically choose sampling rates that are higher once they available, at a relatively low marginal cost.
In their study paper, Min, et.al., (2015) address the various factors that significantly impact phone batteries to the point of making their existing battery models become outdated and they further explore the initial approach that was aimed at helping phone users to understand the underlying cause and effect between the life of a phone’s battery their physical activity. Min, et al., (2015) proposed Sandra, a battery information adviser for smartphones that is designed to be mobility-aware. Sandra was designed with various key features including; a forecaster that provides estimates of battery life under different conditions of the user’s future mobility, and an archive that is designed to provide past battery drain rates retrospective summary categorised by different conditions of mobility (Min, et al., 2015).
Based on the tests carried out the proposed approach, Sandra was found particularly helpful to smartphone users (Min, et al., 2015). However, the tool that Min, et al., (2015) presented is neither an omniscient battery predictor nor a reconfiguration tool that extends batter’s life like Power monitor v2. According to Min, et al., (2015), Sandra’s main goal is user enlightenment regarding new causal factors of their changes in mobility that impact the standby life of the phone batteries.
Besides choosing between network interfaces, the strength of the device signal has an influence on the consumption of the device’s network. In their study, Schulman, et al., (2010), proposed a scheduling algorithm that is designed to make use of a network signal with high strength.
Their philosophy is that applications have to preferentially communicate when there is a strong network signal in order to realise energy savings, either through deferring communications that are not urgent or through advancing communications that are anticipated in order to coincide with strong signal periods (Schulman, et al., 2010). To take advantage of a strong signal, Schulman,
14
et al., (2010) developed a scheduling algorithm that focused on two specific kinds of applications, including streaming applications on one hand and sync applications on the other. For streaming applications, the algorithm that the authors developed modulates the traffic stream in order to match with characteristics of radio energy while for sync applications the algorithm utilises flexible synchronisation intervals (Schulman, et al., 2010).
Their proposed energy-aware scheduling algorithm thereby takes into account tail energy as well as communication energy. Through their simulations and tests, Schulman, et.al., (2010) show that energy savings of up to 60% for on-demand streaming and up to 10% for synchronisation of email were attainable.
In a study conducted by, Zhang, et.al. (2010), the authors proposed the use of an online power estimation tool and a model generation framework in their contribution towards improving power-saving capabilities of Android smartphones on both the applications layer and the OS layer. Zhang, et.al. (2010) proposed a tool called the PowerTutor which was designed as an online power estimation system for the Android platform smartphones. The tool provides real-time, accurate power consumption estimates for components of the smartphone that are power intensive such as display, the CPU, cellular interfaces, GPS, and Wi-Fi interfaces (Zhang, et.al., 2010).
The PowerTutor was designed to be used by both application developers and smartphone users. Applications developers use to conveniently, accurately and rapidly determine the overall impact of changes in software design on power consumption while smartphone users can use the tool to determine the underlying power consumption characteristics the relate to competing mobile applications thus facilitating informed decision-making for both parties (Zhang, et.al., 2010). PowerTutor, according to Zhang, et.al. (2010) has a power model that includes six different components including: GPS, LCD display, CPU, audio interfaces, Wi-Fi and cellular interfaces. Based on the experiments that authors carried out, it was found that PowerTutor was accurate within an average of 0.8% with at most 2.5% error for intervals of 10 seconds. In addition to the PowerTutor tool, Zhang, et.al. (2010) also proposed the PowerBooster tool which was designed an automatic state of battery discharge on the basis of a technique called the power model generation
15
technique. According to Zhang, et.al. (2010), the experimental tests carried for 10-second intervals indicated that PowerBoost was accurate within 4.1%.
3.2Monitor, detect and control app behaviour approach
Dao, et al., (2017) are concerned with the difficulty in identifying applications that are heavy power consumers on a smartphone as well as understanding why these applications are heavy power consumers. The authors believe that there is real need for phone users to be aware of applications on their smartphones that are heavy power consumers so that they are able to take appropriate action quickly enough be prevent their phone batteries being completely drained (Dao, et al., 2017).
In their study, Dao, et al., (2017) propose TIDE, a tool that they believe can identify applications that are heavy energy consumers and provide an understanding of the reasons why an application is consuming a lot of energy on the phone. TIDE, according to Dao, et al., (2017) operates as user-centric tool which can be installed on a user’s phone and it continuously the performed lightweight monitoring tasks on the application usage of the user as well as monitoring the resources that the application consumes.
Dao, et al., (2017) conduct an evaluation of their proposed tool using emulation of usage pattern traces from seventeen volunteer users and the results indicate that TIDE correctly estimated the energy consumption level for 225 applications out of 238. However, the tool does not provide a breakdown of the screen consumed energy in relation to individual applications yet the screen consumers the most amount battery power in most cases. Hence the results that the TIDE tool provide do not show the full picture of energy consumption.
Jabbarvand, et al., (2015) were concerned with the fact that application repositories lack information regarding the relative energy cost of applications based on app categories which forces the user to install applications without appropriate understanding of the energy implications of these applications.
16 Figure 8: Approach B: key issues
Wang, et al., (2016) are concerned about the difficulty in the diagnosing energy inefficiency of applications that often use sensors to operate. In their study, Wang, et al., (2016) propose the GreenDroid approach that is designed to systematically diagnose problems associated with energy inefficiency among applications used in smartphones particularly those running on the Android platform.
The proposed approach leverages the Application Execution Model (AEM) to realistically simulate the runtime behaviours of an application and it is also designed to have the ability of automatically
17
analysing the sensory utilisation data of an application reporting the resulting information to the application’s developers (Wang, et al., 2016). Wang, et al., (2016) evaluated the E-GreenDroid approach using 13 real applications on Android in two separate experiments and the results from the tests indicated that the tool was effective in executing its intended mandate. However, E-GreenDroid does not support concurrency of Android applications as it simply places all the execution into a single thread.
A solution presented in the existing literature that provides attempts to cover all areas of a smartphone’s energy consumption is the Power monitor v2 that was proposed by Datta, Bonnet & Nikaein (2013). In their study, Datta, Bonnet & Nikaein (2013) suggest that the power monitor v2 is an Android application that works by employing a monitoring module to collect data which relates to all features of the smart device’s (smartphone or tablet).
There are various modules, each collecting data on a specific feature including; the application monitor – collects data on running applications and their CPU load; battery monitor – collects data on battery status; CPU monitor – collects data on CPU operating frequency and load; the context monitor – collects data on system time, date and coarse location; the network monitor – collects data on the status of the mobile data, WiFi, network traffic used by applications and GPS status; and the display monitor – collects data on the screen timeout, level of brightness and devise interaction time (Datta, Bonnet & Nikaein, 2013). Based on their paper, Datta, Bonnet & Nikaein (2013) suggest the Power monitor v2 app monitors Android devices it is installed on continuously, stores the collected data locally for seven days and deploys a learning engine that is designed to generate various usage patterns that may exist within the smart device.
Thereafter power saving patterns for each pattern are generated dynamically. The collection of the usage data of the smart device raises various privacy related questions for the tool, however, Datta, Bonnet & Nikaein (2013) suggest that their approach preserves privacy of data since all the data collected stored and computations generated done locally. The evaluation tests carried out on the Power monitor v2 indicate that the application increased battery life of a Samsung GT-19100 running Android 2.3.4 OS by 8.2 hours while it increased the battery life of the Nexus 7 running Android 4.2.1 OS by 10 hours (Datta, Bonnet & Nikaein, 2013). Overall, the Power monitor
18
v2 was found to increase the battery life of the devices it was installed on by 82% (Datta, Bonnet & Nikaein, 2013).
In their study, Dong & Zhong (2012) analysed the underlying influence of the content displayed on the overall energy-usage for displays whose design is based on the OLED technology. Through their research, the authors found that energy usage largely depends on the content displayed as different content contains different colours and for the devise to display different colours a certain amount of energy would be consumed (Dong & Zhong, 2012). Hence, Dong & Zhong (2012) concluded that designers of graphical user interface generally have a significant impact on the device’s energy consumption. In this regard, Dong & Zhong (2012) proposed different energy models which were designed to estimate the display content’s power consumption. Dong & Zhong (2012) also proposed different transformation methods such as the utilisation of a lighter foreground colour and a dark background colour. Dong & Zhong (2012) used the transformation methods to evaluate the overall influence of their methods and found that energy usage can be reduced by approximately 75% hence saving the smartphone battery from draining.
Li, Tran & Halfond, (2014) used a similar idea to that presented by Dong & Zhong (2012) as they concentrated on the idea of reducing the consumption of energy by device-displays that use OLED technology. However, Li, Tran & Halfond, (2014) proposed a different approach in which they suggested that it is necessary to change the source code of the applications as a way of reducing the power consumption of the applications. They developed a tool they called Nyx which they suggested was capable of performing colour schemes transformations for applications (Li, Tran & Halfond, (2014). According to Li, Tran & Halfond, (2014), the test on their proposed solution found that battery savings of up to 40% for such modified applications were possible but only if users are willing to accept colour transformations in the name of saving battery.
Pathak, Hu & Zhang (2012) were concerned with the energy spent by mobile applications with the aim of finding ways to reducing such energy consumption. In their study, Pathak, Hu & Zhang (2012) presented an energy profiler tool for Android smartphone applications called the Eprof. According their study, Eprof is an energy profiler that adopts the last-trigger accounting policy to capture intuitively the asynchronous modern smartphone components’ power behavior in
19
mapping of energy activities to respective program smartphone entities (Pathak, Hu & Zhang, 2012). The tool was designed to be concerned with energy consumption profiling which is not linear as time and it has the capability of measuring intra-app consumption of energy including providing insights into the overall energy breakdown per application routine and per thread (Pathak, Hu & Zhang, 2012).
Their tool was also designed to be a general-purpose energy profiler that is fine grained works by assisting an application developer for Android smartphones to optimise the application’s energy consumption. Pathak, Hu & Zhang (2012) carried out an experimental test which involved the profiling the energy consumption of six Android popular smartphone applications including; Facebook, Angry-Birds, and the Android Browser application among others.
Their tests showed that Eprof shed light on the applications’ internal energy dissipation and it further exposed surprising findings such as 65%-75% free applications’ energy is consumed third-party advisement modules of the applications (Pathak, Hu & Zhang, 2012). Eprof also revealed numerous “wakelock bugs” (a family of smartphone applications energy bugs) and it efficiently pinpoints their location within the application’s source code for to inform decision-making. Based on the experiments conducted by Pathak, Hu & Zhang (2012), their proposed accounting presentation of application 1/O energy (bundles) helped to reduce the consumption of energy of four applications involved in the test by 20% to 65%.
3.3 Switching off features approach
Petander (2009) proposed an energy-aware algorithm that was based on measurements of energy consumption in relation to 802.11 WLAN and UMTS networks on smartphones running on an Android operating system. The proposed algorithm generally utilises application traffic size estimations in order to determine the overall alternative of the minimum energy-cost through comparing the cost associated with the utilisation of UTMS with the underlying cost associated with performing a downward vertical opportunistic handoff back to WLAN, while utilising WLAN for data transfer (Petander, 2009).
20
The authors show in their study that the proposed solution has the ability of predicting how much data will be transferred as a result of actions taken by the user. Based on experimental tests, Petander (2009) found that energy consumption of the smartphone increases by 18.3% whenever WiFi and UTMS are both powered on simultaneously, compared to powering on UTMS alone at any one time.
In their study, Taleb et al (2013) propose a technique that involves dynamic switching between WiFi and 3G communication on the smartphones. Taleb et al (2013) aim at achieving the ability to effectively switch to an alternative Wi-Fi connection from a primary cellular network. Taleb et al, (2013) conducted a set of experimental measures in relation to various network scenarios with the aim of identify the key components which affect consumption of energy within smart devices while they are connected to WiFi and 3G networks. The authors then used the measurement results to derive at generic analytical model for energy as a function of effective download bit rate and download data size (Taleb et al, 2013).
They developed an Android-based mobile application whose intended design is to test, in real scenarios, the overall performance of the algorithm for dynamic switching between WiFi and 3G connections. The results of the tests showed that it was possible to dynamically switch between WiFi and 3G communications and, when 3G only and WiFi only connections were compared, it was found that energy savings of 30% and 18% respectively were possible (Taleb et al, 2013). This particular study highlights the underlying potential benefits that intelligent switching within heterogeneous networks can provide.
In a study conducted by Cai et.al., (2015), the authors were focused on power wastage in mobile devices with 3G/4G networking that resulted from ‘tail time’ where the device’s radio is kept running despite the fact that no communication is taking place. Cai et.al., (2015) proposed DelayDroid as a framework which would provide a developer with the capability to add the required policies for reducing such energy wastage to existing Android application that are unmodified without any ‘huhman’ effort. The tool that Cai et.al., (2015) proposed uses bytecode refactoring and static analysis in order to identify method calls which send network related requests and modify the calls in order to detour them to the run-time of the DelayDroid.
21
The tool’s runtime then batches them by applying a pre-defined policy, hence avoiding energy waste related to tail time hence improving energy efficiency. The universality and correctness of the DelayDroid mechanisms were evaluated and tested using 14 popular applications for Android and results indicated that DelayDroid was capable of reducing energy-waste related to 3G/4G tail time by 36% (Cai et al., 2015). However, it is worth noting here that while the test results indicate that DelayDroid was effective in reducing the energy waste, it only reduces waste related 3G/4G tail time but not from screen and CPU usage which account for a large portion of the phone battery drain.
4. Key Issues with Current Power-Saving Approaches
This report has provided a review of the existing literature regarding the different solutions, techniques and tools that have been proposed by different authors in response to battery energy consumption problems of mobile applications for smart devices running on the Android OS. The literature review covers studies that provide solutions based on three key approaches, including; approach 1 estimating and simulating power consumption of android applications, approach 2 monitoring, detecting and controlling the android applications’ behavior, and approach 3 switching off smartphone features when not in use in order to reduce power consumption. Based on the review of the literature, solutions presented by prior studies in relation to approach 1 reveal that the average estimations that the proposed tools/techniques provide tend to conflict the actual usage habits of device and the accuracy of the power consumption measurements and simulators remains an issue of debate.
The review of the existing literature in relation to the approach 2 reveals most solutions that monitor and control app behavior also consume power from the devise’ battery for instance E-GreenDroid, Eprof, and among others. Prior studies that propose solutions in the line of approach 3 reveal that the proposed techniques use predefined saving plans that provide a one-size-fits-all approach which does not necessarily provide customized/personalized solutions for users. Therefore, while the techniques presented herein provide some potential solutions for reducing
22
energy consumption by mobile applications on Android-based smart-devices, they are limited in their usage.
A shared limitation among most current smartphones strategies of power and energy saving is being “detective” rather than being “preventive”. The current ways of using third-party applications and/or built in firmware’s that monitors the usage of the smartphone battery for the sake of saving the power of the same battery, conflicts with the main concept of saving power. The monitoring and detecting requires processing which basically requires power.
In addition to the above limitations, the average amount of power consumption of an application can be easily measured using one of the current detective techniques only after having the application installed and run. For a naive smartphone user it is impossible to predict which of the applications offered on an app store can be classified as a “Power-Hungry” application so that he/she could avoid installing while using a smartphone in an area with either no or limited recharging capabilities.
This keeps the user under the same problem of using detective techniques rather than supporting the user with a preventive plan that could give him/her an idea about what to run or don’t run. Another issue of current power saving strategies is the “One Size Fits All” philosophy which does not take into consideration the factors that could distinguish different smartphone users.
5. Proposed Solution “Rating the level of Power-Hungry Google Play Applications” (Similar to power rating in Electrical Home Appliances)
5.1Introduction
The huge success of Android smartphones is mainly due to the variety of applications available, plus the open-source OS which allow it to grow exponentially. Android users enjoyed the way applications can be downloaded and installed from an online market, but were also concerned about giving the green light to a number of flashing permissions.
These permissions need to be given to an application in order to work properly. The idea behind alerting the user about these permissions is mainly related to the privacy and the security of the
23
user. The idea of the following work is to add another dimension to the application market by alerting the user about the amount of power consumption of each application he is about to install on his phone. Relating permissions to power consumption in order to achieve the task is the main contribution of this report.
5.2About Google Play Applications Permissions
“A permission is a restriction limiting access to a part of the code or to data on the device. The limitation is imposed to protect critical data and code that could be misused to distort or damage the user experience”.
As presented to android application developers and coding standards, an application to be uploaded to Google Play must have a “manifest file” which shows important information about the application to Android system. This type of information must be given to the android system before it can run the application code. The manifest file name is “AndroidManifest.xml”, which inform the system about many things including our main target which is listing the permissions used by the application.
The following example shows permissions in source code and their translation that is shown to the user:
Code: <permission-group ...android.permission.ACCESS_COARSE_LOCATION..../>
Translation (What is shown to user before downloading the application): “Allows an app to access approximate location derived from network location sources such as cell towers and Wi-Fi.”
24
TABLE 3.1 Examples of Google Play Permissions code String and Description.
Code String Description
ACCESS_CHECKIN_PROPERTIES
Allows read/write access to the "properties" table in the checkin database, to change values that get uploaded.
ACCESS_COARSE_LOCATION
Allows an app to search approximate location derived from network location sources such as cell towers and Wi-Fi.
ACCESS_FINE_LOCATION
Allows an app to search precise location from location sources such as GPS, cell towers, and Wi-Fi.
ACCESS_LOCATION_EXTRA_COMM ANDS
Allows an application to access extra location provider commands
ACCESS_MOCK_LOCATION
Allows an application to create mock location providers for testing
ACCESS_NETWORK_STATE
Allows applications to access information about networks
ACCESS_SURFACE_FLINGER
Allows an application to use SurfaceFlinger's low level features.
These permissions flashes out to inform about the different components of the phone that will be used in order to have the application to work. It mainly helps in taking one and final decision whether or not to install an application, and since the user does not have the option to select from an application permissions list, they can be accepted or rejected as one full package.
5.3Using Permissions to Measure The Amount of Power Consumption of An Android Application
By our own assumption an efficient and/or accurate way to go into reading, analyzing or Static-testing an application is by having the application in its source code format. Unfortunately as per to the privacy and security standards of Google Play, the source code of an available application is not to be shown or reveled to public. At the same time Google Play does give informative translation and summarization of the code named as “application permissions”. These permissions came directly from the source code of the application but in a much more understandable format
25
for an average technology user. Though these permissions do not reflect all the commands under the source code but they reveal the nature of an application behavior in dealing with the components of a smart phone. The previous shows exactly what needs to be achieved in terms of studying, evaluating and rating an application from the power consumption’ perspective.
Since Google Play updates permissions of an application directly at the same time the code of the application gets updated. An advantage of our proposed measuring technique is that it will read up-to-date information about the application source code. Then rating the application power awareness level without the need of having a third party application in order to test the application. Simply adding a third party application means increasing the current level of power consumption which is against our main research goal. In the same time the study cannot rely on a side study that was previously made on a lab phone or on a simulator to give us information about an application power consumptions behavior, which will cause us to deal with out-dated information.
As a result, these permissions can be trusted as measurements in addition to some other factors to compute the level of power consumption of an android application.
26 Figure 9: Power Consumption Level indication by component
5.4Describing the behavior of Google Play Applications Permissions Groups
Recently Google Play did categorize all the permissions used by applications into 12 different categories. Since the user does not have enough information on how could these permissions affect his phone battery life, following will list each category and give a short description of each category describing the behavior of the permissions that does go under this category so that the user can have a quick idea on the total behavior of an application about to be install on an android phone. The following table shows the latest grouping of these permissions as per Google Play:
27
TABLE 3.2 Grouping of Google Play Permissions as Per to Google Play 2014
Permission Group Description
In-app purchases An app can ask you to make purchases inside the app
Device & app history
An app can use one or more of the following: Read sensitive log data
Retrieve system internal state
Read your web bookmarks and history Retrieve name of running apps Cellular data settings
An app can use settings that control your mobile data connection and potentially the data you receive.
Identity
An app can use your account and/or profile information on your device.
Identity access may include the ability to: Find accounts on the device
Read your own contact card (example: name and contact information)
Modify your own contact card Add or remove accounts
Contacts/Calendar
An app can use your device’s contacts and/or calendar information.
Contacts and calendar access may include the ability to: Read your contacts
Modify your contacts
Read calendar events plus confidential information
Add or modify calendar events and send email to guests without owners' knowledge
Location
An app can use your device’s location. Location access may include:
Approximate location (network-based) Precise location (GPS and network-based) Access extra location provider commands GPS access
SMS
An app can use your device’s text messaging (SMS) and/or multimedia media messaging service (MMS). This group may include the ability to use text, picture, or video messages. Note: Depending on your plan, you may be charged by your carrier
for text or multimedia messages. SMS access may include the ability to:
28 Read your text messages (SMS or MMS)
Receive text messages (MMS, like a picture or video message) Edit your text messages (SMS or MMS)
Send SMS messages; this may cost you money Receive text messages (WAP)
Phone
An app can use your phone and/or its call history.
Note: Depending on your plan, you may be charged by your carrier for phone calls.
Phone access may include the ability to:
Directly call phone numbers; this may cost you money Write call log (example: call history)
Read call log
Reroute outgoing calls Modify phone state
Make calls without your intervention
Photos/Media/Files
An app can use files or data stored on your device. Photos/Media/Files access may include the ability to: Read the contents of your USB storage (example: SD card) Modify or delete the contents of your USB storage Format external storage
Mount or unmount external storage
Camera/Microphone
An app can use your device’s camera and/or microphone. Camera and microphone access may include the ability to: Take pictures and videos
Record audio Record video
Wi-Fi connection information
An app can access your device’s Wi-Fi connection information, like if Wi-Fi is turned on and the name(s) of connected devices. Wi-Fi connection information access may include the ability to: View Wi-Fi connections
Device ID & call information
An app can access your device ID(s), phone number, whether you’re on the phone, and the number connected by a call. Device ID & call information may include the ability to: Read phone status and identity
A Simple conclusion from Table 3.2 shows that Google Play did its categorization strategy based on three main factors which are:
Privacy: How far does an application go into dealing with the private stuff of the user which is shown clear in the listing of the following categories: Device & app history,
29
Contacts/Calendar, SMS, Photos/Media/Files, Camera/Microphone, Device ID & call information
Security: How secure it is to leave this application to deal freely with some sensitive information that belongs to or identifies the user which is shown clear in the listing of the following categories: Identity, Location, Phone, Wi-Fi connection information
Additional Charges: Does using this application going to cost the user an additional charge without his notice or approval which is shown clear in the listing of the following categories: In-app purchases, Cellular data settings, SMS, Phone
Next is to list all the permissions used by Google Play applications and filter them under a new category that focuses more into the use of power and power consumption.
A start is by listing components of an average Smartphone that runs Android. Then measuring the behavior of each component in terms of power consumption in order to find components that can be classified as most power consuming components. The next step is by going back to the full list of permissions and then extract the permissions that deal with those power consuming components and name them as Google Play Power Consuming Applications Permissions.
In short our contribution in this part is adding a new categorization feature to the three already provided by Google play. In fact, permissions were always investigated relative to privacy, security, additional-charges but rarely with power-consumption.
5.5Rating Power Consuming Smartphone Components
The following list contains the most key and common components and/or features that can be found on any average Android Smartphone as per to popularity of use today:
Application Processor
Cellular Radio (GSM, 3G, 4G ...etc) Screen (Including Sensors)
30 Cameras Flash Light Audio Speaker Microphone GPS Wi-Fi Radio Bluetooth Radio
The second step is to start measuring the amount of power consumed by each of the above components using PowerTutor© assuming that the component is used continuously for a period of 60 seconds. Since most of the components in any android phone do work as a group in order to achieve a certain purpose, it was difficult to force a component to work alone without having other components involved. This caused accuracy issues about having valid power measurement results of each. This uncertainty was taken care of later by implementing some pre-testing techniques. What helped more in this regards was the flexibility of Android phones that gave us the chance to perform a number of steps easily like: Hard restart, Kill all processes and background applications, Clear RAM, Deactivate all features that are not essential to make the component work alone.
The following table shows the results of the experimental measurements done by us on a Samsung I9500 running Android OS, v4.2.2 (Jelly Bean), v4.3, using PowerTutor which is an application developed by University of Michigan Ph.D. students Mark Gordon, Lide Zhang and Birjodh Tiwana under the direction of Robert Dick and Zhuoqing Morley Mao at the University of Michigan and Lei Yang at Google. Results are ordered starting from the most consuming till the least consuming.
31
TABLE 3.3 Smartphone Components Sorted By Average Amount of Energy Consumption
Smartphone Component Capacity of the phone Battery before fully activating the component (mAh) Capacity of the phone
Battery after fully activating the component alone for a period of 60 seconds (mAh) Average Amount of Energy Consumption measured (mAh/m) GPS 2600 ∼ 2575 ∼ 25 Application Processor 2600 ∼ 2580 ∼ 20 Flash Light 2600 ∼ 2581 ∼ 19 Cellular Radio (GSM, 3G, 4G ...etc) 2600 (Fully Charged) ∼ 2583 ∼ 17 Cameras 2600 ∼ 2583 ∼ 17 Screen (Including Sensors) 2600 ∼ 2584 ∼ 16 Vibration 2600 ∼ 2585 ∼ 15 Wi-Fi Radio 2600 ∼ 2588 ∼ 12 Bluetooth Radio 2600 ∼ 2590 ∼ 10 Audio Speaker 2600 ∼ 2591 ∼ 9 Microphone 2600 ∼ 2595 ∼ 5
The next step in our empirical experimentation is to create a scale in order to rate the above components in terms of the amount of power consumption of each. While the above results showed us the highest power consumption measurement ∼ 25 mAh and the lowest ∼ 5 mAh, it is recommended to scale up the result pool in order to make the rating criteria compatible with future measurements. So by assuming that the scale of rating a smart phone component is between ∼ 1 to ∼ 30 mAh, From the previus it is now simple to start fetching our results as follows: The following table shows the rating of smart phone components in terms of the amount of Energy
32
consumption on a scale of six stars, where one star means light power consuming component and five starts means heavy power consuming component.
TABLE 3.4 Rating Smartphone Components In Terms of Energy Consumption using Stars Scale:
Smartphone Component
Average Amount of Energy Consumption Per Minute
Star Rating out of Six Stars (∼ 1 to ∼ 30 mAh)
GPS ∼ 25 mAh ★★★★★
Application Processor ∼ 20 mAh ★★★★
Flash Light ∼ 19 mAh ★★★★
Cellular Radio (GSM, 3G...etc) ∼ 17 mAh ★★★ Cameras ∼ 17 mAh ★★★ Screen (Including Sensors) ∼ 16 mAh ★★★ Vibration ∼ 15 mAh ★★★
Wi-Fi Radio ∼ 12 mAh ★★
Bluetooth Radio ∼ 10 mAh ★★
Audio Speaker ∼ 9 mAh ★★
33 Figure 9: The proposed star system rating
5.6Power Consumption Keywords Extracted From Permissions.
Based on the previous ratings of Smartphone components power consumption level, and in order to identify permissions classified as power consuming permissions, following is a list of all permission used by Google Play. The list is generated in order to use it as data to be compared with Table 3.4 of Smartphone components. The following is the full list of permission used by Google Play applications:
34
TABLE 3.5 Permissions Used By Google Play Applications (In three column for display purpose):
Permissions Used By Google Play Applications access Bluetooth
settings
access extra location provider commands access mail information access USB storage file
system
add or modify calendar events and send email to guests without owners' knowledge add or remove accounts adjust your wallpaper
size
allow Wi-Fi Multicast reception approximate (network-based) location Broadcast data messages to apps change network connectivity
change system display settings
change your audio settings
change/intercept network settings and traffic
choose widgets close other apps connect and disconnect
from Wi-Fi control flashlight control Near Field
Communication control vibration create accounts and set
passwords
delete all app cache data
directly call phone numbers
disable your screen lock download files without
notification
draw over other apps
Google Play license check install shortcuts
make app always run measure app storage space mock location sources for testing modify or delete the contents of
your USB storage modify phone state
modify secure system settings modify system settings modify your contacts
modify your own contact card modify/delete internal media
storage contents
pair with Bluetooth devices precise (GPS) location prevent phone from sleeping read calendar events plus
confidential information read call log
read call log, write call log Read email attachments read Gmail
read Google service configuration
read Home settings and shortcuts
read instant messages read owner data
read phone status and identity read sensitive log data read subscribed feeds read sync settings read sync statistics
read terms you added to the dictionary
read your contacts read your contacts, choose
widgets
read your contacts, read call log read your own contact card read your social stream
read your text messages (SMS or MMS)
read your Web bookmarks and history
receive data from Internet receive text messages (MMS) receive text messages (SMS) receive text messages (WAP) record audio
reorder running apps reroute outgoing calls retrieve running apps run at startup send SMS messages send sticky broadcast set an alarm
set preferred apps set wallpaper
take pictures and videos take pictures and videos, record
audio
test access to protected storage toggle sync on and off
uninstall shortcuts
use accounts on the device view configured accounts view network connections view Wi-Fi connections write call log
write Home settings and shortcuts
write subscribed feeds
write to user-defined dictionary write to your social stream write web bookmarks and
history
write web bookmarks and history, set an alarm
35 edit your text messages
(SMS or MMS)
expand/collapse status bar
find accounts on the device
full network access Google Play billing
service
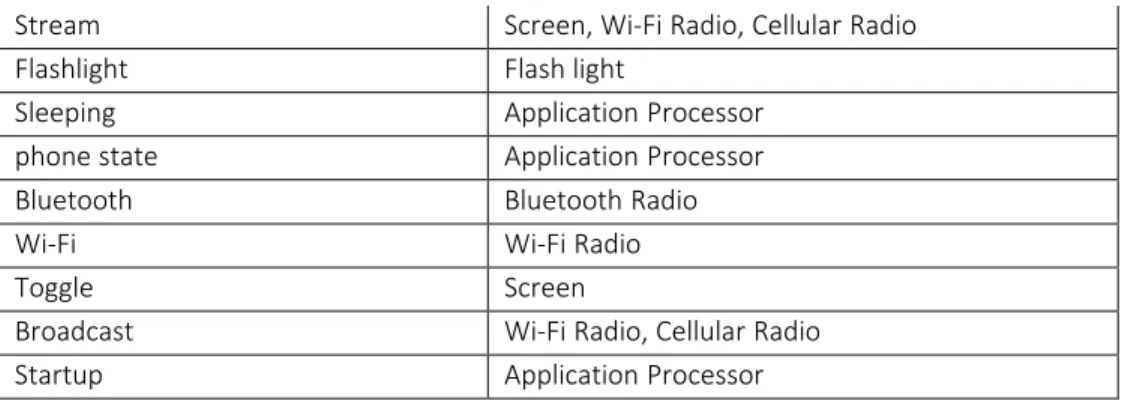
By going through Table 3.5 a number of permissions were identified as permissions that are related to one or more phone components listed in Table 3.3 and after taking a fundamental step of extracting the common words that are related to one or more phone components, our results were presented on Table 3.6 which shows the extracted common words and their relation with the phone components. In fact, this synonym interpretation of keywords is very much related to our unified work on the last chapter (8) of this thesis which is entitled "Ontology for Power Consumption of Smart Mobile Phones". To our knowledge this Ontology has never been presented in any previous research. The proposed Ontology automates the interpretation of keywords done in this table.
TABLE 3.6 Keywords Classified as “Power Consumption Related” keyword
Keyword Classified as Power Consumption keyword
Reason of selecting the word
(Relation with a Power Draining Component)
GPS GPS
system settings Application Processor Reception Wi-Fi Radio, Cellular Radio
call phone Wi-Fi Radio, Cellular Radio, Audio Speaker always run Application Processor
Download Wi-Fi Radio, Cellular Radio network settings Wi-Fi Radio, Cellular Radio network connectivity Wi-Fi Radio, Cellular Radio network access Wi-Fi Radio, Cellular Radio
Display Screen
Record Audio Speaker, Screen
Audio Audio Speaker
Vibration Vibration
take pictures Flash light, Screen take Videos Flash light, Screen
36 Stream Screen, Wi-Fi Radio, Cellular Radio
Flashlight Flash light
Sleeping Application Processor phone state Application Processor Bluetooth Bluetooth Radio
Wi-Fi Wi-Fi Radio
Toggle Screen
Broadcast Wi-Fi Radio, Cellular Radio Startup Application Processor
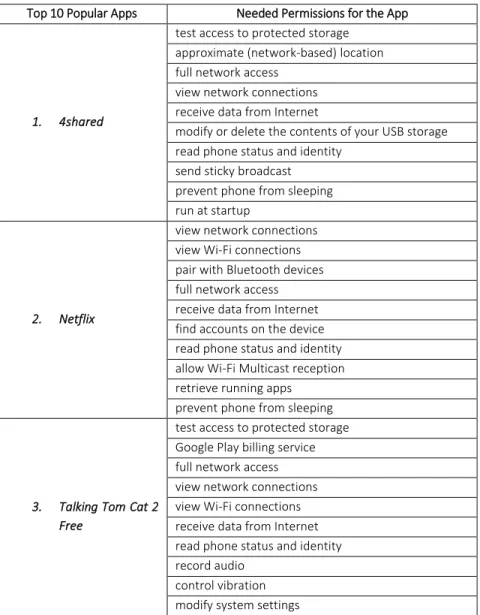
5.7Extracting and Rating Google Play Power Consuming Applications Permissions
Proceeding with our empirical experimentation sequence, after matching the common words of the above table with the full list of permissions that are used by all Google Play applications, permissions that can be classified as high power consuming permissions were listed in the Table 3.7.
TABLE 3.7 Google Play Power Consuming Applications Permissions (They are put in two columns for display purpose)
Google Play Power Consuming Applications Permissions access Bluetooth settings
allow Wi-Fi Multicast reception Broadcast data messages to apps change network connectivity change system display settings change your audio settings
change/intercept network settings and traffic
connect and disconnect from Wi-Fi control flashlight
control vibration
directly call phone numbers download files without notification full network access
make app always run
modify phone state
modify secure system settings modify system settings pair with Bluetooth devices precise (GPS) location prevent phone from sleeping read your social stream record audio
run at startup send sticky broadcast take pictures and videos toggle sync on and off view Wi-Fi connections write to your social stream
Since the previous study were able distinguish which applications permissions can be marked as power consuming permission based on matching with “the common words” that are related to smart phones components that are marked by our previous study as power consuming
37
permissions. Our next step is to rate each one of these newly extracted permissions that are called Google Play Power Consuming Applications Permissions.
They will lead us to the last stage of this empirical experimentation which is to rate an application in terms of power consumption based on the permissions related to this application, in the following the study will list each power consuming permission side by side with the ratings of the components it uses in order to find an overall average rating of each power consuming permission.
The following table shows the average power energy consumption amount and ratings for each power consuming permissions. They are calculated from the average rating of each component in table 3.6 that is used by the permission:
TABLE 3.8 Average Power Energy Consumption Amount and Ratings of Power Consuming Permissions
Power Consuming Applications Permissions
Amount of Energy Consumption of each Used Component
Permission Average Energy
Consumption Amount per minute
Permission Star Rating out of Six Stars (∼ 1 to ∼ 30 mAh) access Bluetooth
settings Bluetooth Radio (∼ 10 mAh) ∼ 10 mAh ★★ allow Wi-Fi Multicast
reception Wi-Fi Radio (∼ 12 mAh) ∼ 12 mAh ★★ Broadcast data
messages to apps
Wi-Fi Radio (∼ 12 mAh) Cellular Radio (∼ 17 mAh)
∼ 15 mAh ★★★
change network connectivity
Wi-Fi Radio (∼ 12 mAh) Cellular Radio (∼ 17 mAh)
∼ 15 mAh ★★★ change system display
settings Screen (∼ 16 mAh) ∼ 16 mAh ★★★ change your audio
settings Audio Speaker (∼ 9 mAh) ∼ 9 mAh ★★ change/intercept
network settings and traffic
Wi-Fi Radio (∼ 12 mAh) Cellular Radio (∼ 17 mAh) Application Processor (∼ 20 mAh)
38
connect and disconnect
from Wi-Fi Wi-Fi Radio (∼ 12 mAh) ∼ 12 mAh ★★ control flashlight Flash Light (∼ 19 mAh) ∼ 19 mAh ★★★★ control vibration Vibration (∼ 15 mAh) ∼ 15 mAh ★★★
directly call phone numbers
Cellular Radio (∼ 17 mAh) Microphone (∼ 5 mAh) Audio Speaker (∼ 9 mAh)
∼ 10 mAh ★★
download files without notification
Wi-Fi Radio (∼ 12 mAh) Cellular Radio (∼ 17 mAh) Application Processor (∼ 20 mAh)
∼ 16 mAh ★★★
full network access
Wi-Fi Radio (∼ 12 mAh) Cellular Radio (∼ 17 mAh) Application Processor (∼ 20 mAh)
∼ 16 mAh ★★★
make an app to always
run Application Processor (∼ 20 mAh) ∼ 20 mAh ★★★★ modify phone state Application Processor (∼ 20 mAh) ∼ 20 mAh ★★★★ modify secure system
settings Application Processor (∼ 20 mAh) ∼ 20 mAh ★★★★ modify system settings Application Processor (∼ 20 mAh) ∼ 20 mAh ★★★★ pair with Bluetooth
devices Bluetooth Radio (∼ 10 mAh) ∼ 10 mAh ★★★★ precise (GPS) location GPS (∼ 25 mAh) ∼ 25 mAh ★★★★★ prevent phone from
sleeping
Application Processor (∼ 20 mAh) Screen (∼ 16 mAh)
∼ 18 mAh ★★★★
read your social stream
Wi-Fi Radio (∼ 12 mAh) Cellular Radio (∼ 17 mAh) Application Processor (∼ 20 mAh)
∼ 16 mAh ★★★
record audio Microphone (∼ 5 mAh) ∼ 5 mAh ★ run at startup Application Processor (∼ 20 mAh) ∼ 20 mAh ★★★★
send sticky broadcast
Wi-Fi Radio (∼ 12 mAh) Cellular Radio (∼ 17 mAh) Application Processor (∼ 20 mAh)
39
take pictures and videos
Cameras (∼ 17 mAh) Flash Light (∼ 19 mAh) Microphone (∼ 5 mAh)
∼ 14 mAh ★★★
toggle sync on and off
Wi-Fi Radio (∼ 12 mAh) Cellular Radio (∼ 17 mAh) Application Processor (∼ 20 mAh)
∼ 16 mAh ★★★
view Wi-Fi connections Wi-Fi Radio (∼ 12 mAh) ∼ 12 mAh ★★
write to your social stream
Wi-Fi Radio (∼ 12 mAh) Cellular Radio (∼ 17 mAh) Application Processor (∼ 20 mAh)
∼ 16 mAh ★★★
5.8Variable Amounts of Energy Consumption for Network Connectivity Permission
As per the two commonly used types of network connections, Wi-Fi and Cellular connections, the study had to be more precise in giving the approximate amount of average power consumption amount of each “power consuming” permission under the two situations of network use. A mandatory split was done to each permission that does deal with the phone network connections into two main situations:
1. Using the permission “Indoor” (assuming using Wi-Fi network connection)
2. Using the permission “Outdoor” (assuming using the Cellular network connection)
The above two situation had to be incorporated within the previous calculations of the average power consumption for each power consuming permission. This will give as a result two new average amounts of energy consumption for each component that deals with the phone network connectivity. Calculating the two new amounts will simply take into consideration the use of either Wi-Fi or Cellular connection. Then recalculate the overall power consumption average of the permission as per to the situation. For example if a permission uses either Wi-Fi connection or Cellular connection in order to keep the network connection and the same permission were used “outdoor” then the average amount of power consumption will be calculated by assuming that
40
the permission is only using the cellular network connection in order to keep the network connections.
So the Wi-Fi average amount of power consumption will be discarded when calculating the overall average power consumption of the permission. The same case goes if the same permission was used Indoor, then the average power consumption will be recalculated by assuming that the permission is only using the Wi-Fi network connection in order to keep the connection with the network. So the Cellular average amount of power consumption will be discarded when calculating the overall average of power consumption of the same permission. As per to the above assumptions a list was generated showing the new average amounts of power consumption of all the power consumption permissions that deal with network connections under the two previously mentioned situations.
These "indoor", "outdoor" attributes are included in the Ontology unifying work presented in our last chapter of this thesis which is entitled "OWL Ontology for Power Consumption of Smart Mobile Phones". To our knowledge this Ontology has never been presented in any previous research. The proposed Ontology automates the incorporation of concepts and attributes like "indoor", "outdoor", etc., and the results were as follows:
The following table shows the two different average amounts and ratings for only power consuming permissions highlighted in grey since they deal with network connectivity. They are calculated from the average rating of each component used by the permission, and on each different situation either Wi-Fi or Cellular was eliminated from the calculation:
41
TABLE 3.9 Average Power Consumption Amounts and Ratings of Power Consuming Permissions. (Only the Ones Dealing With Network Connectivity under Indoor/Outdoor Usage) Power Consuming Applications Permissions Amount of Energy Consumption of each Used Component Permission Average Energy Consumption Amount per minute
Permission Star Rating out of Six Stars (∼ 1 to ∼ 30 mAh) Indoor (Using Wi-Fi) Outdoor (Using Cellular) Indoor (Using Wi-Fi) Outdoor (Using Cellular) access Bluetooth settings Bluetooth Radio (∼ 10 mAh) ∼ 10 mAh ∼ 10 mAh ★★ ★★
allow Wi-Fi Multicast reception
Wi-Fi Radio (∼ 12 mAh) ∼ 12 mAh ∼ 12 mAh
★★ ★★
Broadcast data messages to apps
Wi-Fi Radio (∼ 12 mAh) Cellular Radio (∼ 17 mAh) ∼ 12 mAh ∼ 17 mAh ★★ ★★★ change network connectivity
Wi-Fi Radio (∼ 12 mAh) Cellular Radio (∼ 17 mAh) ∼ 12 mAh ∼ 17 mAh ★★ ★★★ change system display settings
Screen (∼ 16 mAh) ∼ 16 mAh ∼ 16 mAh
★★★ ★★★ change your audio
settings Audio Speaker (∼ 9 mAh) ∼ 9 mAh ∼ 9 mAh ★★ ★★ change/intercept network settings and traffic
Wi-Fi Radio (∼ 12 mAh) Cellular Radio (∼ 17 mAh) Application Processor (∼ 20 mAh) ∼ 16 mAh ∼ 18 mAh ★★★ ★★★★ connect and
disconnect from Wi-Fi
Wi-Fi Radio (∼ 12 mAh) ∼ 12 mAh ∼ 12 mAh
★★ ★★
control flashlight Flash Light (∼ 19 mAh) ∼ 19 mAh ∼ 19 mAh ★★★★ ★★★★ control vibration Vibration (∼ 15 mAh) ∼ 15 mAh ∼ 15 mAh ★★★ ★★★
42 directly call phone
numbers Cellular Radio (∼ 17 mAh) Microphone (∼ 5 mAh) Audio Speaker (∼ 9 mAh) ∼ 10 mAh ∼ 10 mAh ★★ ★★ download files without notification
Wi-Fi Radio (∼ 12 mAh) Cellular Radio (∼ 17 mAh) Application Processor (∼ 20 mAh) ∼ 16 mAh ∼ 18 mAh ★★★ ★★★★ full network access Wi-Fi Radio (∼ 12 mAh)
Cellular Radio (∼ 17 mAh) Application Processor (∼ 20 mAh) ∼ 16 mAh ∼ 18 mAh ★★★ ★★★★ make app always run Application Processor
(∼ 20 mAh)
∼ 20 mAh ∼ 20 mAh
★★★★ ★★★★ modify phone state Application Processor
(∼ 20 mAh) ∼ 20 mAh ∼ 20 mAh ★★★★ ★★★★ modify secure system settings Application Processor (∼ 20 mAh) ∼ 20 mAh ∼ 20 mAh ★★★★ ★★★★ modify system settings Application Processor (∼ 20 mAh) ∼ 20 mAh ∼ 20 mAh ★★★★ ★★★★ pair with Bluetooth
devices Bluetooth Radio (∼ 10 mAh) ∼ 10 mAh ∼ 10 mAh ★★★★ ★★★★ precise (GPS) location
GPS (∼ 25 mAh) ∼ 25 mAh ∼ 25 mAh ★★★★
★ ★★★★★
prevent phone from sleeping Application Processor (∼ 20 mAh) Screen (∼ 16 mAh) ∼ 18 mAh ∼ 18 mAh ★★★★ ★★★★ read your social
stream
Wi-Fi Radio (∼ 12 mAh) Cellular Radio (∼ 17 mAh) Application Processor (∼ 20 mAh) ∼ 16 mAh ∼ 18 mAh ★★★ ★★★★
43 record audio Microphone (∼ 5 mAh) ∼ 5 mAh ∼ 5 mAh ★ ★
run at startup Application Processor (∼ 20 mAh)
∼ 20 mAh ∼ 20 mAh
★★★★ ★★★★ send sticky broadcast Wi-Fi Radio (∼ 12 mAh)
Cellular Radio (∼ 17 mAh) Application Processor (∼ 20 mAh) ∼ 16 mAh ∼ 18 mAh ★★★ ★★★★ take pictures and
videos
Cameras (∼ 17 mAh) Flash Light (∼ 19 mAh) Microphone (∼ 5 mAh)
∼ 14 mAh ∼ 14 mAh
★★★ ★★★ toggle sync on and
off
Wi-Fi Radio (∼ 12 mAh) Cellular Radio (∼ 17 mAh) Application Processor (∼ 20 mAh) ∼ 16 mAh ∼ 18 mAh ★★★ ★★★★ view Wi-Fi connections
Wi-Fi Radio (∼ 12 mAh) ∼ 12 mAh ∼ 12 mAh
★★ ★★
write to your social stream
Wi-Fi Radio (∼ 12 mAh) Cellular Radio (∼ 17 mAh) Application Processor (∼ 20 mAh) ∼ 16 mAh ∼ 18 mAh ★★★ ★★★★
Continuing with our empirical measurements experimentation work, from the above results a simple comparison can be made between the two average amounts of energy consumption and to come up with an average approximate rate of either increase or decrease in the average amount of power consumption of permission. In order to use it with the coming stage of finding the average amount of energy consumption of a Google Play application for a full Applications Category, the table of comparison is as follows: