Sofi a Eurico / Patrícia Pinto /
João Albino Silva / Catarina Marques
The ECSI model in higher education in tourism:
A segmentation analysis in the Portuguese case
Abstract
Th is research explores the European Consumer Satisfaction Index model applied to higher education in tourism by including the construct of employability and by accounting for unobserved heterogeneity. In particular, it intends to identify segments of higher education institutions' (HEI) consumers based on the structural model estimates of the European Consumer Satisfaction Index (ECSI), enlarged with the employability construct. A based segmentation approach using FIMIX in PLS path model-ling is used. Th e ECSI is properly adjusted to the educational framework and shows its eff ectiveness when assessing students' satisfaction regarding the attended HEI. Two distinctive graduate segments are identifi ed using a sample of 166 HEI consumers. Th e results confi rm the assumption of heterogeneity as the relationships diff er across segments and the need for HEIs to target those segments diff erently in such a competitive context.
Key words: higher education in tourism; ECSI; FIMIX; PLS; Portugal
Sofi a Eurico, PhD, Center of Tourism Applied Research (CiTUR), Politechnical Institute of Leiria, Leiria, Portugal; E-mail: sofi [email protected]
Patrícia Pinto, PhD, Research Center of Spatial and Organizational Dynamics (CIEO), University of Algarve, Faculty of Economics, Faro, Portugal; E-mail: [email protected]
João Albino Silva, PhD, Research Center of Spatial and Organizational Dynamics (CIEO), University of Algarve, Faculty of Economics, Faro, Portugal;E-mail: [email protected]
Catarina Marques, PhD, Business Research Unit (BRU-IUL), ISCTE Business School, Lisbon, Portugal; E-mail: [email protected]
Introduction
Higher education (HE) has faced diff erent challenges as a refl ection of socio-economic aspects that characterize societies in distinct times. Nowadays, higher education institutions (HEIs) are pressured to achieve increasing competitiveness, which demands high standards of knowledge and quality, in-ternationalization and mobility programmes, strategies that distinguish them from others and a focus on attracting new students and off ering post-graduation options for those who are already enrolled in the system. In recent years HEIs have also been constrained by some governments' agenda because of the issue of employability, and this dimension has increasingly dictated fi nancial support according to the obtained results (HEFCE, 2001).
As the primary consumers of HEIs (Kanji & Tambi, 1999), students/graduates' satisfaction and loyalty regarding the HEI attended are undoubtedly a determinant of the planning of strategies that will satisfy the previously mentioned demands and simultaneously gain graduates' appraisal of the service provided. In the Portuguese case, the increasing unemployment rates for graduates may also aff ect their perception of and satisfaction with the service provided by HEIs, which can ultimately be refl ected in a reduction of the number of potential students enrolling in HE. Th e issue of employability therefore gains visibility, and helping and teaching individuals to be employable is now on the national HEIs' agenda. Employability is enhanced in this study as a dimension that should be considered by those
responsible for higher education, and it is added as a construct to the ECSI (European Consumer Satisfaction Index) model. Considering the lack of studies on employability and its role as a link between the academic context and the industry, this construct gains major importance for a better understanding of students' perception of its importance in their preparation to cope with the present tourism industry challenges.
Th e framework for this study is the ECSI model, which measures the importance of image, expectations, quality and value as antecedents of satisfaction and loyalty as its main consequence (ECSI Technical
Committee, 1998). Th e ECSI model was previously used to assess customer satisfaction in the HEIs
context (Alves & Raposo, 2007b; Brown & Mazzarol, 2009; Chiandotto, Bini & Bertaccini, 2007; Chitty & Soutar, 2004; Martensen, Grønholdt, Eskildsen & Kristensen, 2000). Moreover, previous research shows that this model can be successfully applied to HEIs by adding the construct employ-ability as a predictor in the model (Eurico, Silva & Valle, 2015). Indeed, Eurico et al. (2015) show that the construct employability infl uences the key connections of the ECSI model applied to HEIs, allowing that these institutions may become acquainted with the role of this factor in these particular consumers' perceptions and, therefore, adjust their educational performance to graduates' best inter-est. Th e objective of this study is to deepen the understanding of the ECSI model, enlarged with the construct employability, by seeking heterogeneity among its hypothesized relationships. In particular, this study intends to assess to what extent the relationship between the antecedents of satisfaction and its impacts on loyalty, measured by the ECSI model, change for distinctive groups of HEIs' consum-ers. Th is analysis will allow identifying graduate segments with diff erent patterns in the ECSI model applied to HEIs. Besides providing a better academic understanding of the ECSI model, this analysis can provide important practical insights for HEIs. In fact, by identifying the segments that account for this heterogeneity (Floh, Zauner, Koller & Rush, 2014), these institutions will have a better un-derstanding of their consumers and, consequently, be more prepared to make the best decisions to target them in such a competitive context.
Tourism graduates were chosen for this research considering the considerable importance of the tourism industry to the economic development of Portugal and the attention that has been paid to the qualifi cation of its human resources as a central aspect of its development (Dhiman, 2012; MEI, 2007). In this study the proposed model is estimated and validated using the partial least squares path modelling (PLS-PM) approach to structural equation modelling (SEM). Since the ECSI model has not yet been analysed regarding the existence of mutually exclusive homogeneous subgroups in terms of its relations, there is no previous information about the possible sources of heterogeneity (unob-served heterogeneity). Th erefore, to identify the graduate segments, the FInite MIXture partial least
squares (FIMIX-PLS) method is applied (Hahn, Johnson, Herrmann & Huber, 2002). Th is method
is particularly appropriate for the analysis of unobserved heterogeneity in PLS-PM (Rigdon, Ringle & Sarstedt, 2010; Ringle, Wende & Will, 2010; Sarstedt, 2008), that is, to identify segments when there is no prior information about the relevant segmentation variables.
Integrating the construct "employability" into the ECSI model
Understanding the employability concept as a key strategy for the positioning of HEIs
Th e concept of employability is directly linked to "the possession of the understandings, skills and personal attributes necessary to perform adequately in a graduate-level job" (Knight & Yorke, 2010). Nowadays, HEIs struggle both to attract new students and to respond properly to government agendas, which tend to value this aspect as a response to economies' dynamics and, in the particular case of
Europe, considering the increasing numbers of unemployed graduates, including those in the tour-ism industry (Dhiman, 2012). Strategies such as the creation of careers' services, the development of workshops that aim to enhance employability skills and marketing strategies that are planned to uphold institutions in such a competitive market are just some of the approaches that HEIs are promoting in response to this issue.
Th e implementation of the Bologna Process in higher education equally emphasized the importance of
developing the employability skills of individuals, who will have to struggle to enter the labour market and face the ceaseless technological advances of an increasingly competitive industry, such as tourism. Within a common set of procedures that have been implemented in European HEIs and that stress the importance of employability, mobility and internationalization, students will most certainly analyse the possibilities and added value that each institution presents and that will prepare them better to adjust to and succeed in a world of opportunities and challenges (Aggett & Busby, 2011; Forrier & Sels, 2003). Developing students' capacity to gain employment and be successful in their chosen occupation has become an important aspect for HEIs. However, there is still scant research crossing employability and tourism education. Some studies have discussed the tourism course units' curriculum and its implica-tions for the labour market (Dhiman, 2012; Hsu, Cathy, 2018). Other studies analyse the companies' perception of the skills needed for the tourism profession (Cuff y, Tribe & Airey, 2012; Daniel, Costa, Pita & Costa, 2017), and others have explored the possible factors infl uencing employability in the tourism sector (Airey, 1997; Harvey, Locke & Morey, 2002; Lopez-Bonilla & Lopez-Bonilla, 2012). Only a few studies analysed how perceptions about employability infl uence students' satisfaction with
their attended HEI (Eurico et al., 2015; Wakelin-Th eron, 2014).
The ECSI model
Before becoming an important means of measuring and explaining customer satisfaction and loyalty, customer satisfaction indices had been used since the 1990s to evaluate business performance in dif-ferent industries (Johnson, Gustafsson, Andreassen, Lervik & Cha, 2001). Th e basic structure of the ECSI model was developed in 1998 by the ECSI Technical Committee (1998) as a structural equation model, comprising links between consumer satisfaction and its determinants and consequences. In particular, the causes of customer satisfaction foreseen in the model are image, expectations, perceived quality and perceived value, loyalty being the presented consequence of satisfaction. A set of manifest measurable variables is associated with each latent variable and observed by posing survey questions to customers.
Th e ECSI approach uses structural equation modelling (SEM), and it was chosen for the current
study because of its fl exibility when applied to a wide variety of products and services at the industry level and in the public sector, mainly due to the use of generic questions. It is expected to provide a detailed description of the processes supporting customer satisfaction, which, when carefully studied, may contribute to organizations' effi cient performance (Cassel & Eklof, 2001, Lewin, Biemans & Ulaga, 2010). Literature review reveals that there are some studies which focus on quality evaluation through customer satisfaction in the fi eld of education which use the ECSI methodology (Martensen et al., 2000; Chitty & Soutar, 2004; Alves & Raposo, 2007; Chiandotto et al., 2007; Brown & Maz-zarol, 2009). Martensen et al. (2000) presented the fi rst study using the ECSI methodology to measure students' satisfaction with the HEI attended. Alves and Raposo (2007), Brown and Mazzarol (2009), Campostrini and Gerzeli (2007), Chiandotto et al. (2007), Chitty and Soutar (2004) and Eurico et al. (2015) followed this research line. Only in Eurico et al. (2015) employability was tested as a deter-minant of satisfaction regarding the HEI attended.
Conceptual model and research hypotheses
With the purpose of measuring graduates' satisfaction regarding the HEI attended and the role of employability in it, a research model was developed, taking into account the ECSI framework. Con-sistent with the objectives of this study, the model, shown in Figure 1, was developed and tested. Th e hypotheses tested are indicated in the fi gure and explained below.
Concerning the introduction of this construct to the ECSI model, our study proposes that it is an antecedent of satisfaction, image and expectations. Th e relation between employability and graduates' satisfaction with the HEI attended can be supported by the studies of Mason, Williams, Cranmer and Guile (2003), Mason, Williams and Cranmer (2009) and Yorke (2004). Regarding image, some studies have suggested its connection with employability, albeit without providing empirical evidence (Anctil, 2008; Belanger, Mount & Wilson, 2010; Pampaloni, 2010). Empirical analyses of the infl u-ence of employability on image can be found in the studies by Duarte, Alves and Raposo (2010), Landrum, Turrisi and Harless (2010) and Soutar and Turner (2002). As for the eff ect of employability on expectations, a few studies have suggested that, when entering an HEI, students expect to acquire knowledge and skills that will make them employable individuals and moreover that will repay their investment in a proper education (Kurtz, Clow, Ozment & Ong, 1997; Tomlinson, 2007). Further-more, Tomlinson (2007), Wilton (2008) and Yorke (2004) reinforced the expectations that higher education students have about easily obtaining a job that suits their graduation fi nancially and in the area of study. Th erefore, the fi rst research hypotheses can be formulated:
Figure 1
Research model and hypotheses*
*Dot lines indicate relationships related to the hypotheses of mediation.
H1: Employability has a direct positive eff ect on satisfaction concerning the HEI attended; H2: Employability has a direct positive eff ect on the image of the HEI attended;
H3: Employability has a direct positive eff ect on expectations.
EMPLOYABILITY
LOYALTY IMAGE OF HEI
EXPECTATIONS GRADUATES’GLOBAL SATISFACTION PERCEIVED VALUE H1 H2 H3 H4 H5 H6 H7 H8 H10 H11 H12 QUALITY (Human elements) QUALITY (Non-human elements) H9 H8 H9 H9 H8
Th e study of the relationship between image and expectations is not new in the service context (Cassel & Eklof, 2001; Johnson et al., 2001; Kurtz et al., 1997). In the educational framework, this variable has been shown to have a considerable impact on students' satisfaction and loyalty regarding the HEI (Belanger et al., 2010; Brown & Mazzarol, 2009; Martensen et al., 2000). Hence, the following hy-potheses are proposed:
H4: Th e image of the HEI has a positive and direct eff ect on expectations; H5: Th e image of the HEI has a positive and direct eff ect on satisfaction; H6: Th e image of the HEI has a positive and direct eff ect on loyalty.
Th e eff ect of expectations on satisfaction has been unclear, specifi cally positive in some cases, negative in other cases and even non-signifi cant (Eskildsen, Martensen, Gronholdt & Kristensen, 2000; Kris-tensen, Martensen & Gronholdt, 1999, 2000). Th en, the following hypothesis can be put forward:
H7: Expectations have a direct eff ect on satisfaction.
Th e quality variable was split into the quality of "hardware", for the non-human elements (e.g. study programmes and courses), and the quality of "software", for the human elements (teaching and ad-ministrative staff ), following the works of Chiandotto et al. (2007), Chitty and Soutar (2004) and Kristensen et al. (1999). In the studies of Anderson and Sullivan (1993) and Kristensen et al., (1999), expectations have proved to have a positive eff ect on satisfaction via perceived quality of human ele-ments. Zeithaml (1987) added that the infl uence of the quality of non-human elements (hardware) on satisfaction happens through perceived value. Moreover, perceived quality of human elements was
considered by Kristensen et al. (1999) as the most important determinant of satisfaction. Th us, the
additional hypotheses are proposed:
H8: Th e eff ect of expectations on satisfaction is positive and mediated by quality of human elements; H9: Th e eff ect of perceived quality of non-human elements on satisfaction is positive and mediated by perceived value;
H10: Perceived quality of human elements has a positive and direct eff ect on satisfaction.
Perceived value is expected to have an infl uence on students' satisfaction with the attended HEI, as they tend to expect the time and money invested in education to pay returns. In previous studies this relationship has confi rmed value to have a direct and positive impact on satisfaction (Alves & Raposo, 2007; Fabra & Camisón, 2009; Martensen et al., 2000). Th us, we hypothesize:
H11: Perceived value has a direct and positive impact on satisfaction.
Finally, loyalty, as the only consequent variable of satisfaction, has been studied as an important element that informs on topics such as the reputation of the institution, the students' intention to recommend
it and their intention to re-enrol for postgraduate studies (Butt & Rehman, 2010; Hennig-Th urau,
Langer & Hansen, 2001). Accordingly, a fi nal hypothesis is proposed:
H12: Satisfaction concerning the HEI attended has a positive and direct eff ect on loyalty to the
institution.
With the exception of H8 and H9, all the hypotheses suggest a direct eff ect between the latent variables. Besides a direct eff ect, all the hypotheses except H7 propose a positive eff ect between the variables. H8 and H9 are mediation hypotheses. H8 will verify if the indirect eff ect of expectations on satisfaction is signifi cant and positive. Th e same rationale applies to H9.
Methodology
Sample and questionnaire
Th e target population for this study were tourism and hospitality graduates working in the tourism
sector in two Portuguese tourism regions, located at the centre of the country: West region and Leiria
Fátima region. Th ese are neighbour regions with similar characteristics in terms of tourism demand
and supply. To fi nd the target population size, 207 individuals, private and public companies operating in the tourism sector were asked (by phone) about the number of tourism and hospitality graduates they were employing. Subsequently, using a 95% of confi dence and a margin of error of 3%, a sample of 174 individuals was defi ned. To assure that the sample is representative, this study used the cluster sampling method. According to this method, a random sample of companies employing graduates in
the two regions was selected. Th en, all graduates of these companies with an HE degree in tourism
or hospitality were invited to participate in the study. From those, 166 validly responded to the ques-tionnaire prepared for this study (by email or by personal delivery and pickup). Data were collected
between January 2010 and June 2010. Th e response rate equals 80.2% of the target population and
95% of the target sample. Moreover, the sample size meets the requirements for PLS-PM analysis.
Th e questionnaire considered the original ECSI questionnaire's structure and was divided into two
major parts. Th e fi rst part dealt with graduates' background, and the second part was divided into
seven sections, each related to the constructs presented in the research model (employability, image, expectations, quality, value, satisfaction and loyalty), described by two to nine items measured on a fi ve-point Likert scale. Table 1 presents the items measuring each construct. Th ey are the same used by the previous studies that employed the ECSI model in the HE sector (Alves & Raposo, 2007b; Brown & Mazzarol, 2009; Chiandotto et al., 2007; Chitty & Soutar, 2004; Martensen et al., 2000; Mason et al., 2009; Yorke, 2004).
Employability was measured using seven items, based on diff erent studies that mainly focused on measuring the time period between graduating and entering the labour market, the partnerships and liaisons established with enterprises and employers and the monitoring provided by HEIs to students in the process of fi nding a job (Campostrini & Gerzeli, 2007; Harvey, 2001; Knight & Yorke, 2003;
Schomburg & Teichler, 2006; Smith, Clegg, Lawrence & Todd, 2007). Th e remaining constructs
used the indicators previously validated by other authors using the ECSI questionnaire, mainly in the education fi eld (Brown & Mazzarol, 2009; Chiandotto et al., 2007; Chitty & Soutar, 2004; Johnson et al., 1995; Martensen et al., 2000; Ostergaard & Kristensen, 2005).
Data analysis
Th e global model was previously estimated by partial least squares path modelling (PLS-PM). All the
measures in the model are refl ective. PLS-PM allows estimating and testing the hypothesised relation-ships involving the latent variables as well as analysing the extent to which they are properly measured by their indicators (Chin, 1998; Chin & Newsted, 1999; Davcik, 2014). Th is method is particularly suitable for estimating complex structural equation models with small sample sizes (Vinzi, Chin, Henseler & Wang, 2010). Moreover, PLS-PM has been chosen to test national satisfaction indexes (IPQ, 1999). In this study the software SmartPLS 3.0 was applied to obtain the results (Ringle, Wende & Becker, 2015). Firstly, the global measurement model was evaluated; then, the FIMIX-PLS approach was applied to identify HE consumer segments (Hahn et al., 2002; Rigdon et al., 2010; Ringle et al.,
2010; Sarstedt, 2008). Th e potential unobserved heterogeneity was uncovered by FIMIX-PLS within
test the research hypotheses for the global model (with the total sample) as well as for each segment.
Th e segment number was decided based on the comparison of diff erent model performance indicators
(Akaike information criterion (AIC), Bayesian information criterion (BIC), consistent AIC (CAIC), corrected AIC with the penalty factor of three (AIC3) and normed entropy statistic (EN)) (Sarstedt, Becker, Ringle & Schwaiger, 2011). Th e mixing proportions, the a posteriori probability of segment membership for each observation and the segment-specifi c estimates for the structural relationships and for the regression variances were estimated (Henseler, Ringle & Sinkovics, 2009). Th e signifi cance of the indirect eff ects was assessed by the Bias-Corrected and Accelerated Bootstrap procedure (MacKin-non, Lockwood, Hoff man, West & Sheets, 2002; MacKin(MacKin-non, Lockwood & Williams, 2004).
Results
Sample description
Th e distribution of the characterization variables of the respondents is presented in table 6 (column "overall sample"). Th e obtained data show that our sample comprised 127 females (76.5%) and 39 males (23.5%) and the mean age of the respondents was 29.0. Regarding their education and train-ing, all the respondents held a bachelor degree in the tourism area, which was an assumption of the study. More than 70% graduated in "tourism" (72.9%) and the remaining individuals in "tourism and hospitality management". A masters' programme was attended by 13.3%, and 1.8% attended a PhD programme. Furthermore, as far as work experience is concerned, for the majority of the respondents (70.5%), their job at the time of the survey was not their fi rst job, and when asked about the links between that job and the scientifi c area of their BSc, 93.4% answered positively. Lastly, on the subject of income, 66.7% of the respondents received monthly between €451 and €900, 29.0% received from €901 to €1350 and 4.3% received more than €1,350.
Indicators' description and test to common method bias
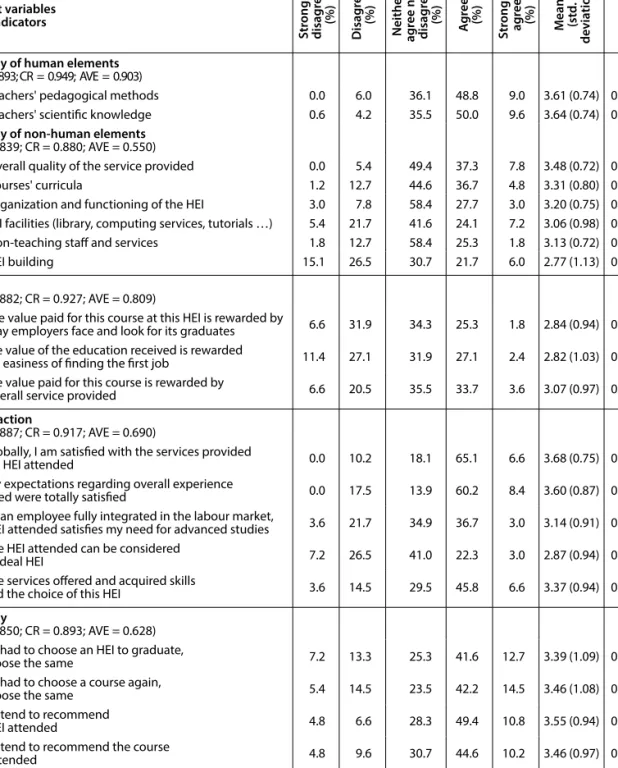
Table 1 lists the items used to measure each latent variable, the percentages in each level of the scale, as well as the mean and standard deviation for each item. Th e results for the items related to employ-ability show that the ones that gathered the highest values of agreement correspond to the relevance of training to performing the job functions (Emp 4) and its importance to the possibility of career progression (Emp 5). Concerning image, the indicators with the higher percentages in the categories of agreement are those that refl ect the perception of the respondents in relation to the attended HEI, considering it to be a good institution at which to study (I1) and characterizing the HEI as
innova-tive and forward looking (I2). Th e indicators linked to the variable expectations with the answers
of highest agreement are those related to the curriculum of the attended course (E1), the scientifi c knowledge of the teachers (E3) and the preparation for job and career (E7). As for the indicators used to measure the concept of quality, the one with the highest percentage of agreement are related to the scientifi c knowledge (Q2). Value is distinguished from the previous variables as being the one with a
higher concentration of responses alluding to disagreement. Th erefore, the ease of obtaining a good
job seems not to reward the amount paid for education, according to the students' answers (V1 and V2). Th e concept of satisfaction was measured by fi ve indicators, and the overall satisfaction of the respondents with the service provided by the HEI was the attribute with the highest percentage of agreement (S1). In relation to loyalty, approximately 60% of the respondents expressed the intention to recommend the attended HEI (L3), and nearly half would choose the same institution to attend post-graduate training (L5).
Still as a preliminary analysis, the Harman's (1967) single-factor test was implemented in order to test potential common method bias (CMB). Th is test was considered relevant in our research since all items were measured by the same person and, in such cases, bias may result from the covariance between the predictor and criterion variables (Podsakoff , MacKenzie & Podsakoff , 2003). Moreover, our study uses an instrument with constructs all measured with the same scale, which can be itself a source of CMB, since it is more likely that respondents keep some consistency in their responses. SPSS was used to perform the test, as suggested by Roni (2014). Th is implied running an exploratory factor analysis with all items loaded into one common factor. According to this test, if the total explained variance for a single factor is lower that 50%, CMB is not aff ecting the data set. In our study, the common factor solution produced a total variance of 35.6%, meaning that CMB is not infl uencing our results.
Table 1
Statistics for items and latent variables (own elaboration)
Latent variables and indicators Str ongly disagr ee (%) Disagr ee (%) Neither agr ee nor disagr ee (%) Ag re e (%) Str ongly agr ee (%) Mean (std . devia tion) L oadings Employability (α = 0.844; CR = 0.882; AVE = 0.519)
Emp1. Globally, the HEI attended allows individuals to fi nd
their fi rst job within six months of graduation 5.4 14.5 36.1 38.6 5.4 3.24 (0.96) 0.622* Emp2. Globally, the HEI attended interacts with the tourism
industry sector. 1.2 12.0 27.7 53.0 6.0 3.51 (0.83) 0.708*
Emp3. Globally, the HEI attended prepares students for the
transition to the job market 1.8 21.8 23.0 47.3 6.1 3.34 (0.95) 0.814*
Emp4. Globally, the degree programme is directly linked and relevant to the successful performance of professional duties
0.6 12.7 17.5 58.4 10.8 3.66 (0.86) 0.768* Emp5. Globally, having a bachelor's degree raises the
expectation of professional enhancement 0.0 8.4 23.5 56.6 9.6 3.64 (0.84) 0.605*
Emp6. Globally, the HEI attended enhances the adequacy
of the studies with respect to the employment requisites 3.0 16.3 31.3 45.2 4.2 3.31 (0.90) 0.724* Emp7. Globally, the HEI attended matches the tourism
industry sector demands. 1.2 15.7 31.9 44.0 7.2 3.40 (0.88) 0.778*
Image
(α = 0.823; CR = 0.871; AVE = 0.533)
I1. Generally, this is a good HEI at which to study 0.6 4.8 12.7 63.9 18.1 3.94 (0.74) 0.805* I2.The HEI attended shows and encourages innovation 1.2 8.4 21.7 52.4 16.3 3.74 (0.87) 0.793* I3.The HEI attended has a trustworthy academic status 3.0 10.8 33.7 42.2 10.2 3.46 (0.93) 0.674* I4. The HEI attended off ers its students educational
achievement 0.0 11.4 28.3 52.4 7.8 3.57 (0.79) 0.802*
I5. The HEI attended supports its graduates 6.0 22.9 28.3 36.1 6.6 3.14 (1.04) 0.622* I6. The HEI attended contributes dynamically to the society
development 0.6 5.4 27.1 59.0 7.8 3.68 (0.72) 0.661*
Expectations
(α = 0.857; CR = 0.889; AVE = 0.535)
E1. Teachers' pedagogical methods 0.6 6.0 35.5 55.4 2.4 3.53 (0.68) 0.733*
E2. Teachers' scientifi c knowledge 0.6 4.8 35.5 53.0 6.0 3.59 (0.71) 0.680*
E3. HEI facilities 9.0 25.9 38.0 22.9 4.2 2.87 (1.00) 0.694*
E4.HEI support functions 4.2 22.3 45.8 24.7 3.0 3.00 (0.87) 0.727*
E5.Overall quality of services in general. 2.4 6.6 51.2 38.0 1.8 3.30 (0.73) 0.780* E6. Preparation for coming job and career 1.8 9.0 32.5 42.2 14.5 3.58 (0.91) 0.720* E7. Services received considering the initial expectations 0.0 6.0 40.4 45.8 7.8 3.55 (0.73) 0.781*
Latent variables and indicators Str ongly disagr ee (%) Disagr ee (%) Neither agr ee nor disagr ee (%) Ag re e (%) Str ongly agr ee (%) Mean (st d . devia tion) L oadings
Quality of human elements (α = 0.893; CR = 0.949; AVE = 0.903)
Q1. Teachers' pedagogical methods 0.0 6.0 36.1 48.8 9.0 3.61 (0.74) 0.958*
Q2. Teachers' scientifi c knowledge 0.6 4.2 35.5 50.0 9.6 3.64 (0.74) 0.942*
Quality of non-human elements (α = 0.839; CR = 0.880; AVE = 0.550)
Q3. Overall quality of the service provided 0.0 5.4 49.4 37.3 7.8 3.48 (0.72) 0.766*
Q4. Courses' curricula 1.2 12.7 44.6 36.7 4.8 3.31 (0.80) 0.659*
Q5. Organization and functioning of the HEI 3.0 7.8 58.4 27.7 3.0 3.20 (0.75) 0.800* Q6.HEI facilities (library, computing services, tutorials …) 5.4 21.7 41.6 24.1 7.2 3.06 (0.98) 0.767*
Q7. Non-teaching staff and services 1.8 12.7 58.4 25.3 1.8 3.13 (0.72) 0.748*
Q8. HEI building 15.1 26.5 30.7 21.7 6.0 2.77 (1.13) 0.702*
Value
(α = 0.882; CR = 0.927; AVE = 0.809)
V1. The value paid for this course at this HEI is rewarded by
the way employers face and look for its graduates 6.6 31.9 34.3 25.3 1.8 2.84 (0.94) 0.897* V2.The value of the education received is rewarded
by the easiness of fi nding the fi rst job 11.4 27.1 31.9 27.1 2.4 2.82 (1.03) 0.915* V3.The value paid for this course is rewarded by
the overall service provided 6.6 20.5 35.5 33.7 3.6 3.07 (0.97) 0.886*
Satisfaction
(α = 0.887; CR = 0.917; AVE = 0.690)
S1. Globally, I am satisfi ed with the services provided
by the HEI attended 0.0 10.2 18.1 65.1 6.6 3.68 (0.75) 0.874*
S2. My expectations regarding overall experience
received were totally satisfi ed 0.0 17.5 13.9 60.2 8.4 3.60 (0.87) 0.818*
S3. As an employee fully integrated in the labour market,
the HEI attended satisfi es my need for advanced studies 3.6 21.7 34.9 36.7 3.0 3.14 (0.91) 0.737* S4. The HEI attended can be considered
as an ideal HEI 7.2 26.5 41.0 22.3 3.0 2.87 (0.94) 0.840*
S5. The services off ered and acquired skills
reward the choice of this HEI 3.6 14.5 29.5 45.8 6.6 3.37 (0.94) 0.875*
Loyalty
(α = 0.850; CR = 0.893; AVE = 0.628) L1. If I had to choose an HEI to graduate,
I'd choose the same 7.2 13.3 25.3 41.6 12.7 3.39 (1.09) 0.878*
L2. If I had to choose a course again,
I'd choose the same 5.4 14.5 23.5 42.2 14.5 3.46 (1.08) 0.625*
L3. I intend to recommend
the HEI attended 4.8 6.6 28.3 49.4 10.8 3.55 (0.94) 0.879*
L4. I intend to recommend the course
I've attended 4.8 9.6 30.7 44.6 10.2 3.46 (0.97) 0.778*
L5. If I choose to continue studying,
I'll do it at the HEI attended 7.2 9.0 35.5 40.4 7.8 3.33 (0.99) 0.774*
Evaluation of the measurement model
Regarding the measurement model, quality assessment is verifi ed since the composite reliability
mea-sures (construct reliability (CR) and Cronbach's alpha coeffi cients (α)) are above the recommended
thresholds for all the latent variables (CR > 0.7; α > 0.7) (Fornell & Larcker, 1981; Hair, Ringle & Sarstedt, 2011). Th ese reliability values can be found in table 1. Th is table also shows the loadings for
the global model resulting from the PLS estimation procedure. Th e loadings are all higher that 0.6 and are signifi cant at 1% signifi cance level, implying that the items are individually reliable (Chin, 1998). Moreover, the measurement model was assessed concerning convergent validity and discriminant va-lidity. Convergent validity is verifi ed when indicators' loadings are statistically signifi cant. In the case of our model, table 1 shows that this result is confi rmed for all items (all loadings with p < 0.01). An average variance extracted (AVE) exceeding 0.5 is another indication of convergent validity (Dillon & Goldstein, 1984), and that occurs regarding the seven latent variables of our model. Discriminant validity was fi rst assessed using the criterion of Fornell and Larcker (1981), which requires that the AVE for one construct must exceed the squared correlations between that construct and all the others. Th is analysis indicates adequate discriminant validity, apart from some punctual situations regarding the construct satisfaction (Table 2). However, a complementary analysis of discriminant validity, based on the cross-loadings, indicates that all items' loadings surpass their cross-loadings, suggesting adequate discriminant validity also in this construct.
Table 2
Correlations among latent variables*
Constructs 1 2 3 4 5 6 7 8
1. Employability 0.721
2. Expectations 0.219 0.731
3. Image 0.723 0.360 0.730
4. Loyalty 0.706 0.270 0.729 0.792
5. Quality human elements 0.398 0.378 0.479 0.462 0.950 6. Quality non-human elements 0.557 0.452 0.709 0.609 0.541 0.742
7. Satisfaction 0.723 0.361 0.817 0.809 0.513 0.709 0.831
8. Value 0.669 0.321 0.547 0.605 0.318 0.494 0.635 0.899
*Diagonal values correspond to the squared value of AVE for each latent variable in order to assess the Fornell-Larcker Criterion.
Evaluation of the structural model and results from FIMIX-PLS
Th e FIMIX-PLS algorithm was repeated for a diff erent number of segments. Th e joint consideration of AIC3 and CAIC statistics suggested a two-segment solution (Sarstedt & Ringle, 2010), in which the measurement model was identical across the latent segments (i.e., invariance in the measurement model). Segment 1 is the smaller, comprising 25.9% of the overall graduate group. Assessing the structural model in PLS-PM implies assessing the path estimates signal, their statistical signifi cance, the R2 for the endogenous latent variables and the GoF measure. An overview of the quality assessment
measures is presented in table 3. Since the FIMIX-PLS algorithm was applied, the results are presented for the global model and for each segment as well.
Th e R2 values of the endogenous latent variables in segment 1 are greater than those in the global model,
indicating that the explained variance has really been improved for the segment 1 model. In this segment, loyalty, satisfaction and image have high values of R2, indicating that all the determinants have a strong
infl uence on these constructs. Segment 2 shows more moderate R2 values for loyalty, satisfaction and
image, although the other constructs have higher values of R2 than in the global model. However, the
values of the average R2 remain greater than those of the global model (with the exception of value),
confi rming that FIMIX-PLS plays an important role in uncovering the unobserved heterogeneity of the global structural equation model. Similarly, the GoF measure (Tenenhaus, Esposito Vinzi, Chatelin & Lauro, 2005) in the segments is greater than that in the global model; thus, its higher value represents better path model estimations than in the global model.
Table 3
Measures of quality assessment of global and FIMIX-PLS segment-specifi c models Global model Segment 1 model Segment 2 model Average R2 N (%) (100%)166 (25.9%)43 (74.1%)123 R2 Image Expectations
Quality of human elements Value Satisfaction Loyalty 0.523 0.133 0.143 0.244 0.754 0.668 0.819 0.382 0.344 0.175 0.954 0.796 0.449 0.505 0.476 0.283 0.721 0.612 0.634 0.444 0.410 0.229 0.838 0.704 GoF 0.479 0.591 0.549
SmartPLS 3.0 produces the path estimates and corresponding statistical signifi cance for both to direct and indirect path coeffi cients, allowing us to test the twelve research hypotheses. Th ese results are pre-sented in Tables 4 and 5 for the global model and the two segment-specifi c models. Table 5 presents the standardised estimates for the direct, indirect and total eff ects related to the hypotheses H8 and H9. Each indirect eff ect, with the symbol b in the table, is obtained by multiplying the direct eff ects involved in the hypothesis (with the symbols d and e) . H8 and H9 are validated or not depending on the sign and signifi cance of these indirect eff ects. Th e total eff ects, with the symbol c in the table, are the sum of the direct eff ect and all indirect eff ects between two constructs (in our case, only those represented in the table). Th e multiple-group comparison results provide evidence of varying relation-ships among constructs for the two segments. Th e t-tests confi rm that the segments are diff erent in all the structural relationships.
Comparing the signifi cance and strength of the structural coeffi cients, the results show that all the relationships hypothesized in H2, H5 and H12 are positive and signifi cant in the three models; however,
they are the strongest in the segment 1 model and the weakest in the segment 2 model. Th e results
regarding the infl uence of employability on image (H2) show that it strongly aff ects image in the two
segments. Th ese results follow those obtained by Duarte et al. (2010), Landrum et al. (2010) and
Soutar and Turner (2002) and for H5 the empirical studies that have shown the impact that image has
on students' satisfaction (Belanger et al., 2010; Brown & Mazzarol, 2009; Martensen et al., 2000). As
for H12, the obtained results follow the same patterns as those found by Butt and Rehman (2010) and
Hennig-Th urau et al. (2001), making loyalty an eff ective consequent variable of satisfaction.
Th e infl uence of employability on satisfaction (H1) is signifi cant and positive in the global model and in the segment 2 model, confi rming the adequacy and relevance of the study of employability as far as tourism higher education is concerned, specifi cally when it comes to understanding students' satisfaction with the service provided by HEIs. Th e path estimate involved in H3 is signifi cant only in
the segment 1 model. However, in the three models, it is negative, implying that H3 is not validated
in any case. Th is may be due to students' lack of understanding of the labour market, their misunder-standing of the concept of employability or their lack of awareness of the importance of employability issues for the process of entering the professional arena. Both segments should be of concern to HEIs in their education programmes, as employability has been shown to be an important antecedent of image, which must be worked from a marketing perspective to enhance the institution's reputation concerning the preparation of employable students.
As in the global model, the segment 2 results show that the stronger the HE image that graduates have, the stronger their expectations of and loyalty towards the HE, verifying H4 and H6, respectively. Th ese results are in accordance with previous studies (Belanger et al., 2010; Brown & Mazzarol, 2009; Cassel & Eklof, 2001; Johnson et al., 2001; Kurtz et al., 1997; Martensen et al., 2000). Expectations do not infl uence satisfaction in any model, i.e., H7 is not validated. Th e nature of the infl uence of expectations on satisfaction is also not very consensual in the results obtained by Martensen et al. (2000), Eskildsen et al. (2000) and Ostergaard and Kristensen (2005). In short, the results obtained for H7 did not al-low us to conclude that the respondents considered in this study lead to results diff erent from those obtained in other studies applied in other contexts.
Th e coeffi cients associated with hypotheses H10 and H11 have a positive signal, as expected considering the previous research, and are signifi cant in segment 1 for H10 and H11, and also in the global model for H11. Once again, the courses' or the HEIs' specifi cities may explain the diff erent behaviour of segment 2 with regard to these relationships, but more research is necessary to explain this result.
Contrarily to the global model and segment 2 results, the expectation of the graduates of segment 1
negatively aff ects satisfaction with HE through the quality of human elements (table 5). However, H8
states that this relationship is signifi cant but positive. So, H8 is not verifi ed in any model. Th is aspect must be explained by the specifi c characteristics of the attended courses but really deserves more research attention. Nevertheless, in the global model and segment 1 model, the quality of non-human elements aff ects satisfaction positively through value, confi rming H9 and following the previous empirical studies by Chiandotto et al. (2007), Chitty and Soutar (2004) and Kristensen et al. (1999).
Concerning the main infl uences on satisfaction and loyalty, the fi ndings of the two-segment solution can be summarized as follows: (1) In segment 1 image and value are the core determinants of satisfac-tion (with path coeffi cients of 0.710 and 0.441, respectively) (table 4). Loyalty is strongly infl uenced by satisfaction (path coeffi cient of 0.774). (2) Segment 2 has image and employability as the main drivers of satisfaction (path coeffi cients of 0.349 and 0.241, respectively) as well as the quality of non-human elements through value (total eff ect estimate of 0.258) (tables 4 and 5). Satisfaction, in turn, jointly with image, infl uences the loyalty towards the HEI (path coeffi cient of 0.604 and 0.211 respectively).
Table 4
Standardized path coeffi cient for the global model and FIMIX-PLS segment results
Hypo-theses Structural paths
Global model Seg 1 model Seg 2 model H1 Employability -> Satisfaction 0.147* -0.172 0.241** H2 Employability -> Image 0.723** 0.905** 0.670** H3 Employability -> Expectations -0.087 -0.598** -0.120 H4 Image -> Expectations 0.423** -0.022 0.785** H5 Image -> Satisfaction 0.448** 0.710** 0.349** H6 Image -> Loyalty 0.205** 0.130 0.211* H7 Expectations -> Satisfaction -0.003 -0.094 0.127
H10 Quality of human elements -> Satisfaction 0.090 0.206** -0.012
H11 Value -> Satisfaction 0.178** 0.441** 0.080
H12 Satisfaction -> Loyalty 0.641** 0.774** 0.604**
Table 5
Direct, indirect and total eff ects related to H8 and H9: standardised estimates
Hypo-theses Eff ects
Global model Segment 1 model Segment 2 model H8 Expectations->Satisfaction Directa -0.003 -0.094 0.127 Indirectb
(via Quality of human elements (QHE)) 0.034 -0.121** -0.008 Totalc 0.031 -0.215** 0.119
Expectations -> QHE Directd 0.378** -0.587** 0.690**
QHE -> Satisfaction Directe 0.090 0.206** -0.012
H9
Quality of non-human elements (QNHE) -> Satisfaction
Directa 0.174** -0.045 0.216**
Indirectb
(via Perceived value (PV) 0.088** 0.184** 0.042 Totalc 0.262** 0.139 0.258**
QNHE -> PV Directd 0.494** 0.418** 0.532**
PV -> Satisfaction Directe 0.178** 0.441** 0.080
** p < 0.05; * p < 0.10; b = d × e; c = a + b
Segments' profi le
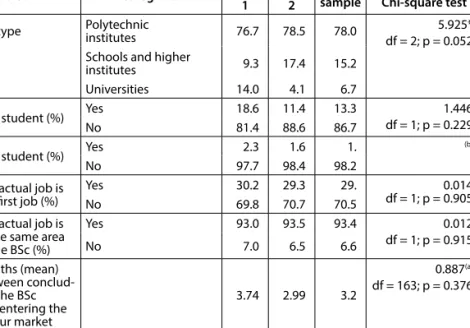
Table 6 presents the distribution diff erences across and within segments. Th e results show signifi cant diff erences only in the graduates' BSc and type of HEI frequented, which indicate that these variables might be discriminant variables of the segments. It is important to note that, contrary to segment 2 and the whole sample, segment 1 has a great percentage of "hospitality management" graduates and more graduates who attended the university.
Th e main characteristics of the graduates' segments are summarized as follows. Th e two segments
reveal similar percentages when it comes to gender, age, and the actual job being the fi rst job. As for education and training, segment 2 presents closer results to those obtained for the whole sample as far as the attended course is concerned. All the other items related to this topic are quite similar in the two segments when compared with the entire sample. Moreover, the items related to work experience reveal that both segments' answers are equivalent to those of the sample, except for the net income, which tends to be higher in segment 1, namely in the category €901 to €1,350.
Table 6
Characteristics of HEI consumers' segments
Variables Categories Segments Overall sample Chi-square testPearson
1 2 Gender (%) Female 69.8 78.9 76.5 df = 1; p = 0.2261.466 Male 30.2 21.1 23.5 Age (mean) 29.6 28.8 29.0 0.802 (a) df = 164; p = 0.424 Net household income (monthly) (%) 451€ to 900€ 59.5 69.2 66.7 2.838 df = 2; p = 0.417 901€ to 1,350€ 38.1 25.8 29.0 More than 1,350€ 2.4 5.0 4.3 BSc (%) Tourism 60.5 77.2 72.9 4.535** df = 1; p = 0.033 Tourism and hospitality
Variables Categories Segments Overall sample Chi-square testPearson
1 2
HEI type Polytechnic institutes 76.7 78.5 78.0 5.925*
df = 2; p = 0.052 Schools and higher
institutes 9.3 17.4 15.2 Universities 14.0 4.1 6.7 MSc student (%) Yes 18.6 11.4 13.3 1.446 df = 1; p = 0.229 No 81.4 88.6 86.7 PhD student (%) Yes 2.3 1.6 1. (b) No 97.7 98.4 98.2
The actual job is the fi rst job (%)
Yes 30.2 29.3 29. 0.014
df = 1; p = 0.905
No 69.8 70.7 70.5
The actual job is in the same area of the BSc (%) Yes 93.0 93.5 93.4 0.012 df = 1; p = 0.915 No 7.0 6.5 6.6 Months (mean) between conclud-ing the BSc and entering the labour market
3.74 2.99 3.2
0.887(a)
df = 163; p = 0.376
(a) T statistic of independent sample t-test; (b) Not possible to verify the assumptions of the Chi-square test.
** Signifi cant at the 0.05 level; * Signifi cant at the 0.1 level.
Discussion and conclusion
Theoretical implications
Th is study reinforces the relevance of the ECSI model in the explanation of satisfaction and loyalty in HE in tourism. Indeed, the results of our empirical study have shown that the ECSI model allows an accurate analysis of graduates' satisfaction, indicating its fl exibility when applied to the educational fi eld. Image, quality, expectations and value have been confi rmed, directly or indirectly, to be deter-minants of graduates' satisfaction and loyalty as its main consequence. Image, in turn, revealed to be
the most important antecedent of satisfaction. Th e contribution of the current study is to explore
the integration of employability into the ECSI model, by identifying and characterizing segments of graduates regarding the relations among its constructs. As demonstrated in this study, employability, shows empirical relevance in the ECSI model, due to its signifi cant impact on image, globally, and in both segments. Th is later segmentation approach is a novelty of this study. Th is means that other institutions willing to use this model to assess their consumers' satisfaction and loyalty must not ignore that not all consumers behave in the same way, and that, in each context, specifi c segments may behave diff erently in the ECSI model. In this sense, this study provides insights on how to test these sources of heterogeneity and how to fi nd and characterize the resulting segments. Once aware of the variables diff erentiating the segments, adequate marketing strategies can be proposed to target these segments.
Managerial implications
Satisfaction should therefore be analysed as a multi-dimensional concept, and the image of HEIs should be enhanced, as this is the precedent that has the greatest impact on it. Regarding image, the results indicate that it is strongly infl uenced by employability, which reveals that HEIs should also invest their eff orts primarily in these two dimensions, image and perceived employability, to obtain the satisfaction and loyalty of their immediate consumers, the students. Quoting Harvey (2010, p. 7), "a degree may once have been a passport into graduate employment: it was indicative of a level of
knowledge and intellectual ability. However, as a result of organizational changes and the expansion in the numbers of graduates, this is no longer the case". Given this reality, and considering the results found, HEIs should make a commitment to ensuring the qualifi cation of human resources in accor-dance with the actual needs of the tourism industry and somehow guarantee students' understanding of the importance of developing employability skills and their development as employable individuals and as relevant advertisers of the institution to the outside market.
Considering the European educational framework and the need to qualify students for the tourism industry, the obtained results stress the importance of employability in higher education. Th e practical implications that result from this study may be refl ected in and stimulated with the adoption of diff erent strategies that will enhance students' employability skills. Th e introduction of mobility programmes within the scope of the Erasmus Programme, the opportunity to carry out professional internships on national and international placements and the introduction of contents within the programme that promote employability skills such as communication, human relations, computing, time management, team working, job-taking initiative and direction and motivation skills, among others, are some of the options that have been and may be put into practice by HEIs when trying to ensure proper embrace-ment of this issue. Clear and transparent communication of these practices to the overall community should also be considered as a strategy to promote HEIs as well as to provide more students with a clear understanding of the importance of becoming employable.
Moreover, these institutions should not ignore the fact that there are two segments of graduates with diff erent responses in the ECSI model. Th ese segments diff er mainly with respect to the BSc obtained and the type of HEI attended. Consequently, future marketing communication strategies must be aware of these discriminant variables and consider them when targeting these segments. For example, promotional materials that better explore each type of course specifi city and employability opportuni-ties should be prepared for each segment, including visual materials to improve the image of the HEIs and the expectations of potential new students. Another possible strategy is to strengthen the link between the academic context and the industry, with more signed protocols, considering the specifi c
characteristics of each BSc and type of HEI at which the courses can be attended. Th is would allow
greater proximity between the companies that are potential employers of each segment of graduates and the corresponding type of HEI, increasing the potential for high levels of employability and, thus, satisfaction and loyalty towards the institutions. Since the relationships between constructs are weaker in segment 2, the communication strategy as well as the protocol eff orts would probably require higher investments to improve the image of the institutions as well as the students' expectations. Th is strategy should also enable to improve the perception of the quality of human elements that students have, with potential positive eff ects on satisfaction and loyalty.
Limitations of the study and further research
Some limitations can be associated with this study, including the fact that it cannot be generalized to other countries, despite this being a normal feature of such a study. Indeed, HE in tourism and the employability conditions are not the same in diff erent countries, which means that the same model tested in diff erent geographical contexts can lead to diff erent fi ndings. Th e view of unemployed gradu-ates or those who have not found a job in the tourism industry would also be interesting to compare with the fi ndings. In addition, the relatively small sample size has impeded the model estimation using the traditional covariance based SEM approach. Th is latter approach would have been benefi cial with regard to the model overall fi t measures, since the lack of global goodness-of-fi t measures is still con-sidered a drawback of PLS-PM (Hair, Sarstedt, Pieper & Ringle, 2012). So, future studies with larger
samples, allowing the use of covariance based SEM, would be desirable since global goodness-of-fi t measures permit to compare alternative models, with more or less latent variables and items, which would improve the comprehension of this thematic. A fi nal limitation of our study is the use of an instrument where all items are measured by the same respondent and using the same scale, which can be sources of common method bias. Although the Harman's (1967) test shows that CMB is not a concern in our study, further research, including replications of our model in diff erent contexts, is desirable in order to refi ne the instrument design and data collection procedures. Examples of these improvements include using a counterbalance question order in the questionnaire, measures from diff erent sources, and the enhancement of the scale items (Podsakoff , MacKenzie & Podsakoff , 2012). Regarding the results obtained for both segments, they emphasize the importance of an institutional image's management and subsequent analysis of higher education students so that institutions may refl ect on the heterogeneity of their main consumers and outline strategies that will reach diff erent public targets. Th erefore, further research is required to improve the characterization of the identi-fi ed segments, speciidenti-fi cally concerning the aspects that have a potentially discriminant power between segments, for interpretation purposes and to gain additional insights. Other signifi cant opportunities for further research within this topic include trying to gain a deeper understanding of the reasons for the existence of a segment of students to whom employability does not increase satisfaction, as this information will certainly represent an important asset for institutions and for developing a set of guidelines for HEIs or education policy to deal with these reasons.
References
Aggett, M. & Busby, G. (2011). Opting out of internship: Perceptions of hospitality, tourism and events management undergraduates at a British University, Journal of Hospitality, Leisure, Sport & Tourism Education, 10(1), 106-113. Airey, D. (1997). Attitudes to careers in tourism: An Anglo Greek comparison. Tourism Management, 18(3), 149-158. Alves, H. & Raposo, M. (2007). Conceptual model of student satisfaction in higher education. Total Quality
Manage-ment, 18(5), 571-588.
Anctil, E, (2008). Selling Higher Education: marketing and advertising America's Colleges and Universities. ASHE
Higher Education Report, 34(2). Las Vegas: ASHE Higher Education Report Series.
Anderson, E. W. & Sullivan, V. W. (1993). The antecedents and consequences of customer satisfaction for fi rms.
Mar-keting Science, 12, 125-143.
Belanger, C., Mount, J. & Wilson, M. (2010). Institutional image and retention. Tertiary Education and Management,
8(3), 217-230.
Brown, R. & Mazzarol, T. (2009). The importance of institutional image to student satisfaction and loyalty within higher education. Higher Education, 58, 81-95.
Butt, B. & Rehman, K. (2010). A study examining the students satisfaction in Higher Education. Procedia Social and
Behavioral Sciences, 2, 5446–5450.
Campostrini, S. & Gerzeli, S. (2007). Informative sources for the evaluation of the university education eff ectiveness in Italy. In L. Fabbris (ed.), Eff ectiveness of University Education in Italy. Employability, Competences, Human Capital (pp. 2-9). Padua: Physica Verlag.
Cassel, C. & Eklof, J. A. (2001). Modelling customer satisfaction and loyalty on aggregate levels: Experience from the ECSI pilot study. Total Quality Management, 12(7&8), 834-841.
Chiandotto, B., Bini, M. & Bertaccini, B. (2007). Quality assessment of the university educational process: an application of the ECSI model. In L. Fabbris. (ed.), Eff ectiveness of University Education in Italy. Employability, Competences,
Human Capital (pp. 43-54). Padua: Physica Verlag.
Chin, W. (1998). The partial least squares approach to structural equation modeling. In G. A. Marcoulides, Modern
Chitty, B. & Soutar, G. N. (2004). Is the European customer satisfaction index model applicable to tertiary education? ANZMAC 2004 Conference Wellington (pp. 1-7). Australian and New Zealand Marketing Academy.
Daniel, A., Costa, R., Pita, M. & Costa, C. (2017). Tourism Education: What about entrepreneurial skills? Journal of
Hospitality and Tourism Management, 30, 65-72.
Davcik, N. S. (2014). The use and misuse of structural equation modeling in management research: A review and critique. Journal of Advances in Management Research, 11(1), 47-81.
De Vos, A., De Hauw, S. & Van der Heijden, B. (2011). Competency development and career success: The mediating role of employability. Journal of Vocational Behavior, 79, 438-447.
Dhiman, M. C. (2012). Employers' perceptions about tourism management employability skills. Anatolia – International
Journal of Tourism and Hospitality Research, 23(3), 359-372.
Duarte, P., Alves, H. & Raposo, M. (2010). Understanding university image: A structural equation model approach.
International Review on Public and Nonprofi t Marketing, 7, 21-36.
ECSI Technical Committee (1998). European customer satisfaction index. Foundation and structure for harmonized
national pilot projects. European Comission (DGIII, Industry) and European Organizationfor Quality (EOQ).
Eskildsen, J., Martensen, A., Gronholdt, L. & Kristensen, K. (2000). Benchmarking student satisfaction in higher educa-tion based on the ECSI methodology. Sinergie raporti di ricerca, 9, 385-402.
Eurico, S., Valle, P. & Silva, J. (2013). Satisfaction towards tourism higher education: the graduates' perspective.
Inter-national Journal of Academic Research, 5(4), 35-49.
Eurico, S., Valle, P. & Silva, J. (2015). Journal of Hospitality, Leisure, Sport & Tourism Education, 16, 30-41.
Fabra, M. & Camisón, C. (2009). Direct and indirect eff ects of education on job satisfaction: A structural equation model for the Spanish case. Economics of Education Review, 28, 600-610.
Floh, A., Zauner, A., Koller, M. & Rush, T. (2014). Customer segmentation using unobserved heterogeneity in the perceived-value-loyalty-intentions link. Journal of Business Research, 67, 974-982.
Fornell, C. & Larcker, D. (1981). Structural equation models with unobservable variables and measurement error: Algebra and statistics. Journal of Marketing Research, 18(3), 328-388.
Forrier, A. & Sels, L. (2003). The concept of employability, a complex mosaic. International Journal of Human Resources
Development and Management, 3(2), 102-104.
Hahn, C., Johnson, M. D., Herrmann, A. & Huber, F. (2002). Capturing customer heterogeneity using a fi nite mixture PLS approach. Schmalenbach Business Review, 54(3), 243-269.
Hair, J. F., Ringle, C. & Sarstedt, M. (2011). PLS-SEM: Indeed a Silver Bullet. Journal of Marketing Theory and Practice,
19(2), 139-151.
Hair, J. F., Sarstedt, M., Pieper, T. M. & Ringle, C. M. (2012). The Use of Partial Least Squares Structural Equation Modeling in Strategic Management Research: A Review of Past Practices and Recommendations for Future Applications.
Long Range Planning, 45, 320-340.
Harman, H. H. (1967). Modern Factor Analysis. Chicago, IL: University of Chicago Press.
Harvey, L. (2001). Defi ning and Measuring Employability. Quality in Higher Education, 7(2), 97-109.
Harvey, L., Locke, W. & Morey, A. (2002). Enhancing employability, recognizing diversity. Making links between higher
education and the world of work. Manchester: CSU: Universities of UK.
Harvey, L. (2010). New realities: The relationship between higher education and employment. Tertiary Education
Management, 6(1), 3-17.
HEFCE (2001). Higher education funding council for England. Retrieved from http://www.hefce.ac.uk.
Hennig-Thurau, T., Langer, M. & Hansen, U. (2001). Modeling and managing student loyalty: An approach based on relationship quality. Journal of Service Research, 4, 331-344.
Henseler, J., Ringle, C. & Sinkovics, R. R. (2009). The Use of Partial Least Squares Path Modeling in International Mar-keting. Advances in International Marketing, 20, 277-319.
Johnson, M., Anderson, E. & Fornell, C. (1995). Rational and adaptive performance expectations in a customer satis-faction framework. Journal of Consumer Research, 21, 695-707.
Johnson, M., Gustafsson, A., Andreassen, T. W., Lervik, L. & Cha, J. (2001). The evolution and future of national customer satisfaction index models. Journal of Economic Psychology, 22, 217-245.
Kanji, G. K. & Tambi, A. M. (1999). Total quality management in UK higher education institutions. Total Quality
Man-agement, 10(1), 129-153.
Kivinen, O. & Nurmi, J. (2007). Job Requirements and Competences: Do qualifi cations matter? In U. Techler, Careers
of University Graduates (p. 131-142). Kassel: Springer.
Knight, P. & Yorke, M. (2003). Employability and good learning in higher education. Teaching in Higher Education,
8(1), 3-16.
Knight, P. & Yorke, M. (2010). Employability through the curriculum. Tertiary Education and Management, 8(4), 261-276. Kristensen, K., Martensen, A. & Gronholdt, L. (1999). Measuring the impact of buying behavior on customer
satisfac-tion. Total Quality Management, 10(4/5), 602-614.
Kristensen, K., Martensen, A. & Gronholdt, L. (2000). Customer satisfaction measurement at post Denmark: Results of application of the European customer satisfaction index methodology. Total Quality Management, 11(7), 1007-1015.
Kurtz, D., Clow, K., Ozment, J. & Ong, B. (1997). The antecedents of consumer expectations of services: An empirical study across four industries. The Journal of Services Marketing, 11(4), 230-248.
Landrum, R., Turrisi, R. & Harless, C. (2010). University image: The benefi ts of assessment and modeling. Journal of
Marketing for Higher Education, 9(1), 53-68.
Lewin, J.; Biemans, W. & Ulaga, W. (2010). Firm downsizing and satisfaction among United States and European customers. Journal of Business Research, 63, 697-706.
Lopez-Bonilla, J. & Lopez-Bonilla, L. (2012). Holistic competence approach in tourism higher education: An exploratory study in Spain. Current Issues in Tourism, 1, 1-15.
MacKinnon, D. P., Lockwood, C. M., Hoff man, J. M., West, S. G. & Sheets, V. (2002). A comparison of methods to test the signifi cance of the mediated eff ect. Psychological Methods, 7, 83-104.
MacKinnon, D. P., Lockwood, C. M. & Williams, J. (2004). Confi dence limits for the indirect eff ect: Distribution of the product and resampling methods. Multivariate Behavioral Research, 39, 99-128.
Martensen, A., Grønholdt, L., Eskildsen, J. K. & Kristensen, K. (2000). Measuring student oriented quality in higher education: Appllication of the ECSI methodology. Sinergie rapporti di ricerca, 9, 371-383.
Mason, G., Williams, G. & Cranmer, S. (2009). Employability skills initiatives in higher education: What eff ects do they have on graduate labour market outcomes? Education Economics, 17(1), 1-30.
Mason, G., Williams, G., Cranmer, S. & Guile, D. (2003). How much does higher education enhance the employability of
graduates? (Report to HEFCE). Retrieved May 12, 2009, from http://www.hefce.ac.uk/Pubs/RDreports/2003/
rd13_03/.
Ministério da Economia e da Inovação [MEI] (2007). Plano estratégico nacional do turismo para o desenvolvimento do
turismo em Portugal. Lisboa: Turismo de Portugal.
Oliver, R. L. (1996). Satisfaction: A behavioral perspective on the vonsumer. Colombus: McGraw-Hill College.
Ostergaard, D. P. & Kristensen, K. (2005). Drivers of student satisfaction and loyalty at diff erent levels of higher education
(HE) - cross-institutional results based on the ECSI methodology. Retrieved January 10, 2009, from http://www.
google.pt/search?
Pampaloni, A. (2010). The infl uence of organizational image on colleges election: What students seek in institutions of Higher Education. Journal of Marketing for Higher Education, 20(1), 19-48.
Podsakoff , P. M., MacKenzie, S. B., Lee, J. Y. & Podsakoff , N. P. (2003). Common method biases in behavioral research: A critical review of the literature and Recommended Remedies. Journal of Applied Psychology, 88(5), 879-903. Podsakoff , P. M., MacKenzie, S. B. & Podsakoff , N. P. (2012). Sources of method bias in social science research and
Rigdon, E. E., Ringle, C. M. & Sarstedt, M. (2010). Structural modeling of heterogeneous data with partial least squares. In N. K. Malhotra (Ed.), Review of Marketing Research (pp. 255-296). Armonk: Sharpe.
Ringle, C. M., Wende, S. & Becker, J. M. (2015) SmartPLS 3. Boenningstedt: SmartPLS GmbH. Retrieved from http:// www.smartpls.com.
Ringle, C. M., Wende, S. & Will, A. (2010). Finite mixture partial least squares analysis: methodology and numerical examples. In V. E. Vinzi, J. Henseler & H. Wang (Eds), Handbook of Partial Least Squares (pp. 195-218). Berlin: Springer-Verlag.
Roni, M. S. (2014). Introduction to SPSS, School of Business, Edith Cowan University, Australia. Retrieved from www. researchgate.net/publication/262151892_ Introduction_to_SPSS.
Sarstedt, M. (2008). A review of recent approaches for capturing heterogeneity in partial least squares path modelling.
Journal of Modelling in Management, 3(2), 140-161.
Sarstedt, M. & Ringle, C. M. (2010). Treating unobserved heterogeneity in PLS path modeling: a comparison of FIMIX-PLS with diff erent data analysis strategies. Journal of Applied Statistics, 37(7-8), 1299-1318.
Sarstedt, M., Becker, J.-M., Ringle, C. M. & Schwaiger, M. (2011). Uncovering and Treating Unobserved Heterogeneity with FIMIX-PLS: Which Model Selection Criterion Provides an Appropriate Number of Segments? Schmalenbach
Business Review, 63(1), 34-62.
Schomburg, H. & Teichler, U. (2006). Higher education and graduate employment in Europe. The Netherlands: Springer. Smith, K., Clegg, S., Lawrence, E. & Todd, M. (2007). The challenges of refl ection: students learning from work
place-ments. Innovations in Education and Teaching International, 44(2), 131-141.
Soutar, G. & Turner, J. (2002). Students' preferences for university: A conjoint analysis. The International Journal of
Educational Management, 16(1), 40–45.
Tenenhaus, M., Esposito Vinzi, V., Chatelin, Y. M. & Lauro, C. (2005). PLS path modeling. Computational Statistics and
Data Analysis, 48(1), 159-205.
Tomlinson, M. (2007). Graduate employability and student attitudes and orientations to the labour market. Journal
of Education and Work, 20(4), 285-304.
Vinzi, V., Chin, W., Henseler, J. & Wang, H. (2010). Handbook of Partial Least Squares. Concepts, Methods and
Applica-tions. Heidelberg: Springer.
Wakelin-Theron, N. (2014). Employability development in Higher Education institutions: a tourism student perspec-tive. African Journal of Hospitality, Tourism and Leisure, 3(1), 1-16.
Wilton, N. (2008). Business graduates and management jobs: an employability match made in heaven? Journal of
Education and Work, 21(2), 143-158.
Yorke, M. (2004). Employability in the undergraduate curriculum: some student perspectives. European Journal of
Education, 39(4), 109-427.
Zeithaml, V. (1987). Defi ning and relating price, perceived quality and perceived value (Report no. 87-101). Cambridge: Marketing Science Institute.
Submitted: 11/12/2017 Resubmitted: 16/05/2018 Accepted: 20/05/2018