Long-term panmixia in a cosmopolitan Indo-Pacific coral reef fish
and a nebulous genetic boundary with its broadly sympatric
sister species
J . B . H O R N E *† & L. V A N H e r w e r d e n *
*Molecular Ecology and Evolution Laboratory, School of Tropical and Marine Biology, James Cook University, Townsville, Qld, Australia †Centre of Marine Sciences, University of Algarve, Faro, Portugal
Keywords:
Acanthuridae; dispersal;
incomplete lineage sorting; Indo-Pacific barrier; introgression; metapopulation; Naso.
Abstract
Phylogeographical studies have shown that some shallow-water marine organisms, such as certain coral reef fishes, lack spatial population structure at oceanic scales, despite vast distances of pelagic habitat between reefs and other dispersal barriers. However, whether these dispersive widespread taxa constitute long-term panmictic populations across their species ranges remains unknown. Conventional phylogeographical inferences frequently fail to distinguish between long-term panmixia and metapopulations con-nected by gene flow. Moreover, marine organisms have notoriously large effective population sizes that confound population structure detection. Therefore, at what spatial scale marine populations experience independent evolutionary trajectories and ultimately species divergence is still unclear. Here, we present a phylogeographical study of a cosmopolitan Indo-Pacific coral reef fish Naso hexacanthus and its sister species Naso caesius, using two mtDNA and two nDNA markers. The purpose of this study was two-fold: first, to test for broad-scale panmixia in N. hexacanthus by fitting the data to various phylogeographical models within a Bayesian statistical framework, and second, to explore patterns of genetic divergence between the two broadly sympatric species. We report that N. hexacanthus shows little popula-tion structure across the Indo-Pacific and a range-wide, long-term panmictic population model best fit the data. Hence, this species presently comprises a single evolutionary unit across much of the tropical Indian and Pacific Oceans. Naso hexacanthus and N. caesius were not reciprocally monophyletic in the mtDNA markers but showed varying degrees of population level divergence in the two nuclear introns. Overall, patterns are consistent with secondary introgression following a period of isolation, which may be attrib-uted to oceanographic conditions of the mid to late Pleistocene, when these two species appear to have diverged.
Introduction
The Indo-Pacific is among the largest biogeographical regions in the world. Randall (1998) defined the Indo-Pacific region as the tropical and subtropical marine
habitats that stretch from the Red Sea and east coast of Africa to Hawaii and Easter Island in the Central Paci-fic. Some authors have since divided the Indo-Pacific into smaller more manageable eco-regions (Spalding et al., 2007; Allen, 2008; Veron et al., 2009; Briggs & Bowen, 2012), however, as Randall (1998) points out, nearly 500 species of shorefishes (excluding sharks and rays) are cosmopolitan virtually throughout the Indo-Pacific. Further, Allen (2008) remarks that ~1600 spe-cies of reef fishes have geographical distributions that are either genuinely discontinuous, or poorly reported Correspondence: John B. Horne, School of Tropical and Marine Biology,
Molecular Ecology and Evolution Laboratory, James Cook University, Townsville, Qld 4811, Australia.
Tel.: 61 07 4781 6286; fax: 61 07 4724 1770; e-mail: john.horne@gmail.com
across the Indo-Pacific. Therefore, in light of the large geographical scale at which Indo-Pacific biodiversity is distributed, ocean-wide studies are essential to a big-picture understanding of evolution in highly diverse coral reef ecosystems.
The ability of some shallow-water marine species, such as coral reef fishes, to expand their geographical ranges so widely is attributable to a highly dispersive pelagic larval phase (Lester & Ruttenberg, 2005; Lester et al., 2007) that may sometimes cross thousands of kilometres of deep ocean habitat to settle on distant coral reefs (Lessios & Robertson, 2006). Many reef fish larvae, in particular, are highly mobile and posses acute sensory abilities that enable them to locate suitable settlement habitat, which is sparse in the ocean (Lecchini et al., 2005; Leis, 2006; Gerlach et al., 2007; Leis et al., 2007a, b, 2009; Wright et al., 2011). Further, the larvae of some coral reef fishes are known to spend months in the pelagic environment (Victor, 1991; Wilson & McCormick, 1999), suggesting that long distance dispersal is regularly achievable.
Phylogeographical studies of coral reef fishes often reveal genetic structuring only at the largest geographi-cal sgeographi-cales (Bowen et al., 2001; Bay et al., 2004; Craig et al., 2007; Gaither et al., 2010, 2011a, b; Leray et al., 2010; Winters et al., 2010; Eble et al., 2011; Fitzpatrick et al., 2011), in concordance with known biogeographi-cal boundaries (Bellwood & Wainwright, 2002; Rocha et al., 2007; Rocha & Bowen, 2008), suggesting that gene flow at most spatial scales is high for a large num-ber of species. In some extreme cases, certain reef fishes lack genetic structure entirely, across their large Indo-Pacific ranges in a pattern that resembles panmixia (Klanten et al., 2007; Horne et al., 2008; Reece et al., 2010). Some pelagic dispersing marine invertebrates also appear to have large unstructured populations throughout the Indo-Pacific (Lessios et al., 2001; Cran-dall et al., 2008). True panmixia requires random mat-ing, which is not possible among isolated adult reef fish populations, but an effective long-term panmixia, called eurymixia in the language of Dawson et al. (2011), across the Indo-Pacific may be plausible for a highly dispersive reef dwelling organism. Yet, few studies have employed the statistical rigour necessary to explicitly test this possibility.
In the absence of distinct spatial population structure, conventional phylogeographical methods, such as fre-quency-based fixation indices (FST), often fail to differ-entiate between long-term panmictic random mating and scenarios where discrete populations are connected by gene flow (Beerli & Palczewski, 2010; Marko & Hart, 2011) and also suffer from other limitations. This is par-ticularly true for many widespread marine species, where high genetic variation and large effective popula-tion size limit the amount of genetic subdivision that can be detected (Hedgecock et al., 2007; Hellberg, 2007, 2009). Therefore, further investigations into highly dispersive and widespread reef organisms are warranted
to resolve whether these patterns indicate long-term random mating at large geographical scales or popula-tions with separate evolutionary trajectories.
Here, we present a phylogeographical study of the sleek unicornfish, Naso hexacanthus (Acanthuridae; Bleeker, 1855), and its broadly sympatric sister species, the blue–grey unicornfish, Naso caesius (Randall & Bell, 1992). Naso hexacanthus is found ubiquitously in the Indo-Pacific and tropical eastern Pacific, but N. caesius is restricted to the Pacific plate and a few locations in the east Indian Ocean (Randall, 2002). As far as it is known, both species are ecologically similar and wher-ever their ranges overlap they are often observed simultaneously, foraging in open water adjacent to coral reefs. Naso hexacanthus is individually known to feed primarily on gelatinous zooplankton (Choat et al., 2002), has been recorded from shallow water to depths of up to 229 m (Chave & Mundy, 1994) and has a pelagic larval duration in excess of 90 days (Wilson & McCormick, 1999). The same ecological data are not available for N. caesius but given a close phylogenetic relationship (Klanten et al., 2004), similar ecological attributes might be expected.
The purpose of this study was two-fold. First, we aimed to conduct a broad-scale phylogeographical study on the two aforementioned Naso species for the purpose of investigating the possibility of long-term panmixia, particularly in the more cosmopolitan N. hexacanthus. To this end, genetic variation was surveyed in both spe-cies from two mtDNA markers and two nDNA introns across their respective geographical distributions. In addition to conventional, frequency-based, population genetic fixation indices, phylogeographical models were used to test the fit of the data against a scenario of long-term panmixia and multi-population alternatives. Model-based phylogeography can correctly reject a model of panmixia, even when intrinsic patterns in the data fail to do so (Beerli & Palczewski, 2010).
The second purpose of this study was to investigate the genetic relationship between N. hexacanthus and N. caesius. Commonly, coral reef fish sister taxa are allopatrically distributed (Blum, 1989; Randall, 1998; Briggs, 2006) and if their distributions overlap, hybrid-ization is frequently observed in these geographically restricted zones, often with evidence of hybrid backcrossing (Pyle & Randall, 1994; McMillan et al., 1999; Randall, 2002; van Herwerden & Doherty, 2006; Marie et al., 2007; Hobbs et al., 2009, 2010). Most likely, distinct morphospecies, recently evolved in allop-atry, have not yet developed the post-zygotic barriers necessary for reproductive isolation (i.e. hybridizing butterflyfish sister species pairs – McMillan et al., 1999; Montanari et al., 2012). Sympatrically distributed species, on the other hand, are expected to have stronger reproductive barriers (Coyne & Orr, 2004), but such cases are not well explored in molecular studies of reef fishes. In two previous studies, Dayton et al. (1994) and
Dayton (2001) report fixed allelic differences in a single allozyme locus (creatine kinase), between N. hexacan-thus and N. caesius. Thus, it was predicted that nucleo-tide polymorphisms might reveal greater genetic boundaries in these fish relative to other coral reef fish sister species pairs. In this study, however, N. hexacan-thus and N. caesius did not exhibit a clear-cut genetic species boundary, probably diverged in the recent Pleistocene under allopatric conditions and are likely to have experienced genetic incompatibilities upon secondary contact that prevented the collapse of the two newly formed species.
Materials and methods Sample collections
A total of 118 N. hexacanthus individuals were collected from ten locations, four in the Indian Ocean and six in the Pacific (Fig. 1). In addition, 30 N. caesius individuals were also collected from four of these locations: two in the Indian Ocean and two in the Pacific Ocean. Sam-ples were obtained by spearing or were purchased from local fishers. Both species are similar in appearance, with a few diagnostic differences (Randall & Bell, 1992). Here, specimens that lacked yellowish ventral colouration and a purple caudal fin, and that did not show markings on the operculum, were identified as N. caesius (Fig. 2). After identification in the field, speci-mens were photographed for further verification. A clip of fin tissue from each specimen was preserved in 80% ethanol for transport and storage.
Laboratory procedures mtDNA markers
Whole genomic DNA was extracted from fin tissue via a proteinase K digestion in a chelex buffer (Walsh et al., 1991). PCR amplification was carried out in 20lL reactions containing 2lL 109 Pfu buffer, 200 lMof each
dNTP, 10lMeach of forward and reverse and 0.1 U Pfu DNA polymerase (Promega, Madison, WI, USA) and 1lL of chelex extracted DNA template. PCR was per-formed using conventional thermocycling parameters with 35 cycles. Two mtDNA markers were PCR amplified from genomic DNA: a segment of the mitochondrial con-trol region (mtCR) using the genus specific primers of Klanten et al. (2007) and a segment of the cytochrome oxidase subunit 1 (COI) gene using the universal primers for fish of Ward et al. (2005). Primer sequences, product sizes and annealing temperatures are reported in Table 1. PCR products were confirmed on 1.5% agarose gels. PCR purification and DNA sequencing was carried out at Macrogen sequencing service Seoul, South Korea. PCR products were sequenced in one direction using the forward primers of each primer pair. MtDNA sequences from this study can be found on GenBank, accession numbers: KC212823–KC213057 and Dryad repository: doi: 10.5061/dryad.94366.
nDNA markers
Two nuclear introns were targeted for PCR amplifica-tion in the target taxa. The first was a fragment of the metabolic gene enolase, initially amplified from universal primers Enol F-1 and Enol R-4, designed by Kelly & Palumbi (2009). Initial PCR amplifications yielded double
Naso hexacanthus
Seychelles
Christams Is.
Western Australia
Papua New Guinea
Great Barrier Reef Marquesas Tonga Philippines Naso caesius (hex = 27) (hex = 10) (cae = 13) (hex = 5) (cae = 6) (hex = 26) (hex = 8) (hex = 11) (cae = 7) (hex = 16) (cae = 4) (hex = 5) (n = 118) (n = 30) Red Sea (hex = 6) Taiwan (hex = 4)
Fig. 1 Map showing collections of Naso hexacanthus and Naso caesius. Light blue area (light grey in print edition) generalizes the species distribution of N. hexacanthus, while dark blue areas (dark grey in print) alone represent the general distribution of Naso caesius.
banded PCR products. Both bands were excised from agarose gels and sequenced. From one of these bands, we recovered a~300 bp DNA segment of approximately the same size and polymorphism as described in Kelly & Palumbi (2009) and had high homology in the pri-mer binding regions but which otherwise did not have high homology with other teleost enolase sequences on GenBank. Taxon specific primers were designed for this enolase-like marker (hereafter called EnolN) for which PCR parameters are similar to those described above (Table 1). PCR products for this marker were sequenced with the EnolN-F primer. Individuals that were initially shown to be heterozygous at more than one site were redone to ensure accurate sequencing. GenBank acces-sion numbers for this marker are KC212687-KC212816 and the Dryad repository number: doi: 10.5061/dryad. 94366.
The second nuclear intron targeted was Creatine Kinase, the protein for which Dayton et al. (1994) and Dayton (2001) reported fixed allozyme differences between N. hexacanthus and N. caesius. The Creatine Kinase intron was initially PCR amplified using the
universal primers CKA7-F and CKA7-R2, designed for teleosts by Quattro & Jones (1999). In N. hexacanthus and N. caesius, the amplicon produced from these prim-ers was weak and was > 1000 bp in length, making sequencing difficult. A small number of individuals were sequenced in both directions for this locus, after multiple PCR reactions (GenBank accession nos. KC212817–KC212822) but attempts to design taxon specific primers for this marker proved elusive. As an alternative to sequencing this marker, two conspicuous polymorphic sites were identified with restriction endo-nuclease binding sites for DraI and BtsC1 enzymes (New England Biolabs, Ipswich, MA, USA). Restriction enzyme digests were carried out with these two enzymes as per the manufacturer’s instructions. Digested DNA was viewed on 1.5% agarose gels.
Genetic diversity indices and fixation indices Raw DNA sequence data were imported into GENEIOUS PRO 5.0 (Biomatters, Ltd., Auckland, NZ, USA), where DNA sequences were trimmed and aligned using the
(a) (b)
(c) (d)
Fig. 2 Photographs of Naso hexacanthus and Naso caesius. (a) N. hexacanthus, Australian Great Barrier Reef, photo credit John B. Horne.
(b) N. hexacanthus, nuptial coloration, Red Sea, photo by John E. Randall. (c) N. hexacanthus (above), N. caesius (below), photo credit Emma Gordon. (d) N. caesius, nuptial coloration, Marshall Islands, photo by John E. Randall.
Table 1 Names of all loci, PCR primer sequences, size of the PCR amplicon in number of base pairs (bp), primer annealing temperature (Ta) and source reference for each marker.
Locus name Oligo sequence 5′–3′ bp Ta Source
NAI (mtCR) F– AGCATTCTGAACTAAACTAC
R– TGTCCCTTGACTCTCAATA
300 50°C Klantenet al. (2007)
Fish 1 (COI) F– TCAACCAACCACAAAGACATT GGCAC
R– TAGACTTCTGGGTGGCCAAAGAATCA
668 55°C Wardet al. (2005)
CKA7 Creatine Kinase F– CCCAAGTTYGAGGAGATCCTGAC R2– CAGTCGGTCRGCRTTGGAGATGTC
1053 58°C Quattro & Jones, 1999
EnolN (nDNA) F– CACGCTAGCACTTGCACACTGT
R– ACTGGGTGGTTGACAGGCAGGT
GENEIOUS alignment function at default settings. DNA sequences were then further aligned and edited manu-ally. For the nuclear gene EnolN, heterozygous bases were initially identified using the find heterozygotes function in GENEIOUS, with a 75% similarity requirement
between peaks. The gametic phases of alleles possessing more than a single heterozygous polymorphism were determined using the PHASE algorithm (Stephens & Donnelly, 2003), which is a coalescent-based Bayesian analysis, implemented in DNASP v. 5.10 (Librado &
Rozas, 2009). The parameters for this analysis were 1000 iterations, a thinning interval of 1, a burn-in of 100 iterations and five replicate runs, each with a sepa-rate starting seed. Allelic states were further validated using the parsimony-based method HAPAR (Wang & Xu, 2003), also implemented in DNAsp. We also used DNAsp to test for background selection in the EnolN marker by way of Fu and Li’s D* and F* tests (Fu & Li, 1993), which are more sensitive to background selec-tion and less sensitive to populaselec-tion expansion than other neutrality tests (Fu, 1997; Ramos-Onsins & Rozas, 2002).
Diversity indices for mtDNA (number of haplotypes, haplotype diversity, nucleotide diversity) were esti-mated in DNAsp. Diversity indices for the nuclear EnolN gene, number of alleles, expected heterozygosity, observed heterozygosity population specific FISand tests of Hardy–Weinberg equilibrium were calculated in
ARLEQUINv. 3.5 (Excoffier & Lischer, 2010), after 10 000
permutations of the data. Fu’s FS test of selective neutrality (Fu, 1997) was also performed inARLEQUIN to
test for population expansion in the two mtDNA mark-ers. Tests of population genetic differentiation were conducted independently for each molecular marker using analysis of molecular variance (AMOVA) (Excoffier
et al., 1992), performed in ARLEQUIN, after 10 000
per-mutations of the data. For N. hexacanthus, overall AMOVA
(ΦST) included all sampling locations with eight or more individuals. AMOVA of Indian vs. Pacific groupings of
N. hexacanthus was conducted to assess population structure at the largest geographical scale and included all individuals. A N. hexacanthus vs. N. caesiusAMOVAwas also performed to explore the level of marker fixation between these two closely related taxa. Pairwise tests of population structure (FST) were conducted for all loca-tions with seven individuals or more. To avoid type I error in multiple pairwise comparisons, we calculated the false discovery rate using the method of Benjamini & Yekutieli (2001), recommended by Narum (2006). Parsimony networks of mtDNA haplotypes, and EnolN alleles, were constructed using the program TCS (Clem-ent et al., 2000) for both species jointly. Gaps in the alignment (only present in the mtCR) were not treated as fifth character state. The best model of DNA substitu-tion was evaluated for each marker in the program
JMODELTEST v. 0.1.1 (Posada, 2008), using the Akaike information criterion.
Model-based phylogeography
Marginal likelihood comparisons (Bayes factors), from thermodynamically heated coalescent simulations, were used to assess the fit of the data to a general model of panmixia at the largest geographical scale, that is, the entire Indo-Pacific constitutes a single long-term ran-domly mating population. For an alternative model to panmixia we favoured a simplistic scenario, to mini-mize subjectivity and avoid overly complex models for a taxon where prior information is limited. Specifically, global panmixia was tested against a two-population model, with an Indian Ocean population and a Pacific Ocean population. This scenario is consistent with a major phylogeographical break observed in many Indo-Pacific species (Benzie, 1999; Rocha et al., 2007; Carpenter et al., 2011) and is the most logical two-population configuration of the data. Individuals from Western Australia were excluded from this analysis because notwithstanding it is in the Indian Ocean, some studies suggest that Western Australian marine populations are more closely allied with the Pacific (Bay et al., 2004; Gaither et al., 2011a). We tested three variations of the two-population migration model: bidi-rectional migration, strict east to west migration, strict west to east migration. Testing the directionality of gene flow is justified because the dominant ocean cur-rent between oceans, the Indonesian through flow, runs westerly from the Pacific into the Indian Ocean and is thought to heavily impede marine dispersal in the opposite direction (Carpenter et al., 2011). Finally, we also tested a bidirectional migration model where the population boundary was between the West Indian Ocean (Seychelles and the Red Sea) and all other loca-tions (see Briggs & Bowen, 2012).
Model testing was conducted in the programMIGRATE-n
v. 3.2.6 (Beerli, 2006), following the methods of Beerli & Palczewski (2010). To conserve computational resources, a subset of 20 individuals per population (N. hexacanthus only) was randomly selected from sam-pling locations in each ocean. The infile for this analysis contained a multilocus COI and EnolN sequence data set. The mtCR was not used in this analysis because of numerous indels and a questionable alignment (see Results). For EnolN, the rate of inheritance for the nDNA was scaled to 0.25, comparable to mtDNA, using the inheritance scalar in MIGRATE-n, to allow for easy interpretation of multilocus parameters. Both COI and EnolN were run using the F84 substitution model, with transition/transversion ratios of 23.485 and 1650.7, respectively, as indicated by JMODELTEST. Mutation rates
of each locus were allowed to vary relative to each other. Bayesian analysis consisted of one long chain with 20 000 recorded parameter steps, a sampling inter-val of 4000 and a burn-in of 209 106(25%). Coales-cent simulations used a slice sampling strategy and eight statically heated MCMCMC chains that were run
simultaneously in each run at the default temperatures to effectively explore the parameter space. Uniform prior distributions for the parameters Θ and M were assumed. Finally, optimized simulations for each migra-tion model were run independently three times, with a different random starting seed to gauge the consistency of results.
Scaled log Bayes factors (LBF) were calculated as the difference between log marginal likelihoods (lmL) gen-erated from each competing model. A LBF of>|2| was the threshold for favouring one model over another (Kass & Raftery, 1995), where the model with the greatest lmL score was preferred. The lmL score used for calculating LBF was the Bezier-curve approxima-tion, which is an improvement over the raw thermody-namic score when the number of heated chains is reduced to conserve computational resources (Beerli & Palczewski, 2010). The probability of each model, rela-tive to all other models tested, was also calculated by dividing the Bayes factor (not LBF) by the sum of all Bayes factor scores from all models, after the manner of Kass & Raftery (1995).
Molecular ageing and historical demography
The molecular age and historical demography of N. hexacanthus and N. caesius were initially explored using distributions of pairwise substitutions (mismatch distributions), which were constructed in ARLEQUIN for
both mtDNA markers. The crest of the mismatch distri-bution, designated by the symbol τ, represents the age of population expansion in generational units and moves from left to right a rate of 2ut generations, where u and t are, respectively, the substitution rate per generation for the entire sequence and time (Rogers & Harpending, 1992). Expansion age is calculated as t= τ/2u. However, no calibrated molecular clock exists for the family Acanthuridae and any substitution rate used would be largely conjectural. Yet, for the sake of heuristics, we cautiously use a range of mtDNA substi-tution rates taken from case studies of marine fish across the Isthmus of Panama, compiled by Lessios (2008), to approximate maximum and minimum expansion ages. For COI, substitution rates ranged between 0.06% per Myr in the balistid, Melichthys niger, and 3.3% per Myr in two geminate chaetodontids. Given a mean generation time in N. hexacanthus and N. caesius of 21.5 years, following studies of related Naso species (Klanten et al., 2007; Horne et al., 2008), the substitution rate per site, per generation in COI is l = 1.3 9 10 8
to 7.19 10 7. For mtCR, substitution rates ranged from 3.1% per Myr in geminate Serranids of the genus Rypticus to 7.2% per Myr in geminate Pomacanthids of the genus Holocanthus (l = 6.7 9 10 7 to 1.59 10 6).
Naso hexacanthus and N. caesius are indistinguishable in the mtDNA (see Results). Therefore, ipso facto, values
ofτ are essentially the same regardless of whether mis-match distributions are constructed for both species independently or combined. Here, mismatch distribu-tions presented are from the combined data set.
The age of the COI marker was further explored using Bayesian coalescent genealogy simulations in the pro-gramBEASTv. 1.6.1 (Drummond & Rambaut, 2007). We
used a mixed data set of 98 N. hexacanthus and N. caesius, under the assumption of incomplete lineage sorting between species, as well as a data set containing only N. hexacanthus individuals. Coalescence age was esti-mated using a strict molecular clock and a substitution rate of 1.2% (0.6% per lineage) based on the average divergence in this marker in transisthmian teleosts (Ber-mingham et al., 1997). However, to account for uncer-tainty in the molecular clock, we implemented a lognormal rate prior with lower and upper bounds of 0.2% and 2.7% per lineage. Simulations were run under an expansion growth coalescent tree prior and an HKY+I substitution model, as suggested by JMODELTEST, with
three independent codon partitions. Analyses were run for 40 9 106generations and genealogies were sampled every 4000 generations. Final parameters were run inde-pendently three times with random starting seeds.
Demographic history was also reconstructed using an extended Bayesian Skyline plot, also performed in
BEAST, to investigate the change of effective population
size through time. Unlike traditional skyline analysis, extended Bayesian Skyline plots (Heled & Drummond, 2008) accommodate information from multiple loci. Linear extended skyline plots were generated from two unlinked data partitions, COI haplotypes and EnolN alleles, under a strict molecular clock. The HKY+I sub-stitution model was used for both COI and EnolN. The substitution rate was fixed at 0.6% for COI and the rate for EnolN was estimated relative to COI. Final parame-ters for this analysis were run as described above for COI. All BEAST outputs were viewed using the program
TRACER v. 1.5 (Rambaut & Drummond, 2007) with a burn-in of 25%.
Results mtDNA diversity
For the mtCR 244 bp were resolved from 98 N. hex-acanthus and 26 N. caesius individuals. There were 136 polymorphic sites with 119 parsimony informative polymorphisms and 23 singletons. Alignment of this marker was somewhat problematic due to high levels of nucleotide polymorphism and many small indels. To improve the alignment, a small segment of each sequence, between 9 and 12 base pairs, containing many small indels, was deleted. However, identical haplotypes were not shown as identical in the haplo-type network unless the raw sequences (with the segment included) were the same (Fig. 3). After the
segment was removed, haplotype and nucleotide diversities for N. hexacanthus and N. caesius were, respectively, h= 1.0; p = 0.110 and h = 0.99; p = 0.104. Diversity indices were high for all sampled locations (Table 2). There was a total of 121 different mtCR hapl-otypes for the combined N. hexacanthus and N. caesius data set and haplotypes from each species did not segregate monophyletically (Fig. 3).
For the COI locus, 521 bp were resolved from 89 N. hexacanthus and 27 N. caesius individuals. There were 28 polymorphic sites with 15 parsimony informa-tive polymorphisms and 13 singletons. Haplotype and nucleotide diversities for N. hexacanthus and N. caesius
were, respectively, h= 0.92; p = 0.005 and h = 0.91; p = 0.005. Diversity indices across all locations were similar (Table 2). In total, there were 32 COI haplo-types between the two species and, just as with mtCR, COI haplotypes among species did not segregate mono-phyletically (Fig. 4).
Nuclear DNA diversity
For the EnolN marker, 231 bp were resolved for 103 N. hexacanthus and 27 N. caesius individuals. There were five polymorphic sites and seven alleles detected. Thirty-six individuals were heterozygous and eight
Table 2 Genetic diversity indices for Naso hexacanthus, Naso caesius and combined data sets for the mitochondrial control region (mtCR), cytochrome oxidase subunit 1 (COI) and nuclear EnolN for all sampling locations and oceans. Number of samples (N), number of mitochondrial haplotypes (Nh), or alleles (NA), haplotype diversity (h), mtDNA nucleotide diversity (p), observed and expected
heterozygosities (HO; HE) and population specific FISindices. P values< 0.05 are indicated by *. Some sampling location names are
abbreviated as follows: Christmas Is. (Xmas), Western Australia (WA), Great Barrier Reef (GBR), Papua New Guinea (PNG).
mtCR COI EnolN N Nh h p N Nh h p N NA HO HE FIS Seychelles N. hex 24 24 1.00 0.119 9 7 0.92 0.005 26 4 0.231 0.281 0.15 Red Sea N. hex 6 6 1.00 0.112 5 5 1.00 0.004 5 3 0.600 0.511 0.23 Xmas N. hex 9 9 1.00 0.107 10 6 0.87 0.004 9 2 0.111 0.111 0.00 N. caesius 13 11 0.97 0.116 13 7 0.89 0.005 13 2 0.154 0.148 0.04 All 22 20 0.99 0.115 23 9 0.86 0.005 22 3 0.136 0.132 0.04 WA N. hex 2 2 1.00 0.048 2 2 1.00 0.002 5 3 0.200 0.511 0.80 N. caesius 3 3 1.00 0.112 4 3 0.83 0.004 5 4 0.400 0.378 0.09 All 5 5 1.00 0.095 6 4 0.87 0.003 10 5 0.300 0.442 0.46 GBR N. hex 13 13 1.00 0.119 19 12 0.94 0.007 16 3 0.188 0.179 0.02 N. caesius 3 3 1.00 0.130 3 3 1.00 0.005 2 1 0.000 0.000 – All 17 17 1.00 0.118 22 13 0.94 0.006 18 3 0.166 0.160 0.02 PNG N. hex 6 6 1.00 0.106 7 5 0.90 0.006 7 1 0.000 0.000 0.000 Philippines N. hex 20 20 1.00 0.111 23 13 0.91 0.004 19 5 0.473 0.507 0.04 Tonga N. hex 11 11 1.00 0.117 10 6 0.89 0.005 9 3 0.222 0.216 0.00 N. caesius 7 7 1.00 0.108 7 7 1.00 0.006 7 4 0.571 0.495 0.20 All 18 18 1.00 0.110 17 10 0.94 0.005 16 5 0.375 0.339 0.09 Marquesas N. hex 4 4 1.00 0.108 – – – – 5 2 0.200 0.200 0.00 Pacific N. hex 57 57 1.00 0.111 63 23 0.92 0.005 52 5 0.273 0.292 0.04 N. caesius 10 10 1.00 0.108 10 9 0.98 0.006 9 4 0.444 0.399 0.14 All 67 67 1.00 0.109 73 26 0.93 0.005 67 7 0.284 0.294 0.02 Indian N. hex 41 41 1.00 0.116 26 15 0.91 0.005 45 5 0.244 0.300 0.25* N. caesius 16 13 0.98 0.107 17 7 0.85 0.005 18 4 0.222 0.211 0.06 All 57 54 0.99 0.112 43 15 0.88 0.005 63 6 0.238 0.275 0.18 Hexacanthus 98 98 1.00 0.110 89 29 0.92 0.005 103 6 0.252 0.287 0.15* Caesius 26 23 0.99 0.104 27 13 0.91 0.005 27 4 0.296 0.271 0.11 Total 124 121 0.99 0.105 116 32 0.91 0.005 130 7 0.067 0.075 0.09
A. Location
Seychelles Christmas Island Western Australia Great Barrier Reef Papua New Guinea Philippines Tonga Marquesas Taiwan Red Sea Naso hexacnthus Naso caesius B. Species (a) (b) single haplotype median vector < 6 substitutions < 11 substitutions < 16 substitutions
Fig. 3 Median joining networks of 121 Naso hexacanthus and Naso caesius haplotypes from 244 base pairs of the mitochondrial control region. (a) Haplotypes labeled geographically, 10 Indo-Pacific locations. (b) Haplotypes labeled by species, 98 Naso hexacanthus and 26 N. caesius individuals.
A. Location
Seychelles Christmas Island Western Australia Great Barrier Reef Papua New Guinea Philippines Tonga Taiwan Red Sea Naso hexacnthus Naso caesius B. Species (a) (b) single haplotype median vector
Fig. 4 Median joining networks of 32 Naso hexacanthus and Naso caesius haplotypes from 521 base pairs of the mitochondrial COI region. (a) Haplotypes labeled geographically, nine Indo-Pacific locations. (b) Haplotypes labeled by species, 89 Naso hexacanthus and 27 N. caesius individuals.
were heterozygous at more than one polymorphic site. Phasing of heterozygous individuals was consistent across runs and across methods used. Observed and expected heterozygosities for N. hexacanthus and N. cae-sius at this locus were H0= 0.252, HE= 0.287 and H0= 0.296, HE= 0.271 respectively. Geographically, EnolN alleles were widespread, with all alleles except one, being found in both oceans (Table 2). As with the two mtDNA markers, alleles did not segregate mono-phyletically between species (Fig. 5). Fu and Li’s tests did not detect background selection in the EnolN mar-ker, D* = 0.96, P > 0.10; F* = 0.35, P > 0.10.
The Creatine Kinase intron was amplified for 83 N. hexacanthus and 27 N. caesius individuals. Digesting the Creatine Kinase intron with two restriction endonuc-leases yielded three common alleles and one uncommon allele with the following frequencies: A 0.550, B 0.164, C 0.232, D 0.055. Unlike the other markers used in this study, there was a conspicuous segregation of alleles between species. Alleles A and B were predominantly found in N. hexacanthus, while Alleles C and D were predominantly found in N. caesius. Nevertheless, these allelic differences were not fixed among species. One N. caesius individual from the Great Barrier Reef (GBR) was an AB heterozygote and five N. hexacanthus, from several locations, were C homozygotes. An additional sixth N. hexacanthus from the Red Sea (a location far removed from the geographical range of N. caesius: Fig. 1) was a BC heterozygote. Allele D was exclusively found in N. caesius, however, it occurred at such a low frequency that it might be unwise to assume a fixed difference, given a modest sample size.
Population structure
Geographically, populations of N. hexacanthus were lar-gely unstructured in every molecular marker used in this study (Tables 3 and 4). With only two exceptions, all AMOVA fixation indices were not significant for any
spatial comparison. (i) Overall,AMOVAfor the mtCR, for
N. hexacanthus, was weak but significant ΦST= 0.0197, P= 0.02. However, for the same reasons that the mtCR was excluded from MIGRATE-n and BEAST analyses, fixation indices from this marker must be interpreted with care. (ii) Two pairwise FSTvalues in the COI marker: Philippines-Seychelles and Philippines-GBR. AMOVA
fixation indices for Indian and Pacific populations of N. caesius were not significant for any of the three sequence markers investigated: mtCR ΦST= 0.004, P= 0.5; COI ΦST= 0.04, P = 0.8; EnolN ΦST= 0.008, P= 0.7. However, for Creatine Kinase structure was significant ΦST = 0.09, P = 0.02. The reason for this appears to be mainly differences in the rare allele D between the two oceans.
Genetic differentiation between N. hexacanthus and N. caesius varied for each marker. In the mtCR and COI markers, genetic structure between species was not significant (Table 4). Judging from the mtDNA alone, there would seem to be little to suggest reproductive isolation between the two species. In contrast, AMOVA
comparisons in the nDNA markers showed significant structuring. In the EnolN marker, structure was moder-ate, ΦST= 0.044, P = 0.01. Population structure between species in Creatine Kinase was stronger by an order of magnitude,ΦST= 0.547, P < 0.001.
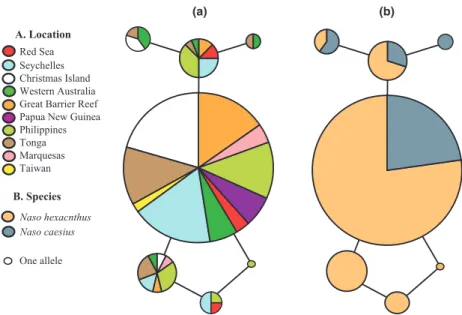
A. Location
Seychelles Christmas Island Western Australia Great Barrier Reef Papua New Guinea Philippines Tonga Marquesas Taiwan Red Sea Naso hexacnthus Naso caesius B. Species One allele (a) (b)
Fig. 5 Median joining networks of seven Naso hexacanthus and Naso caesius alleles from 231 base pairs of the nuclear EnolN marker. (a) Haplotypes labeled geographically, 10 Indo-Pacific locations. (b) Haplotypes labeled by species, 103 Naso hexacanthus and 27 N. caesius individuals.
Model-based phylogeography
Marginal likelihoods from the five different migration models are reported in Table 5, along with corresponding Bayes factor scores and relative model probabilities. Coalescent simulations favoured the simplest model, broad-scale panmixia, over more complex two-population models. The second best model was the two-population model with bi-directional gene flow between West
Indian and Indo-west Pacific populations, which was only marginally better than the other bi-directional gene flow model where each ocean basin comprised a popula-tion. Asymmetrical migration models performed poorly in comparison. The demographic parameter Θ, for the panmixia model had a mean estimate of 0.0009. Migra-tion (M), estimated from the various migraMigra-tion models, was high. However, considering that the hypothetical populations are not supported, migration estimations are probably irrelevant. For the complete table of estimated demographic parameters see Appendix S1.
Molecular aging and historical demography
Mismatch distributions from both mtCR and COI were unimodal and Fu’s FSvalues were significantly negative for both markers, indicative of population expansion (Fig. 6). Expansion age, calculated from the COI mis-match distribution, indicates that the joint expansion of both species, is unlikely to be older than 2.2 Myr. The mtCR maximum expansion age was more conservative at 1.2 Myr. Both mtDNA markers agree that expansion age does not appear to be more recent than 0.5 Myr. Values of τ from the two mtDNA markers differed by greater than a factor of ten, indicating a proportionally faster substitution rate in the mtCR.
Coalescent simulations in BEAST yielded smooth,
uni-modal posterior distributions and effective sample sizes were ample (> 900). The tree model root height for the analyses had a mean of 0.977 Myr and the 95% poster-ior density limits for the parameter were 0.013–2.2 Myr. The mean clock-rate was 0.67% per lineage per Myr, which equates to 1.34% divergence per Myr, or l = 2.88 9 10 7
, given a generation time of 21.5 years. The lower and upper 95% posterior density limits for the clock-rate parameter were 0.18 and 1.5% per line-age per Myr. These results should be interpreted cau-tiously, however, because the priors imposed on the rate parameter are based on unrelated taxa. Runs that included only N. hexacanthus samples differed little from the mixed species data set.
The extended Bayesian skyline plot indicated positive growth throughout the combined species history of N. hexacanthus and N. caesius (Fig. 7). The approximated substitution rate for the EnolN marker was 0.096% per
Table 3 Pairwise population comparisons for Naso hexacanthus from five sampling locations: Seychelles, Christmas Island (Xmas), Great Barrier Reef (GBR), Philippines and Tonga (see Fig. 1). Pairwise population structure is reported for four markers: mitochondrial control region (mtCR), Cytochrome oxidase subunit 1 (COI), the nDNA marker (EnolN) and restriction site
polymorphism from the creatine kinase intron (CK). FSTvalues are
on the lower diagonal, while P-values are on the upper diagonal. Values highlighted in bold are significant. The critical P-value for the false discovery rate is 0.0171.
Seychelles Christmas GBR Philippines Tonga
Seychelles mtCR 0.04 0.40 0.09 0.85 COI 0.16 0.48 0.013 0.67 EnolN 0.31 0.65 0.43 0.69 CK 0.03 0.99 0.99 0.21 Xmas mtCR 0.032 0.09 0.21 0.33 COI 0.048 0.25 0.90 0.64 EnolN 0.013 0.77 0.10 0.99 CK 0.130 0.19 0.14 0.011 GBR mtCR 0.001 0.031 0.04 0.61 COI 0.008 0.019 0.014 0.96 EnolN 0.011 0.015 0.13 0.99 CK 0.028 0.065 0.10 0.21 Philippines mtCR 0.014 0.012 0.029 0.53 COI 0.126 0.040 0.083 0.14 EnolN 0.002 0.044 0.026 0.30 CK 0.026 0.061 0.034 0.11 Tonga mtCR 0.013 0.006 0.007 0.004 COI 0.034 0.032 0.054 0.034 EnolN 0.021 0.038 0.042 0.004 CK 0.027 0.257 0.045 0.056
Table 4 AMOVAfixation indices (ΦST) and accompanying P-values for three population comparisons of Naso hexacanthus: Overall, Indian
Ocean vs. Pacific Ocean, West Indian vs. Indo-West Pacific from four markers: mitochondrial control region (mtCR), Cytochrome oxidase subunit 1 (COI), the nDNA marker (EnolN) and restriction site polymorphism (FST) from the Creatine Kinase intron. Also, N. hexacanthus
vs. Naso caesiusAMOVA.
Comparison mtCR COI EnolN Creatine kinase
OverallAMOVA ΦST= 0.0197, P = 0.02 ΦST= 0.028, P = 0.10 ΦST= 0.004, P = 0.08 FST= 0.05, P = 0.05 Indian Ocean vs. Pacific Ocean ΦST= 0.044, P = 0.79 ΦST= 0.013, P = 0.81 ΦST= 0.008, P = 1.0 FST= 0.014, P = 0.133 West Indian vs. Indo-West Pacific ΦST= 0.0018, P = 0.56 ΦST= 0.014, P = 0.69 ΦST= 0.009, P = 0.15 FST= 0.012, P = 0.796 N. hexacanthus vs. N. caesius ΦST= 0.0058, P = 0.15 ΦST= 0.013, P = 0.89 ΦST= 0.044, P = 0.01 FST= 0.547, P < 0.001
0 100 200 300 400 500
Observed Expansion model freq.
55 50 45 40 35 30 25 20 15 10 5 0 frequency
number of pairwise differences 0-58 mitochondrial control region n = 124 Fu’s Fs = –23.938, P = 0.002 τ = 36.5 θ0= 0.044 θ1= 314.158 μ = 6.7 × 10e-7–1.5 × 10e-6 Mean expansion time = 0.5–1.2 MY
0 500 1000 1500 2000
Observed Expansion model freq.
8 7 6 5 4 3 2 1 0 frequency
number of pairwise differences 0-8 cytochrome oxidase subunit I n = 116 Fu’s Fs = –26.724, P = 0.001 τ = 2.8 θ0= 0.000 θ1= 373.75 μ = 1.3 × 10e-8–7.1 × 10e-7 Mean expansion time = 0.4–2.2 MY
Fig. 6 Mismatch distributions for two mtDNA markers: mitochondrial control region (left) and Cytochrome Oxidase subunit 1 (right), from a combined data set of N. hexacanthus and N. caesius individuals. Number of individuals in the analysis (n), Fu’s FStest of selective
neutrality and population expansion, evolutionary expansion age in mutational units (τ), effective population size before (h0) and after (h1) population expansion. Substitution rate per site per generation (l) and mean expansion time in units of Myr. Note that the range in expansion age corresponds to the range of substitution rate.
Table 5 Log marginal likelihoods (lmL) and log Bayes factor comparisons (LBF) for five different migration models in Naso hexacanthus: (1) Broad-scale Panmixia, (2) Indian and Pacific populations with bidirectional gene flow, (3) West Indian and Indo-West Pacific populations with bidirectional gene flow, (4) Indian and Pacific populations with unidirectional westward gene flow and (5) Indian and Pacific populations with unidirectional eastward gene flow. The log marginal likelihoods given are the Bezier approximation score (BA lmL). LBF are the difference in log marginal likelihoods between the best model and all other models. The probability of each model being the correct model relative to all other models is also given.
Migration model BA lmL LBF Model rank Model probability 1. Panmixia 1448.79 0.00 1 0.958 2. Indian+ Pacific populations bidirectional gene flow 1453.16 4.37 3 0.012 3. West Indian+ Indo-West Pacific populations bidirectional gene flow 1452.28 3.49 2 0.030 4. Two populations strict west gene flow
1457.53 8.74 4 < 0.001
5. Two populations strict east gene flow
1461.17 12.38 5 < 0.001
Time (millions of years)
Population size (log
N et ) –2.0 –1.5 –1.0 –0.5 0.0 0.5 1.0 1.5 2.0
lower 95hpd Median upper 95hpd
1.0 0.3 0.2 0.15 0.12 0.1 0.07 0.05 0.02 0
Fig. 7 Linear, non-parametric, multi-locus extended Bayesian skyline plot constructed from mitochondrial COI and nuclear EnolN from a mixed data set of 72 Naso hexacanthus and 26 Naso caesius individuals. The thick black line represents the median population size estimate through time. The thin black and grey lines are the upper and lower 95% high posterior density limits, respectively. The X-axis is time, in Myr. The Y-axis is the log effective population size multiplied by generation time, in the same units as the X-axis.
lineage per million years. The analysis detected at least one major demographic population size change, which, upon visual inspection of the plot, appears to have occurred between 100 000 and 150 000BP. However,
only two molecular markers do not afford much resolu-tion in this regard (Heled & Drummond, 2008).
Discussion
Phylogeography ofNaso hexacanthus
Under most circumstances, differences in the spatial dis-tribution of genetic polymorphisms can be used to delineate populations of organisms with independent evolutionary trajectories. When spatial genetic structure is strong and unambiguous it indicates that gene flow between populations is limited, presently and in the immediate evolutionary past (Avise, 2000). Even for-merly isolated populations that have recently come into secondary contact resist admixture through a process called genetic embolism (Bialozyt et al., 2006; Excoffier et al., 2009; Fayard et al., 2009), which is not overcome for a long time unless gene flow is high. Therefore, a pattern of spatial genetic structure generally precludes high gene flow between populations.
In contrast to positive spatial genetic structuring, a lack of spatial population genetic structure is much more difficult to interpret. Genetic homogeneity could indicate high gene flow, or that sufficient time has not passed for genetic drift to differentiate independent populations. The situation is further complicated when effective population sizes are large and genetic diversity is high, as is the case with many marine taxa (Palumbi, 2003; Hedgecock et al., 2007; Hellberg, 2007, 2009). Both large effective population size and high genetic diversity make it difficult to sample enough of the natural genetic variation to detect population structure if it exists.
Because population genetic data sets that lack spa-tially defined structures are considered equivocal, studies of widespread marine organisms that do not show clear-cut population genetic boundaries are often treated as inconclusive (Carpenter et al., 2011; Marko & Hart, 2011) and perhaps rightfully so. Nevertheless, the results of this study argue that long-term panmixia in cosmopolitan marine fish is a possibility that should be taken seriously. Like other members of the genus, N. hexacanthus lacked population structure at all spatial scales (Klanten et al., 2007; Horne et al., 2008) in all markers surveyed with only a few exceptions (Tables 3 and 4), which, either do not seem sensible in the con-text of all other comparisons or could be due to small sample sizes. It has been the experience of the authors that increasing the sample size of molecular data sets in other Naso species, reduces the amount of structure detected (J. B. Horne, unpublished data). Also, mea-sures of absolute diversity (h andp), which take longer
to reach equilibrium than fixation indices (Pannell & Charlesworth, 2000), were homogenous across the spe-cies range (Table 2). Moreover, attempts to reject a model of panmixia across the Indo-Pacific in this taxon failed. Model-based phylogeography explicitly accounts for stochasticity in the coalescent genealogy and does not suffer from artifactual results, caused by large effec-tive population size, high genetic variation and is robust at sample sizes well within the collection efforts of this study.
The greatest shortcoming of model-based phylogeog-raphy is that selected models may incorrectly represent the population dynamics of the target organism (Know-les, 2009; Nielsen & Beaumont, 2009; Beaumont et al., 2010; Hickerson et al., 2010). For this reason, the sim-plest possible migration models were used in this study, which undoubtedly over-simplify the complexity of gene flow in a widespread coral reef fish but which otherwise leave little room for misinterpretation. Although overly simplistic, such models are useful, especially when combined with other, more direct, metrics of population differentiation (Garrick et al., 2010). Importantly, while the results of this study indicate that the Indo-Pacific wide N. hexacanthus are a single long-term panmictic population, with no differ-entiation across the Indo-Pacific Barrier, it suggests little about demographically significant levels of migration, which are of more interest to conservation and fisheries biologists (see Waples & Gaggiotti, 2006; Lowe & Allen-dorf, 2010). Conceivably, faster evolving markers, such as a suite of microsatellite loci, might reveal subtle spa-tial structuring with relevance to demographic connec-tivity in N. hexacanthus (see van der Meer et al., 2012). Two pertinent studies for comparison are the broad-scale phylogeography of the ember parrotfish, Scarus rubroviolaceus (Fitzpatrick et al., 2011) and the deepwa-ter snapper Pristipomoides filamentosus (Gaither et al., 2011b). Both studies used 11–15 microsatellite loci. No structure was found in the deepwater snapper and only slight population structure was found between the Indian and Pacific Oceans in the ember parrotfish. Both studies, however, found significant differentiation between Indo-West Pacific populations and Hawaii, which was not sampled in N. hexacanthus. Therefore, a Hawaiian sample of N. hexacanthus might be genetically differentiated from the Indo-Pacific population.
Genetic overlap betweenNaso hexacanthus and Naso caesius
As with previous studies looking to investigate a genetic basis for colour variation in closely related coral reef fishes, this study did not find a strong asso-ciation between colour phenotypes and molecular divergence (McMillan et al., 1999; McCartney et al., 2003; Ramon et al., 2003; Bowen et al., 2006; Shultz et al., 2007; but see Messemer et al., 2005; Puebla
et al., 2007; Drew et al., 2010). Possibly, colour in coral reef fishes evolves faster than polymorphism in selec-tively neutral molecular markers, but if so it also evolves faster than post-zygotic reproductive barriers, as viable hybrids are found in many colourful reef fish taxa in the wild (Pyle & Randall, 1994; McMillan et al., 1999; Randall, 2002; Marie et al., 2007; Hobbs et al., 2009, 2010). Hybrid morphs are not known from N. hexacanthus and N. caesius, but the two species are morphologically so similar that hybrids may not be readily identifiable from a superficial visual inspection. In spite of distinct male nuptial colouration that seemingly facilitates assortative mating (Fig. 2), hybridization may be a consequence of accidental cross-fertilization because these two pelagic-spawning fishes are known to form heterospecific spawning aggregations (Randall & Bell, 1992).
Contemporary hybridization between N. hexacanthus and N. caesius is plausible but if it occurs it is either not common or produces unfit hybrids because of genetic divergence in the nDNA. Genetic differentiation between species was particularly obvious in the creatine kinase intron, although restriction site differences were not fixed differences, as was reported for allozymes (Dayton et al., 1994; Dayton, 2001). Species level diver-gence in this intron is suggestive of incomplete lineage sorting, in which case some penalty on hybrid fitness would be inferred. Whether there is an external selec-tion pressure acting on creatine kinase is unknown and perhaps unexpected, given the simple metabolic func-tion of this enzyme; however, it may be closely linked to a gene that is directly under disruptive selection. Alternatively, selection could be due to the genetic environment rather than the external environment. It is possible that creatine kinase alleles from one species are mildly deleterious among the genetic background of the other due to heterozygote disadvantage and epi-static effects. Therefore, hybrids at this locus may suffer long-term fitness penalties, becoming rare, while mitochondrial haplotypes may have no genetic incompatibilities and linger in both species lineages (see Palumbi et al., 2011).
Greater genetic distinction in the nDNA than in the mtDNA could also be evidence that N. hexacanthus and N. caesius diverged originally in allopatry, and later became admixed, because the maternally inherited mtDNA is expected to introgress faster than nDNA by nature of its lower migration (Nm) rate, especially in cases of sex-biased dispersal, or asymmetrical gene flow between species (Excoffier et al., 2009). If so, prezygotic reproductive barriers, such as male nuptial colouration (Fig. 2), may have evolved after secondary contact, as a form of enhanced isolation, to prevent the production of unfit hybrids. Nevertheless, nuptial colouration could also have evolved before secondary contact. Another argument for allopatric origins of N. hexacanthus and N. caesius is that there appears to be little, if any,
ecological distinction between the species, which is usually characteristic of sympatric speciation (Bolnick & Fitzpatrick, 2007). Regardless, nuptial colouration appears to have a strong genetic basis because N. hex-acanthus displays the same nuptial colouration in the Red Sea (Fig. 2b), where it does not co-occur with N. caesius (i.e. there is no competitive release of the reproductive character). In fine, a scenario of allopatric divergence, followed by secondary introgression, appears to be more consistent with the data than diver-gence in sympatry (see also Quenouille et al., 2011). If so, this contact has not resulted in the collapse of species.
Allopatric divergence and secondary introgression in N. hexacanthus and N. caesius may be congruous with the deep mitochondrial lineages found in other wide-spread reef fishes, including other Naso species (Klanten et al., 2007; Horne et al., 2008; Reece et al., 2010; Vis-ram et al., 2010). These deep mitochondrial lineages, or “nongeographical clades”, lack spatial genetic structure and are sometimes explained in terms of episodic isola-tion and secondary introgression. If hybrid offspring were viable and no barriers to reproduction arose, incipient reef fish species that evolved in allopatry could have experienced reverse speciation upon sec-ondary contact (Mallet, 2007; Seehausen et al., 2008). Therefore, hypothetically, some dispersive cosmopolitan coral reef fish species could actually be widespread hybrid swarms.
Divergence in N. hexacanthus and N. caesius is most likely of Pleistocene origin, within the last million years before present but probably much more recent because our coalescence ages represent deep gene coalescences rather than the actual species divergence time. Vicari-ance in tropical Indo-Pacific marine organisms is some-times attributed to Pleistocene sea level fluctuations and the emergence of a land barrier in the Indo-Austra-lian Archipelago, along the Sunda Shelf (Randall, 1998; Benzie, 1999; Rocha et al., 2007). Inasmuch as N. cae-sius is largely a Pacific Plate species, absent from the Indo-Austalian Archipelago, western Indian Ocean and only known from a few locations in the eastern Indian Ocean, it might be posited that it has always been a Pacific Ocean species. Naso hexacanthus may, respec-tively, have been an Indian Ocean species that colo-nized the Pacific Ocean against the present-day currents, as another Indo-Pacific fish, Cephalopholis argus, appears to have done (Gaither et al., 2011a). There is no direct evidence to support any particular geographical scenario of isolation but at some point in time N. hexacanthus appears to have expanded its distribution to completely overlap the range of its sister species.
To disentangle the complex evolutionary history of N. hexacanthus and N. caesius more data, and more complex models of divergence and admixture will be required. Additional nuclear sequence markers would
greatly improve inferences of demographic population history, in the form of Bayesian skyline analyses, and more genome-wide markers, such as hypervariable mi-crosatellite loci, will be necessary to further explore the possibility of contemporary hybridization and patterns of admixture between the species.
Conclusion
The results of this study argue that the geographical scale of population connectivity in marine organisms is a spectrum that includes long-term panmixia across the tropical Indo-Pacific. However, the complex evolution-ary relationship between N. hexacanthus and its broadly sympatric sister, N. caesius, suggests that even popula-tions of highly dispersive marine taxa have been histor-ically isolated by some geographical scenario, long enough for allopatric divergence to occur. However, genetic divergence was only observed in the nuDNA; the mtDNA failed to distinguish species. This result argues against the utility of mitochondrial markers such as COI as barcoding genes. As these species appear to have diverged in the mid-late Pleistocene, it may be surmised that the climate oscillations and sea level dis-turbances of this time played a role in the reproductive isolation of these fishes, as has been suggested for marine fish and invertebrate sister species that have presently allopatric distributions and which may not be as dispersive. To maintain the boundary between such ecologically similar species, genetic incompatibilities and the evolution of enhanced isolation (assortative mating) appear to be present in N. hexacanthus and N. caesius.
Acknowledgments
Funding for this research was made possible in part by a graduate research grant from James Cook University awarded to JBH. The following people are acknowl-edged for their contribution of genetics samples of N. hexacanthus and N. caesius: J.H. Choat, J.P. Hobbs, D.R. Robertson, W.D. Robbins, J. Ackerman, M. Berumen, R. Abesamis and L. Chen. We acknowledge support from Blanche Danastas and the James Cook University molecular ecology and evolution lab. Special thanks to John E. Randall for photographs of Naso hexacanthus and Naso caesius. The authors further acknowledge funding and logistic support from the National Geo-graphical Society, the Queensland Government/Smith-sonian Institution Collaborative Research Program on Reef Fishes, the Seychelles Fishing Authority, Cocos Keeling and Christmas Island National Parks Depart-ment of EnvironDepart-ment and Heritage Australia, the Australian Institute of Marine Science, the Lizard Island Research Station, Silliman University Philippines, the King Abdullah University of Science and Technology, Saudi Arabia, the National Museum of Taiwan and the
James Cook University internal funding scheme. The work was carried out under James Cook University Ethics Approval No. A503.
References
Allen, G.R. 2008. Conservation hotspots of biodiversity and endemism for Indo-Pacific coral reef fishes. Aquat. Conserv. 18: 541–556.
Avise, J.C. 2000. Phylogeography: The History and Formation of Species. Harvard University Press, Cambridge, MA.
Bay, L.K., Choat, J.H., van Herwerden, L. & Robertson, D.R. 2004. High genetic diversities and complex genetic structure in an Indo-Pacific tropical reef fish (Chlorurus sordidus): evidence of an unstable evolutionary past? Mar. Biol. 144: 757–767. Beaumont, M.A., Nielsen, R., Christian, R., Hey, J., Gaggiotti,
O., Knowles, L. et al. 2010. In defense of model-based infer-ence in phylogeography. Mol. Ecol. 19: 436–446.
Beerli, P. 2006. Comparison of Bayesian and maximum likeli-hood inference of population genetic parameters. Bioinfor-matics 22: 341–345.
Beerli, P. & Palczewski, M. 2010. Unified framework to evalu-ate panmixia and migration direction among multiple sam-pling locations. Genetics 185: 313–326.
Bellwood, D.R. & Wainwright, P.C. 2002 The history and biogeography of fishes on coral reefs. In: Coral Reef Fishes: Dynamics and Diversity in a Complex Ecosystem (P.F. Sale, ed.), pp. 5–32. Academic Press, San Diego, CA.
Benjamini, B.Y. & Yekutieli, D. 2001. The control of the false discovery rate in multiple testing under dependency. Ann. Stat. 29: 1165–1188.
Benzie, J.A.H. 1999. Genetic structure of coral reef organisms: ghosts of dispersal past. Am. Zool. 39: 131–145.
Bermingham, E., McCafferty, S.S. & Martin, A.P. 1997 Fish biogeography and molecular clocks: perspectives from the Panamanian Isthmus. In: Molecular Systematics of Fishes (T.D.
Kocher, C.A. Stepien, eds), pp. 113–118. Academic Press,
San Diego, CA.
Bialozyt, R., Ziegenhagen, B. & Petit, R.J. 2006. Contrasting effects of long-distance seed dispersal on genetic diversity during range expansion. J. Evol. Biol. 19: 12–20.
Blum, S.D. 1989. Biogeography of the Chaetodontidae: an analysis of allopatry among closely related species. Environ. Biol. Fishes 25: 9–31.
Bolnick, D.I. & Fitzpatrick, B.M. 2007. Sympatric speciation: models and empiricle evidence. Annu. Rev. Ecol. Evol. Syst. 38: 459–487.
Bowen, B.W., Bass, A.L., Rocha, L.A., Grant, W.S. & Robert-son, D.R. 2001. Phylogeography of the trumpetfishes (Aulo-stomus): ring species complex on a global scale. Evolution 55: 1029–1039.
Bowen, B.W., Muss, A., Rocha, L.A. & Grant, W.S. 2006. Shallow mtDNA coalescence in Atlantic pygmy angelWshes (genus Centropyge) indicates a recent invasion from the Indian Ocean. J. Hered. 97: 1–12.
Briggs, J.C. 2006. Proximate sources of marine biodiversity. J. Biogeogr. 33: 1–10.
Briggs, J.C. & Bowen, B.W. 2012. A realignment of marine biogeographic provinces with particular reference to fish distributions. J. Biogeogr. 39: 12–30.
Carpenter, K.E., Barber, P.H., Crandall, E.D., Ablan-Lagman, M.C.A., Ambariyanto, G., Mahardika, G.N. et al. 2011.
Compar-ative phylogeography of the coral triangle and implications for marine management. J. Mar. Biol. 2011: 1–14.
Chave, E.H. & Mundy, B.C. 1994. Deep sea benthic fish of the Hawaiian archipelago, Cross Seamount and Johnston Atoll. Pac. Sci. 48: 367–409.
Choat, J.H., Clements, K.D. & Robbins, W.D. 2002. The trophic status of herbivorous fishes on coral reefs. Mar. Biol. 140: 613–623.
Clement, M., Posada, D. & Crandall, K.A. 2000. TCS: a com-puter program to estimate gene genealogies. Mol. Ecol. 9: 1657–1660.
Coyne, J.A. & Orr, H.A. 2004. Speciation. Sinauer Associates Inc., Sunderland, MA.
Craig, M.T., Eble, J.A., Bowen, B.W. & Robertson, D.R. 2007. High genetic connectivity across the Indian and Pacific Oceans in the reef fish Myripristis berndti (Holocentridae). Mar. Ecol. Prog. Ser. 334: 245–254.
Crandall, E.D., Frey, M.A., Grosberg, R.K. & Barber, P.H. 2008. Contrasting demographic history and phylogeographical pat-terns in two Indo-Pacific gastropods. Mol. Ecol. 17: 611–626. Dawson, M.N., Barber, P.H., Gonzalez-Guzman, L.I., Toonen,
R.J., Dugan, J.E. & Grosberg, R.K. 2011. Phylogeography of Emerita analoga (Crustacea, Decapoda, Hippidae), an east-ern Pacific Ocean sand crab with long-lived pelagic larvae. J. Biogeogr. 38: 1600–1612.
Dayton, C.L. 2001. Genetic evolution among selected members of the genus Naso (Nasinae), “unicornfishes” from Guam. Mar. Biol. 139: 771–776.
Dayton, C., Santayana, A.C. & Lacson, J.M. 1994. Genetic evi-dence for reproductive isolation of the recently described unicornfish Naso caesius and its sibling N. hexacanthus. Mar. Biol. 118: 551–554.
Drew, J., Allen, G.R. & Erdmann, M.V. 2010. Congruence between mitochondrial genes and color morphs in a coral reef fish: population variability in the Indo-Pacific damselfish Chrysiptera rex (Snyder, 1909). Coral Reefs 29: 439–444. Drummond, A.J. & Rambaut, A. 2007. BEAST: Bayesian
evolutionary analysis by sampling trees. BMC Evol. Biol. 7: 214–221.
Eble, J.A., Rocha, L.A., Craig, M.T. & Bowen, B.W. 2011. Not all larvae stay close to home: insights into marine population connectivity with a focus on the brown surgeonfish, (Acanthurus nigrofuscus). J. Mar. Biol., 2011: 12.
Excoffier, L. & Lischer, H.E.L. 2010. Arlequin suite ver 3.5: a new series of programs to perform population genetics analy-ses under Linux and Windows. Mol. Ecol. Resour. 10: 564–567. Excoffier, L., Smouse, P.E. & Quattro, J.M. 1992. Analysis of
molecular variance inferred from metric distances among DNA haplotypes: application to human mitochondrial-DNA restriction data. Genetics 131: 479–491.
Excoffier, L., Foll, M. & Petit, R.J. 2009. Genetic consequences of range expansions. Annu. Rev. Ecol. Evol. Syst. 40: 481–501. Fayard, J., Klein, E.K. & Lefevre, F. 2009. Long distance
dispersal and the fate of a gene from the colonization front. J. Evol. Biol. 22: 2171–2182.
Fitzpatrick, J.M., Carlon, D.B., Lippe, C. & Robertson, D.R. 2011. The west Pacific diversity hotspot as a source or sink for new species? Population insights from the Indo-Pacific parrotfish Scarus rubroviolaceus. Mol. Ecol. 20: 219–234. Fu, Y.X. 1997. Statistical tests of neutrality of mutations
against population growth, hitchhiking and background selection. Genetics 147: 915–925.
Fu, Y.X. & Li, W.H. 1993. Statistical tests of neutrality of muta-tions. Genetics 133: 693–709.
Gaither, M.R., Toonen, R.J., Robertson, D.R., Planes, S. &
Bowen, B.W. 2010. Genetic evaluation of marine
biogeographical barriers: perspectives from two widespread Indo-Pacific snappers (Lutjanus kasmira and Lutjanus fulva). J. Biogeogr. 37: 133–147.
Gaither, M.R., Bowen, B.W., Bordenave, T., Rocha, L.A., New-man, S.J., Gomez, J.A. et al. 2011a. Phylogeography of the reef fish Cephalopholis argus (Epinephelidae) indicates Pleisto-cene isolation across the Indo-Pacific Barrier with contempo-rary overlap in the Coral Triangle. BMC Evol. Biol. 11: 189. Gaither, M.R., Jones, S.A., Kelley, C., Newman, S.J., Sorenson,
L. & Bowen, B.W. 2011b. High connectivity in the deepwa-ter snapper Pristipomoides filamentosus (Lutjanidae) across the Indo-Pacific with Isolation of the Hawaiian Archipelago. PLoS ONE 6: e28913.
Garrick, R.C., Caccone, A. & Sunnucks, P. 2010. Inference of population history by coupling exploratory and model-driven phylogeographic analyses. Int. J. Mol. Sci. 11: 1190– 1227.
Gerlach, G., Atema, J., Kingsford, M.J., Black, K.P. & Miller-Sims, V. 2007. Smelling home can prevent dispersal of reef fish larvae. Proc. Natl Acad. Sci. USA 104: 858–863.
Hedgecock, D., Barber, P.H. & Edmands, S. 2007. Genetic approaches to measuring marine connectivity. Oceanography 20: 70–79.
Heled, J. & Drummond, A.J. 2008. Bayesian inference of population size history from multiple loci. BMC Evol. Biol. 8: 289.
Hellberg, M.E. 2007. Footprints on the water: the genetic wake of dispersal among reefs. Coral Reefs 26: 463–473.
Hellberg, M.E. 2009. Gene flow and isolation among popula-tions of marine animals. Annu. Rev. Ecol. Evol. Syst. 40: 291– 310.
van Herwerden, L. & Doherty, P.J. 2006. Contrasting genetic structures across two hybrid zones of a tropical reef fish (Bleeker 1855). J. Evol. Biol. 19: 239–252.
Hickerson, M.J., Carstens, B.C., Cavender-Bares, J., Crandall, K.A., Graham, C.H., Johnson, J.B. et al. 2010. Phylogeogra-phy’s past, present and future: 10 years after Avise, 2000. Mol. Phylogenet. Evol. 54: 291–301.
Hobbs, J.P., Frisch, A.J., Allen, G.R. & van Herwerden, L. 2009. Marine hybrid hotspot at Indo-Pacific biogeographic border. Biol. Lett. 5: 258–261.
Hobbs, J.P., Ayling, A.M., Choat, J.H., Gilligan, J.J., McDonald, C.A., Nielson, J. et al. 2010. New records of marine fishes illustrate the biogeographic importance of Christmas Island, Indian Ocean. Zootaxa 2422: 63–68.
Horne, J.B., van Herwerden, L., Choat, J.H. & Robertson, D.R. 2008. High population connectivity across the Indo-Pacific: congruent lack of phylogeographic structure in three reef fish congeners. Mol. Phylogenet. Evol. 49: 629–638.
Kass, R.E. & Raftery, A.E. 1995. Bayes factors. J. Am. Stat. Assoc. 90: 773–795.
Kelly, R.P. & Palumbi, S.R. 2009. General-use polymerase chain reaction primers for amplification and direct sequenc-ing of enolase, a ssequenc-ingle-copy nuclear gene, from different animal phyla. Mol. Ecol. Resour. 9: 144–147.
Klanten, S.O., van Herwerden, L., Choat, J.H. & Blair, D. 2004. Patterns of lineage diversification in the genus Naso (Acanthuridae). Mol. Phylogenet. Evol. 32: 221–235.
Klanten, S.O., van Herwerden, L. & Choat, J.H. 2007. Extreme genetic diversity and temporal rather than spatial partition-ing in a widely distributed coral reef fish. Mar. Biol. 150: 659–670.
Knowles, L.L. 2009. Statistical phylogeography. Annu. Rev. Ecol. Evol. Syst. 40: 593–612.
Lecchini, D., Planes, S. & Galzin, R. 2005. Experimental assess-ment of sensory modalities of coral-reef fish larvae in the recognition of their settlement habitat. Behav. Ecol. Sociobiol. 58: 18–26.
Leis, J.M. 2006. Are larvae of demersal fishes plankton or nek-ton? Adv. Mar. Biol. 51: 59–141.
Leis, J.M., Hay, A., Lockell, M.M., Chen, J. & Fang, L. 2007a. Ontegeny of swimming speed in larvae of pelagic spawning, tropical, marine fishes. Mar. Ecol. Prog. Ser. 349: 255–267.
Leis, J.M., Wright, K.J. & Johnson, R.N. 2007b. Behavior that influences dispersal and connectivity in the small, young lar-vae of a coral reef fish. Mar. Biol. 153: 103–117.
Leis, J.M., Hay, A.C. & Howarth, G.J. 2009. Ontogeny of in situ behaviors relevant to dispersal and population connectivity in larvae of coral-reef fishes. Mar. Ecol. Prog. Ser. 379: 163–179. Leray, M., Beldade, R., Holbrook, S.J., Schmitt, R.J., Planes, S.
& Bernardi, G. 2010. Allopatric divergence and speciation in coral reef fish: the three spot Dascyllus, Dascyllus trimaculatus. Evolution 64: 1218–1230.
Lessios, H.A. 2008. The great American schism: divergence of marine organisms after the rise of the Central American Isthmus. Annu. Rev. Ecol. Evol. Syst. 39: 63–91.
Lessios, H.A. & Robertson, D.R. 2006. Crossing the impassible: genetic connections in 20 reef fishes across the eastern Pacific barrier. Proc. Biol. Sci. 273: 2201–2208.
Lessios, H.A., Kessing, B.D. & Pearse, J.S. 2001. Population structure and speciation in tropical seas: global phylogeogra-phy of the sea urchin Diadema. Evolution 55: 955–975. Lester, S.E. & Ruttenberg, B.I. 2005. The relationship between
pelagic larval duration and range size in tropical reef fishes: a synthetic analysis. Proc. Biol. Sci. 272: 585–591.
Lester, S.E., Ruttenberg, B.I., Gaines, S.D. & Kinlan, B.P. 2007. The relationship between dispersal ability and geographic range size. Ecol. Lett. 10: 745–758.
Librado, P. & Rozas, J. 2009. DnaSP v5: a software for compre-hensive analysis of DNA polymorphism data. Bioinformatics 25: 1451–1452.
Lowe, W.H. & Allendorf, F.W. 2010. What can genetics tell us about population connectivity? Mol. Ecol. 19: 3038–3051. Mallet, J. 2007. Hybrid speciation. Nature 446: 279–283. Marie, A.D., van Herwerden, L., Choat, J.H. & Hobbs, J.P.
2007. Hybridization of reef fishes at the Indo-Pacific biogeo-graphic barrier: a case study. Coral Reefs 26: 841–850. Marko, P.B. & Hart, M.W. 2011. Retrospective coalescent
methods and the reconstruction of metapopulation histories in the sea. Evol. Ecol. doi: 10.1007/s10682-011-9467-9. McCartney, M.A., Acevedo, J., Heredia, C., Rico, C.,
Queno-ville, B., Birmingham, E. et al. 2003. Genetic mosaic in a marine species flock. Mol. Ecol. 12: 2963–2973.
McMillan, W.O., Weigt, L.A. & Palumbi, S.R. 1999. Color pat-tern evolution, assortative mating and genetic differentiation in brightly colored butterflyfishes (Caetodontidae). Evolution 53: 247–260.
van der Meer, M.H., Jones, G.P., Hobbs, J.-P.A. & van
Herwer-den, L. 2012. Historic hybridization and introgression
between two iconic Australian anemonefish and contempo-rary patterns of population connectivity. Ecol. Evol. doi: 10. 1002/ece3.251.
Messemer, V., van Herwerden, L., Munday, P.L. & Jones, G.P. 2005. Phylogeography of color polymorphism in the coral reef fish pseudochromis fuscus, from Papua New Guinea and the Great Barrier Reef. Coral Reefs 24: 392–402.
Montanari, S.R., van Herwerden, L., Pratchett, M.S., Hobbs, J.P.A. & Fugedi, A. 2012. Reef fish hybridization: lessons learnt from butterflyfishes (genus Chaetodon). Ecol. Evol. 2: 310–328.
Narum, S.R. 2006. Beyond Bonferroni: less conservative analy-ses for conservation genetics. Conserv. Genet. 7: 783–787. Nielsen, R. & Beaumont, M.A. 2009. Statistical inferences in
phylogeography. Mol. Ecol. 18: 1034–1047.
Palumbi, S.R. 2003. Population genetics, demographic connec-tivity and the design of marine reserves. Ecol. Appl. 13: S146–158.
Palumbi, S.R., Vollmer, S., Romano, S., Oliver, T. & Ladner, J. 2011. The role of genes in understanding the evolutionary ecology of reef building corals. Evol. Ecol. doi: 10.1007/ s10682-011-9517-3.
Pannell, J.R. & Charlesworth, B. 2000. Effects of metapopula-tion processes on measures of genetic diversity. Philos. Trans. R. Soc. Lond., B, Biol. Sci. 355: 1851–1864.
Posada, D. 2008. JMODELTEST: phylogenetic model averaging.
Mol. Biol. Evol. 25: 1253–1256.
Puebla, O., Bermingham, E., Guichard, F. & Whiteman, E. 2007. Color pattern as a single trait driving speciation in Hypoplectrus coral reef fishes? Proc. Biol. Sci. 274: 1265–1271. Pyle, R.L. & Randall, J.E. 1994. A review of hybridization in
marine angelfishes (Perciformes: Pomacanthidae). Environ. Biol. Fishes 41: 127–145.
Quattro, J.M. & Jones, W.J. 1999. Amplification primers that target locus-specific introns in actinopterygian fishes. Copeia 1999: 191–196.
Quenouille, B., Hubert, N., Bermingham, E. & Planes, S. 2011. Speciation in tropical seas: allopatry followed by range expansion. Mol. Phylogenet. Evol. 58: 546–552.
Rambaut, A. & Drummond, A.J. 2007. Tracer v1.4. URL http://beast.bio.ed.ac.uk/Tracer
Ramon, M.L., Lobel, P.S. & Sorenson, M.D. 2003. Lack of mitochondrial genetic structure in hamlets (Hypopletcturus spp.): recent speciation or ongoing hybridization? Mol. Ecol. 12: 2975–2980.
Ramos-Onsins, S.E. & Rozas, J. 2002. Statistical properties of new neutrality tests against population growth. Mol. Biol. Evol. 19: 2092–2100.
Randall, J.E. 1998. Zoogeography of shore fishes of the Indo-Pacific region. Zool. Stud. 37: 227–268.
Randall, J.E. 2002. Surgeonfishes of the World. Mutual Publishing and Bishop Museum Press, Honolulu, HI.
Randall, J.E. & Bell, L.J. 1992. Naso caesius a new acanthurid fish from the central pacific. Pac. Sci. 46: 344–352.
Reece, J.S., Bowen, B.W., Joshi, K., Goz, V. & Larson, A. 2010. Phylogeography of two moray eels indicates high dis-persal throughout the Indo-Pacific. J. Hered. 101: 391–402. Rocha, L.A. & Bowen, B.W. 2008. Speciation in coral-reef
fishes. J. Fish Biol. 72: 1101–1121.
Rocha, L.A., Craig, M.T. & Bowen, B.W. 2007. Phylogeography and the conservation of coral reef fishes. Coral Reefs 26: 501–512.